. 2025 Apr;4(4):397-411.
doi: 10.1038/s44161-025-00623-3. Epub 2025 Mar 7.

Genetic tracing and topography of spontaneous and stimulated cardiac regeneration in mice

Affiliations

Genetic tracing and topography of spontaneous and stimulated cardiac regeneration in mice

Ilaria Secco et al. Nat Cardiovasc Res. 2025 Apr.

Abstract

Despite recent efforts to stimulate endogenous cardiomyocyte proliferation for cardiac regeneration, the lack of reliable in vivo methods for monitoring cardiomyocyte replication has hindered our understanding of its mechanisms. Thymidine analogs, used to label proliferating cells, are unsuitable for long-term cardiac regeneration studies as their DNA incorporation elicits a damage response, leading to their elimination. Here we present CycleTrack, a genetic strategy based on the transcriptional activation of Cre recombinase from a temporally regulated cyclin B2 promoter segment, for permanent labeling of cardiomyocytes passing through the G2/M phase. Using CycleTrack, we visualized cardiomyocyte turnover in neonatal and adult mice under various conditions, including pregnancy, increased ventricular afterload, and myocardial infarction. CycleTrack also provided visual and quantitative evidence of ventricular remuscularization following treatment with pro-regenerative microRNAs. We identify the subendocardium as a key site of mitotic activity and provide a mode of cardiomyocyte division along their short axis. CycleTrack is a powerful tool to monitor cardiomyocyte renewal during regenerative interventions.


Conflict of interest statement

Competing interests: M.G. is the scientific founder, consultant, member of the Board, and equity holder in Forcefield Therapeutics and Heqet Therapeutics and founder and equity holder of Purespring Therapeutics. The remaining authors declare no competing interests.

Figures

Fig. 1
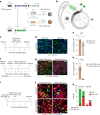
Fig. 1. BrdU and EdU incorporation is unsuitable for long-term labeling studies in vivo.
a, Schematic for 20 mg kg−1 BrdU or EdU single injection in P1 mice. bd, Representative immunofluorescence images (c) and quantification of CMs (b) and non-CMs (d) for BrdU/EdU incorporation (n = 3 mice; 500 to 1,000 total CMs per mouse; two-way analysis of variance (ANOVA) with Šidák’s multiple comparisons: P > 0.05). Arrowhead, BrdU/EdU-positive CM; asterisk, BrdU/EdU-positive non-CM. Scale bars, 20 μm. Data are mean ± s.d. e, Schematic for 20 mg kg−1 BrdU/EdU every other day injection in P2 mice. fh, Representative immunofluorescence images (h) and quantification of CMs (f) and non-CMs (g) for BrdU/EdU incorporation (n = 4 mice; 400 to 1,000 total CMs per mouse; two-way ANOVA with Tukey’s multiple comparisons). Scale bars, 20 μm. Data are mean ± s.e.m. i, Body weight at the time of injection (n = 4; repeated measures two-way ANOVA with Dunnett’s multiple comparisons). Data are mean ± s.d. j, Immunofluorescence staining of cardiac troponin I (cTnI), γH2AX, and BrdU/EdU with insets. Arrows, γH2AX-positive nuclei. Scale bars, 10 μm. k, Quantification of γH2AX-positive and γH2AX-BrdU/EdU double-positive CMs and non-CMs (n = 2 mice for saline, n = 3 for BrdU/EdU group; 100 to 300 total CMs per mouse; two-way ANOVA with Dunnett’s multiple comparisons). Data are mean ± s.e.m. Source data
Fig. 2
Fig. 2. Genetic tracing of mitoses using CycleTrack.
a, Schematic of the Z/EG reporter for Cre recombinase activation and the AAV vectors carrying either CyB- or CMV-driven Cre recombinase. b, Diagram of the cell cycle of a cell with integrated Z/EG reporter transfected or transduced with CyB–Cre. ce, Experimental outline (c), representative immunofluorescence images (d), and quantification (e) of C2C12 myoblasts transfected with the Z/EG reporter and either CMV–Cre or CyB–Cre (n = 4 replicates; 1,800 to 3,700 total cells per replicate; Mann–Whitney test, two sided). Scale bars, 100 μm. Data are mean ± s.e.m. fh, Experimental outline (f), representative immunofluorescence images (g), and quantification (h) of C2C12 myotubes transfected with the Z/EG reporter and transduced with either AAV6–CMV–Cre or AAV6–CyB–Cre (n = 4 different replicates; 650 to 1,100 total myotubes per replicate; Mann–Whitney test, two sided). Scale bars, 100 μm. Data are mean ± s.e.m. ik, Experimental outline (i), representative immunofluorescence images (j), and quantification (k) of CMs from neonatal Z/EG mice transfected with either cel-miR-67 or hsa-miR-199a-3p and transduced with either AAV6–CMV–Cre or AAV6–CyB–Cre (n = 3 replicates for cel-miR-67, n = 6 for hsa-miR-199a-3p; 990 to 2,200 total CMs per replicate). Scale bars, 20 μm. Data are mean ± s.e.m. Source data
Fig. 3
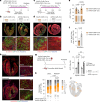
Fig. 3. CycleTrack to detect mitotic CMs in neonatal and adult mice and after apical resection in neonatal mice.
a,c, Schematic of neonatal (a) and adult (c) Z/EG mice injected, respectively, at P1 or P90 with either AAV9–CMV–Cre or CyB–Cre and 20 mg kg−1 BrdU every other day. i.m.c., intramyocardial; i.p., intraperitoneal. b,df, Representative immunofluorescence images for newborn (b) and adult (d) mice and quantification of GFP-positive CMs (e) and their BrdU/GFP double-positive fraction (f) (n = 4; one-way ANOVA with Tukey’s multiple comparisons for e and Mann–Whitney test for f). Scale bars, 100 μm. Data are mean ± s.e.m. gi, Schematic (g), representative immunofluorescence images (h), and quantification (i) of Z/EG mice injected with CyB–Cre after eventual resection of the heart apex at P1 (n = 4; one-way ANOVA with Tukey’s multiple comparisons). Scale bars, 100 μm. Data are mean ± s.e.m. j, Illustration showing the topographic areas for the assessment of GFP-positive CM regional distribution. k, Quantification of GFP-positive CM distribution in different regions of the heart (n = 3; two-way ANOVA with Šidák’s multiple comparisons). Data are mean ± s.d. Source data
Fig. 4
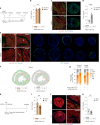
Fig. 4. CycleTrack detects CM proliferation during pregnancy and after TAC.
a, Schematic of Z/EG female mice receiving either AAV9–CMV–Cre or AAV9–CyB–Cre and eventually mated after 4 days. b,c, Quantification (b) and representative images (c) of GFP-positive CMs in Z/EG female mice receiving AAV9–CMV–Cre (n = 3; Mann–Whitney test, two sided). Scale bars, 100 μm. Data are mean ± s.e.m. d,e, Quantification (d) and representative images (e) of GFP-positive CMs in Z/EG female mice receiving AAV9–CyB–Cre (n = 4; Mann–Whitney test, two sided). Scale bars, 100 μm. Data are mean ± s.e.m. f, Illustration showing the topographic areas for the assessment of GFP-positive CMs regional distribution. g, Quantification of GFP-positive CM distribution in different regions of the ventricles (n = 3 for CMV–Cre and n = 4 for CyB–Cre; two-way ANOVA with Šidák’s multiple comparisons). Data are mean ± s.d. hk, Schematic (h), quantification (i,k), and representative immunofluorescence images (j) of GFP-positive CMs in Z/EG mice receiving either AAV9–CMV–Cre (i) or AAV9–CyB–Cre (k) after eventual TAC procedure (n = 3 for sham group and n = 4 for TAC group; Mann–Whitney test, two sided). Scale bars, 100 μm. Data are mean ± s.e.m. Source data
Fig. 5
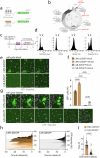
Fig. 5. Visualization of cardiac regeneration upon miRNA treatment after myocardial infarction and mode of CM replication.
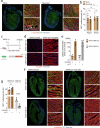
ac, Schematic (a), quantification (b), and representative immunofluorescence images (c) of GFP-positive CMs in Z/EG mice receiving AAV9–CyB–Cre and the listed treatments after LAD ligation (n = 4; one-way ANOVA with Dunnett’s multiple comparisons, P < 0.05 day 60 versus day 30). Scale bars, 100 μm. Data are mean ± s.e.m. d,e, Illustration and example image (d) and quantification (e) of GFP-positive CMs found as singlets or doublets at day 60 after infarction (n = 4 for control-treated mice, n = 3 for miRNA-treated mice; two-way ANOVA with Dunnett’s multiple comparisons). Data are mean ± s.e.m. f,g, Illustration and example image (f) and quantification (g) of longitudinal GFP-positive CM doublets likely derived from division along the short or the long axis at day 60 after infarction (n = 4 for control-treated mice, n = 3 for miRNA-treated mice; two-way ANOVA with Dunnett’s multiple comparisons). Data are mean ± s.e.m. Source data
Extended Data Fig. 1
Extended Data Fig. 1. Dose-response study for BrdU/EdU incorporation in mouse hearts.
a, Quantification of BrdU/EdU-positive nuclei in the heart of mice injected at P1 with indicated doses of the analog and analyzed after 48 hr (n = 3 different animals; 600 to 2000 total CMs per animal; two-way ANOVA with Šidák’s multiple comparisons). Doses are adjusted to mol/kg. Data are displayed as mean±s.e.m. b, Representative immunofluorescence images (out of at least 40 different images analyzed) for the indicated doses. Scale bar: 20 μm. c, Representative immunofluorescence images (out of at least 40 different images analyzed) used to quantify BrdU- and EdU-positive nuclei. Arrowhead: BrdU/EdU-positive CM. Scale bar: 20 μm. Source data
Extended Data Fig. 2
Extended Data Fig. 2. Use of CyB-driven destabilized GFP to study the kinetics of CyB activation.
a, Schematic of the destabilized GFP expressing constructs. b, Diagram of a typical cell cycle with Cyclins and CDKs regulating the progression of each phase. In red: inhibitors used to achieve G0/G1 block in U-2 OS cells. c, Outline for the time-lapse recording of U-2 OS cells transfected with either CMV- or CyB-driven d2EGFP. Twenty-four hr after transfection, the cell cycle was blocked for 24 hr and eventually released for additional 48 hr. Cells were transfected with a relatively low amount of plasmid (10 ng/well) to avoid aberrant promoter activation. d, Flow cytometry profile of U-2 OS DNA content (propidium iodide, PI) in the indicated conditions (min 4000 cells per condition). 2n: diploid; 4n: tetraploid. e-g, Quantification (f) and representative frames of the time-lapse of U-2 OS cells transfected with either CMV- or CyB-driven d2EGFP blocked in G0/G1 (e), or released from the cell cycle block (g). Arrow: cell starting to produce d2EGFP; asterisk: mitosis; dot: mother (t1) and daughter cells (t65); n = 4 different replicates; 1600 to 4500 total cells per replicate; two-way ANOVA with Tukey’s multiple comparisons. Scale bar: 50 μm. Data are displayed as mean±s.e.m. h, d2EGFP intensity over time of U-2 OS cells transfected with CMV- or CyB-driven d2EGFP after cell cycle release up to mitosis (set as t = 0). (n = 12 from four independent experiments; Y-axis offset: 20 AU). i, Quantification of the interval between the appearance of GFP signal and mitosis (n = 46 from four independent biological replicates; Mann-Whitney test, two sided). Individual values and median bars are displayed. Source data
Extended Data Fig. 3
Extended Data Fig. 3. CMV-driven Cre recombinase in neonatal Z/EG hearts after apical resection and CycleTrack response to p21 overexpression in neonatal Z/EG mice.
Representative immunofluorescence images (a) and quantification (b) of Z/EG mice injected with AAV9-CMV-Cre after eventual resection of the heart apex at P1 (n = 4; one-way ANOVA with Tukey’s multiple comparisons). Scale bar: 100 μm. Data are displayed as mean±s.e.m. c-f, Schematic (c) of neonatal Z/EG mice injected at P1 with AAV9-CMV-Cre or CyB-Cre and AAV9-Control of AAV9-p21-mScarlet. Real-time PCR quantification (e) of p21 (CDKN1A) normalized on GAPDH and expressed as fold change over AAV9-Control (n = 4; unpaired t-test, two sided). Data are displayed as mean±s.e.m. Representative immunofluorescence images for mScarlet (d) and GFP (f) and quantification of GFP-positive CMs (g) (n = 5; unpaired t-test, two sided). Scale bar: 100 μm. Data are displayed as mean±s.e.m. Source data
Extended Data Fig. 4
Extended Data Fig. 4. Neighboring CycleTrack-positive CMs during pregnancy and echocardiography assessment of Z/EG mice with TAC.
a,b Representative images and quantification of GFP-positive CMs found as singlets or doublets in Z/EG female mice receiving AAV9-CyB-Cre (n = 4 different animals; Mann-Whitney test, two sided). The green arrows indicate the doublets. Scale bar: 100 μm. Data are displayed as mean±s.e.m. c, Representative immunofluorescence images of Z/EG mouse hearts receiving AAV9-CMV-Cre in either sham or TAC condition. Scale bar: 100 μm. d,e, Echocardiographic measurements of left ventricular anterior wall thickness in diastole (LVAWd) (d) and ejection fraction (e) at two weeks after sham or TAC procedure. (n = 2-5 different animals; one-way ANOVA with Tukey’s multiple comparisons). Data are displayed as mean±s.e.m. Source data
Extended Data Fig. 5
Extended Data Fig. 5. Cardiomyocyte nucleation in CycleTrack-positive population after infarction and miR-199a treatment.
Representative immunofluorescence images (b) and quantification (a,c) of the number of nuclei per GFP-negative and GFP-positive CMs isolated from the infarct border zone of Z/EG mice 30 days after LAD coronary artery ligation and injection with AAV9-CyB-Cre and either AAV9-Control or AAV9-miR-199a (n = 3 different animals; 30 to 60 cells per GFP-positive cells per animal, 90 to 110 GFP-negative cells per animal; one-way ANOVA with Tukey’s multiple comparisons). Data are displayed as mean±s.e.m. Scale bar: 20 μm. Source data
Extended Data Fig. 6
Extended Data Fig. 6. Gating strategy for flow cytometry analysis.
The panels refer to the flow cytometry profiles shown in Extended Data Fig. 2d.

References

    1. Poss, K. D., Wilson, L. G. & Keating, M. T. Heart regeneration in zebrafish. Science298, 2188–2190 (2002). - PubMed
    1. Lepilina, A. et al. A dynamic epicardial injury response supports progenitor cell activity during zebrafish heart regeneration. Cell127, 607–619 (2006). - PubMed
    1. Piatkowski, T., Mühlfeld, C., Borchardt, T. & Braun, T. Reconstitution of the myocardium in regenerating newt hearts is preceded by transient deposition of extracellular matrix components. Stem Cells Dev.22, 1921–1931 (2013). - PMC - PubMed
    1. Witman, N., Murtuza, B., Davis, B., Arner, A. & Morrison, J. I. Recapitulation of developmental cardiogenesis governs the morphological and functional regeneration of adult newt hearts following injury. Dev. Biol.354, 67–76 (2011). - PubMed
    1. Bergmann, O. et al. Evidence for cardiomyocyte renewal in humans. Science324, 98–102 (2009). - PMC - PubMed

MeSH terms

LinkOut - more resources