. 2025 Apr;26(7):1835-1862.
doi: 10.1038/s44319-025-00406-8. Epub 2025 Mar 7.

MIA40 suppresses cell death induced by apoptosis-inducing factor 1

Affiliations

MIA40 suppresses cell death induced by apoptosis-inducing factor 1

Ben Hur Marins Mussulini et al. EMBO Rep. 2025 Apr.

Abstract

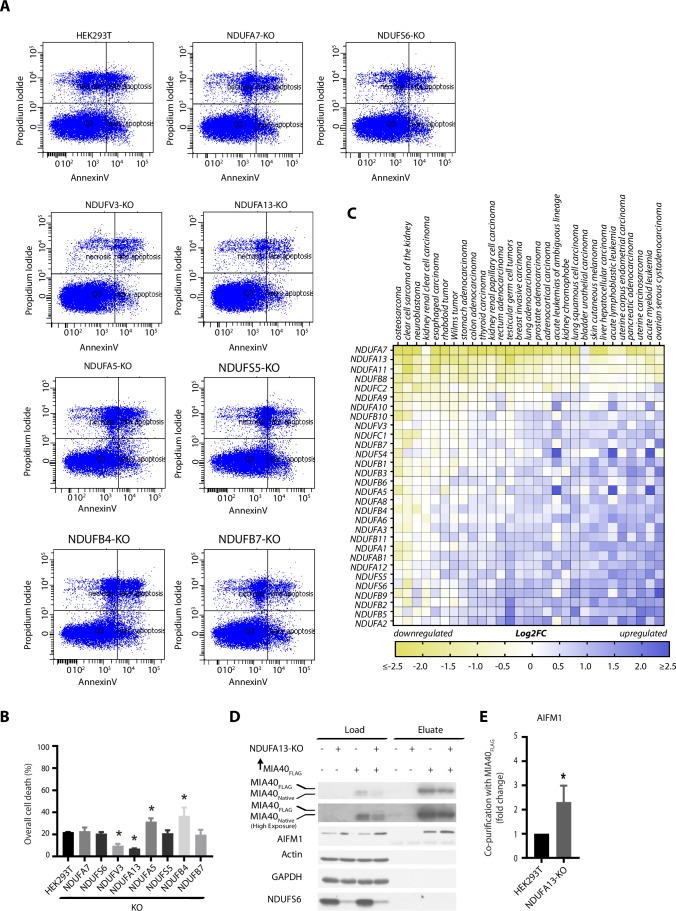
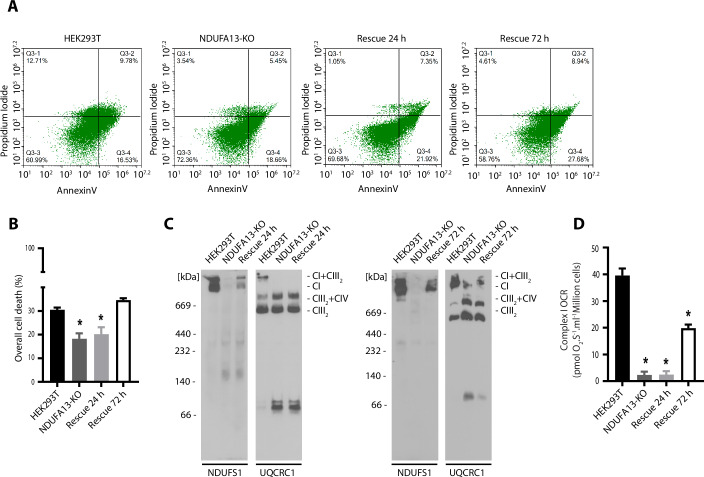
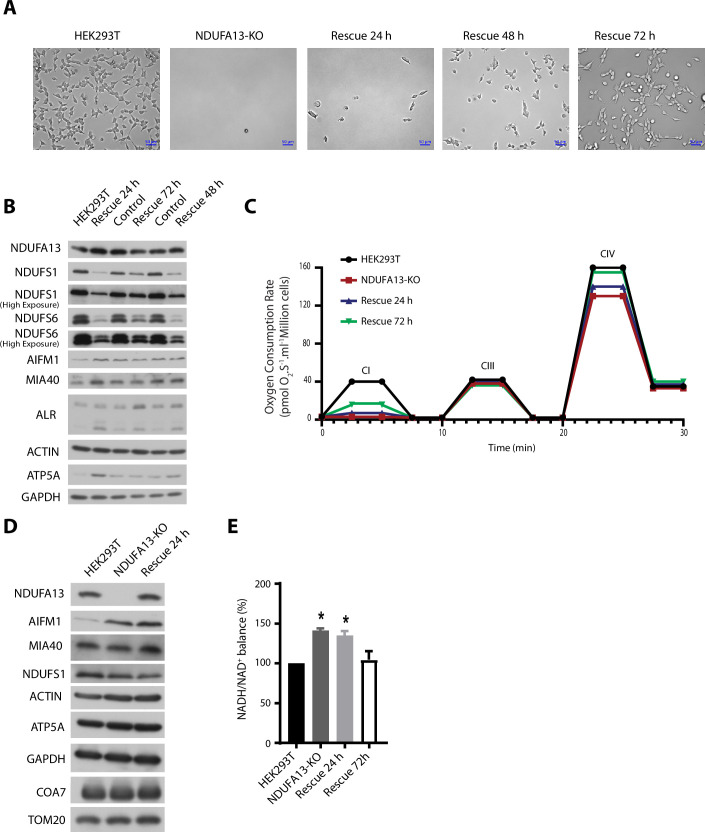
Mitochondria harbor respiratory complexes that perform oxidative phosphorylation. Complex I is the first enzyme of the respiratory chain that oxidizes NADH. A dysfunction in complex I can result in higher cellular levels of NADH, which in turn strengthens the interaction between apoptosis-inducing factor 1 (AIFM1) and Mitochondrial intermembrane space import and assembly protein 40 (MIA40) in the mitochondrial intermembrane space. We investigated whether MIA40 modulates the activity of AIFM1 upon increased NADH/NAD+ balance. We found that in model cells characterized by an increase in NADH the AIFM1-MIA40 interaction is strengthened and these cells demonstrate resistance to AIFM1-induced cell death. Either silencing of MIA40, rescue of complex I, or depletion of NADH through the expression of yeast NADH-ubiquinone oxidoreductase-2 sensitized NDUFA13-KO cells to AIFM1-induced cell death. These findings indicate that the complex of MIA40 and AIFM1 suppresses AIFM1-induced cell death in a NADH-dependent manner. This study identifies an effector complex involved in regulating the programmed cell death that accommodates the metabolic changes in the cell and provides a molecular explanation for AIFM1-mediated chemoresistance of cancer cells.

Keywords: Cancer; Metabolism; Mitochondria; Programmed Cell Death; Protein Import.


Conflict of interest statement

Disclosure and competing interests statement. The authors declare no competing interests.

Figures

Figure 1
Figure 1. NDUFA13-KO cells are resistant to AIFM1-induced cell death and have increased AIFM1 and MIA40 interaction.
(A) Flow cytometer scatter plot analysis of control HEK293T cells and complex I accessory subunit Knock Outs (KO) after the induction of cell death by AIFM1. (B) Quantification of overall cell death of the flow cytometer scatter plot analysis (A). Data shown are mean ± SEM (n = 3 biological replicates). Statistical significance was obtained by two-tailed unpaired t-test (compared to HEK293T: NDUFVA7-KO, p = 0.7833; NDUFS6-KO, p = 0.3734; NDUV3-KO, p = 0.0015; NDUFA13-KO, p < 0.0001; NDUFA5-KO, p = 0.0344; NDUFS5-KO, p = 0.7440; NDUFB4-KO, p = 0.0074; NDUFB7-KO p = 0.6396). *p < 0.05 indicates statistical difference from HEK293T. (C) Heatmap of log2-fold changes in median gene expression in cancer vs normal samples. mRNA-seq profiles originated from TCGA, TARGET, GTEx repositories and were retrieved using TNMplot.com tool. Blue and yellow color intensity indicate gene upregulation and downregulation, respectively. (D) Control HEK293T cells or complex I accessory subunit NDUFA13-KO transfected with an empty vector or MIA40FLAG were solubilized, and affinity purification of MIA40FLAG was performed. Fractions were analyzed by SDS–PAGE and Western blot. Load: 3%. Eluate: 100%. (E) Quantification of AIFM1-MIA40 interaction from (D) using ImageJ. Data shown are mean ± SEM (n = 3 biological replicates). Statistical significance was obtained by two-tailed unpaired t-test (p = 0.0286). *p < 0.05 indicates statistical difference from HEK293T. Source data are available online for this figure.
Figure 2
Figure 2. Rescue of complex I activity sensitizes NDUFA13-KO cells to AIFM1-induced cell death.
(A) Flow cytometer scatters plot analysis represents the control HEK293T cells, complex I accessory subunit NDUFA13-KO, and NDUFA13 overexpression in NDUFA13-KO after 24 h (Rescue 24 h), or 72 h (Rescue 72 h), in which cell death was induced by AIFM1. (B) Quantification of overall cell death from flow cytometer scatter plot analysis. Data shown are mean ± SEM (n = 3 biological replicates). Statistical significance was obtained by ordinary one-way ANOVA with Bonferroni multiple comparisons test (compared to HEK293T: NDUFA13-KO, p = 0.0055; Rescue 24 h, p = 0.0145; Rescue 72 h, p = 0.3683). *p < 0.05 indicates statistical difference from HEK293T. (C) Mitochondria isolated from control HEK293T, NDUFA13-KO, Rescue 24 and 72 h, were solubilized in digitonin buffer and analyzed by 3–13% gel BN-PAGE and Western blot. (D) Complex I activity of control HEK293T, NDUFA13-KO, Rescue 24 and 72 h. Data shown are mean ± SEM (n = 3 biological replicates). Statistical significance was obtained by one-way ANOVA with Bonferroni multiple comparisons test (compared to HEK293T: NDUFA13-KO, p < 0.0001; Rescue 24 h p < 0.0001; Rescue 24 h p = 0.0001). *p < 0.05 indicates statistical difference from HEK293T. Source data are available online for this figure.
Figure 3
Figure 3. MIA40 silencing sensitizes NDUFA13-KO cells to AIFM1-induced cell death.
(A) Predicted structure of the MIA40-AIFM1 dimer complex. (B) MIA40 binds to one monomer of AIFM1 dimer and forms hydrogen bonds with the second monomer of AIFM1 promoting stabilization of the complex. (C) Nuclear localization signal (NLS, green) of AIFM1 is concealed upon complex formation. (D) In the oxidized monomeric form of mouse AIFM1 (blue), W195 (W196 in human AIFM1) stabilizes the C-terminal loop and inhibits dimerization. (E) In the MIA40-AIFM1 dimer complex (brown and violet), W196 (W195 in mouse AIFM1) changes its conformation similar to reduced NAD-bound AIFM1 (green) which allows dimerization and abolishes AIFM1 cell death activity. (F) Cellular protein extracts were isolated from HEK293T cells, and complex I accessory subunit NDUFA13-KO transfected with two different siRNAs that target different regions of MIA40 mRNA or with siRNA non-targeting control. The samples were analyzed by reducing SDS–PAGE and Western blot. (G) Flow cytometer scatter plot analysis represents the control HEK293T cells and complex I accessory subunit NDUFA13-KO transfected with siRNAs that target different regions of MIA40 mRNA or with siRNA non-targeting control in which cell death was induced by AIFM1. (H) Quantification of overall cell death of flow cytometer scatter plot analysis (F). Data shown are mean ± SEM (n = 3 biological replicates). Statistical significance was obtained by an ordinary one-way ANOVA with Bonferroni multiple comparisons test (compared to HEK293T; NDUFA13-KO, p = 0.0035; NDUFA13-KO + siMIA40_1, p = 0.9994; NDUFA13-KO + siMIA40_2, p = 0.9735). *p < 0.05 indicates statistical difference from HEK293T cells transfected with siRNA scramble control. Source data are available online for this figure.
Figure 4
Figure 4. MIA40C55S substitution reduces AIFM1 and MIA40 interaction and increases sensitivity to cell death.
(A) Flow cytometer scatter plot analysis represents the Flp-In T-REx293 cells with induced expression of wild-type or variants of MIA40FLAG C53S or C55S in which cell death was induced by AIFM1 and subsequently these cells were treated with a vehicle, Necrostatine-1 or DPQ. (B) Quantification of overall cell death of flow cytometer scatter plot analysis (A). Data shown are mean ± SEM (n = 3 biological replicates) * and # p < 0.05 from an ordinary two-way ANOVA with Bonferroni multiple comparisons test. * Difference compared to Flp-In T-REx293 cells after induced cell death by AIFM1 (MIA40 WT, p > 0.9999; MIA40C53S, p > 0.9999; MIA40C55S, p = 0.0020). # Difference among each cell line treated with vehicle, Necrostatine-1 or DPQ after induced cell death by AIFM1 (For Flp-In T-REx293; Necrostatine-1, p = 0.0004; DPQ, p < 0.0001. For MIA40 WT: Necrostatine-1, p < 0.0001; DPQ, p < 0.0001. For MIA40C53S: Necrostatine-1, p < 0.0001; DPQ, p < 0.0001. For MIA40C55S: p < 0.0001; DPQ, p < 0.0001). (C) Cellular protein extracts from Flp-In T-REx293 cells expressing wild-type (MIA40WT), or variants of MIA40FLAG C53S or C55S (MIA40C53S or MIA40C55S), were subjected to an affinity purification via MIA40FLAG as a bait. Load and eluate fractions were analyzed by reducing SDS–PAGE and Western blot. Load: 2.5%. Eluate: 100%. (D) Quantification of AIFM1-MIA40 interaction from (C) using ImageJ. Data shown are mean ± SEM (n = 3 biological replicates) Statistical significance was obtained by an ordinary one-way ANOVA with Bonferroni multiple comparisons test (compared to MIA40WT: MIA40C53S p = 0.0702; MIA40C55S p = 0.0075). *p < 0.05 indicates statistical difference from Flp-In T-REx293 cells with induced expression of MIA40 wild-type. (E) Superimposed predicted structures of wild-type MIA40 (pink) and MIA40C55S variant (orange) bound to AIFM1 dimer (green and blue, respectively). The side chains of MIA40 D32 forming the hydrogen with R239 in the second AIFM1 monomer in the AIFM1 dimer are shown as ball representations. (F, G) The hydrogen bond formed between MIA40 and the second monomer in the AIFM1 dimer is lost upon MIA40C55S substitution. Source data are available online for this figure.
Figure 5
Figure 5. Expression of yeast NADH-ubiquinone oxidoreductase 2 sensitizes NDUFA13-KO cells to AIFM1-induced cell death.
(A) Flow cytometer scatter plot analysis represents the control HEK293T cells and complex I accessory subunit NDUFA13-KO transfected with an empty vector or Nde2-HA in which AIFM1 cell death was induced. (B) Quantification of overall cell death of flow cytometer scatters plot analysis (A). Data shown are mean ± SEM (n = 3 biological replicates) Statistical significance was obtained by an ordinary one-way ANOVA with Bonferroni multiple comparisons test (compared to HEK293T: HEK293T + Nde2-HA; p = 0.9994; NDUFA13-KO; p = 0.0172; NDUFA13-KO + Nde2-HA p = 0.9882). *p < 0.05 indicates statistical difference from HEK293T. (C) Affinity purification of MIA40FLAG from cellular lysates extracted from Flp-In T-REx293 cells in which the expression of MIA40FLAG was induced. Cells were transfected with an empty vector or Nde2-HA 24 h prior to MIA40FLAG induction. After 24 h of MIA40FLAG induction, cells were treated with a vehicle or rotenone during 12 h. (^) The antibody against HA decorates an artifact in the Flp-In T-REx293 cells transfected with an empty vector in load fractions which is at the same size as Nde2-HA. (#) HA antibody artifact. Load and eluate fractions were analyzed by reducing SDS–PAGE and Western blot. Load: 4%. Eluate: 100%. were subjected to affinity purification. Load and eluate fractions were analyzed by reducing SDS–PAGE and Western blot. Load: 2.5%. Eluate: 100%. (D) Quantification of AIFM1-MIA40 interaction from (C) using ImageJ. Data shown are mean ± SEM (n = 3 biological replicates). Statistical significance was obtained by two-tailed unpaired t-test. For MIA40 signal compared to Flp-In T-REx293: Rotenone, p = 0.0471; Rotenone + Nde2-HA, p = 0.0007. For COA7 signal compared to HEK293T: Rotenone p = 0.0471; Rotenone + Nde2-HA, p = 0.0655. *p < 0.05 indicates statistical difference from Flp-In T-REx293 cells with induced expression of MIA40FLAG treated with a vehicle. Source data are available online for this figure.
Figure EV1
Figure EV1. Complex I accessory subunits KO cells screen for metabolic profile and resistance to AIFM1-induced cell death.
(A) control HEK293T cells and correspondent complex I accessory subunits knock outs (KO) cell lines viability accessed by The CellTiter 96® AQueous One Solution Reagent after cell death induced by AIFM1. Data shown are mean ± SEM (n = 3 biological replicates) Statistical significance was obtained by an ordinary one-way ANOVA with Bonferroni multiple comparisons test (compared to HEK293T: NDUFA7-KO, p > 0.9999; NDUFS6-KO, p > 0.9999; NDUFV3-KO, p = 0.0003; NDUFA13-KO, p = 0.0012; NDUFA5-KO, p = 0.0153; NDUFS5-KO, p > 0.9999; NDUFB4-KO, p = 0.0064; NDUFB7-KO, p > 0.9999). *p < 0.05 indicates a significant difference compared to the HEK293T cells. (B) control HEK293T cells and correspondent complex I accessory subunits KO cell lines survival accessed by sulforhodamine b after cell death induced by AIFM1. Data shown are mean ± SEM (n = 3 biological replicates). Statistical significance was obtained by an ordinary one-way ANOVA with Bonferroni multiple comparisons test (compared to HEK293T: NDUFA7-KO, p > 0.9999; NDUFS6-KO, p > 0.9999; NDUFV3-KO, p = 0.0002; NDUFA13-KO, p = 0.0002; NDUFA5-KO, p = 0.0489; NDUFS5-KO, p > 0.9999; NDUFB4-KO, p = 0.0314; NDUFB7-KO, p > 0.9999). *p < 0.05 indicates a significant difference compared to the HEK293T cells. (C) Complex I activity of the control HEK293T cells and correspondent complex I accessory subunits KO cell lines. Data shown are mean ± SEM (n = 3 biological replicates). Statistical significance was obtained by an ordinary one-way ANOVA with Bonferroni multiple comparisons test (compared to HEK293T: NDUFA7-KO, p < 0.0001; NDUFS6-KO, p < 0.0001; NDUFV3-KO, p < 0.0001; NDUFA13-KO, p < 0.0001; NDUFA5-KO, p < 0.0001; NDUFS5-KO, p < 0.0001; NDUFB4-KO, p < 0.0001; NDUFB7-KO, p < 0.0001). *p < 0.05 indicates a significant difference compared to the HEK293T cells. (D) NADH/NAD+ balance of the control HEK293T cells and correspondent complex I accessory subunits KO cell lines. Data shown are mean ± SEM (n = 3 biological replicates). Statistical significance was obtained by an ordinary one-way ANOVA with Bonferroni multiple comparisons test (compared to HEK293T: NDUFA7-KO, p = 0.5571; NDUFS6-KO, p = 0.0476; NDUFV3-KO, p = 0.0007; NDUFA13-KO, p = 0.0018; NDUFA5-KO, p = 0.9997; NDUFS5-KO, p = 0.7218; NDUFB4-KO, p = 0.8921; NDUFB7-KO, p = 0.6560). *p < 0.05 indicates a significant difference compared to the HEK293T cells. (E) control HEK293T, NDUFA13- and NDUFB4-KO cell lines metabolic consumption of 31 different metabolites. Data shown are mean ± SEM (n = 4 or 3 biological replicates per substrate). Statistical significance was obtained by an ordinary two-way ANOVA with Bonferroni multiple comparisons test. For succinate oxidation, p < 0.0001. For fumaric acid oxidation, p = 0.0207. For pyruvic acid + L-malic acid 100 µM oxidation, p = 0.0390. # p < 0.05 indicates difference between NDUFA13-KO and NDFUB4-KO. The remaining statistical comparisons are presented in Table EV3. (F) Cellular protein extracts were isolated from the control HEK293T cells and correspondent complex I accessory subunits KO cell lines. The samples were analyzed by reducing SDS–PAGE and Western blot. (G) Quantification of AIFM1 expression from (F) using ImageJ. Data shown are mean ± SEM (n = 3 biological replicates). Statistical significance was obtained by an ordinary one-way ANOVA with Bonferroni multiple comparisons test (compared to HEK293T: NDUFV3-KO, p = 0.0015; NDUFA5-KO, p > 0.9999; NDUFA13-KO; p < 0.0001; NDUFB4-KO; p > 0.9999). *p < 0.001 indicates a significant difference compared to the HEK293T cells. (H) Localization of mitochondrial proteins analyzed by limited degradation by proteinase K in intact mitochondria (250 mM sucrose) or mitoplasts (100, 25, and 5 mM sucrose). The samples were analyzed by SDS–PAGE and Western blot. OM, outer membrane; IM, inner membrane; IMS, intermembrane space.
Figure EV2
Figure EV2. NADH increases AIFM1 and MIA40 interaction.
(A) control HEK293T cells transfected with an empty plasmid or MIA40FLAG were solubilized, and the affinity purification of MIA40FLAG was performed in the presence of 100 μM NADH. Fractions were analyzed by SDS–PAGE and Western blot. Load 2.5%; Eluate: 100%. (B) HEK293T cells were transfected with an empty plasmid or MIA40FLAG for 48 h and then were incubated with 10 nM or 100 nM rotenone for 12 h. Afterwards, the cells were solubilized and the affinity purification of MIA40FLAG was performed. Fractions were analyzed by SDS–PAGE and Western blot. Load 2.5%; Eluate: 100%. (C) HEK293T cells complex I activity after 12 h treatment of 10 nM rotenone. Data shown are mean ± SEM (n = 3 biological replicates). Statistical significance was obtained by two-tailed unpaired t-test p = 0.0007. *p < 0.05 indicates significant differences between groups. (D) HEK293T cells were treated with 10 nM rotenone for 12 h and afterwards, the NADH/NAD+ balance was measured. Data shown are mean ± SEM (n = 3 biological replicates). Statistical significance was obtained by two-tailed unpaired t-test p = 0.0034. *p < 0.05 indicates significant differences between groups.
Figure EV3
Figure EV3. Rescue of complex I activity in NDUFA13-KO cells.
(A) Contrast microscopy capture of the control HEK293T cells, complex I accessory subunit NDUFA13-KO (NDUFA13KO), and overexpression of NDUFA13 by plasmid transfection in NDUFA13-KO cells after 24 h (Rescue 24 h), 48 h (Rescue 48 h), or 72 h (Rescue 72 h). Cells were cultured and transfected in high-glucose medium for indicated time points, and then shifted to galactose medium for 24 h. (B) Cellular protein extracts were isolated from the control HEK293T cells, Rescue 24, 48, and 72 h. Cells were cultured and transfected in high-glucose medium for indicated time points, and then shifted to galactose medium for 24 h. The samples were analyzed by reducing SDS–PAGE and Western blot. (C) High-resolution respirometry profile of control HEK293T, NDUFA13-KO, Rescue 24 and 72 h performed in high-glucose. (D) Cellular protein extracts were isolated from control HEK293T, NDUFA13-KO, and overexpression of NDUFA13 by plasmid transfection in NDUFA13-KO cells after 24 h in high-glucose. The samples were analyzed by reducing SDS–PAGE and Western blot. (E) NADH/NAD+ balance was measured in the control HEK293T, NDUFA13-KO, Rescue 24 h and 72 h. Data shown are mean ± SEM (n = 3 biological replicates). Statistical significance was obtained by an ordinary one-way ANOVA with Bonferroni multiple comparisons test (compared to HEK293T: NDUFA13-KO, p = 0.0001; Rescue 24 h, p = 0.0004; Rescue 72 h, p > 0.9999). *p < 0.05 indicates a significant difference from HEK293T cells.
Figure EV4
Figure EV4. Accuracy of the predicted structure of the MIA40-AIFM1 dimer complex.
The predicted structure of human MIA40-AIFM1 dimer complex is colored by (A), the chains composing the complex, (B) the AlphaFold per residue prediction confidence (pLLDT scores), (C) the Predicted Aligned Error (PAE), which reflects the confidence in the relative positions and orientations of parts of the predicted structure. Each color in (C) represents a coherent structural part of the complex, while the relative position of the parts highlighted by different colors remains ambiguous. (D) The overall structure of the MIA40-AIFM1 dimer with the region showed in the following panels indicated by the dashed line. The AlphaFold pLLDT scores for the AIFM1 C-loop showed a decrease in the confidence of the prediction when compared the (E), monomeric with (F), the dimeric form of the protein, indicating that the region is more likely to be unstructured when the AIFM1 dimerizes. (G) Further decrease of AIFM1 C-loop prediction quality was observed upon MIA40 binding.
Figure EV5
Figure EV5. Comparison of the AIFM1 dimer predicted and experimentally determined structures of the AIFM1 dimer.
(A) Hydrogen bond network formed by Glu412 and Arg448 in the naturally folded mouse dimer, and (B) the orthologous site formed by Glu413 and Arg449 in the predicted human AIFM1 dimer. (C) Side chains of residues that form the AIFM1 electron transfer chain analyzed in the crystal structures of mouse AIFM1 in oxidized monomeric (blue cartoon), its reduced dimeric form (pink cartoon), and the predicted human AIFM1 dimer (green cartoon). Residue numbers are provided for both orthologs of the protein (muse/human). The hydrogen bond network and conformation of the side chains at the dimerization interface were compared between (D), the naturally folded AIFM1 dimer, and (E), the predicted dimer. (F) The His454 (His453 in the mouse ortholog) side chain conformation was compared in the crystal structures of mouse oxidized monomeric AIFM1, its reduced dimeric form, and the predicted human AIFM1 dimer (color scheme same as in C).
Figure EV6
Figure EV6. Protein levels and localization of MIA40 variants.
(A) Total protein levels and (B) subcellular fractionation of Flp-In T-REx293 cells with induced expression of wild-type or MIA40FLAG variants C53S or C55S (MIA40WT, MIA40C53S or MIA40C55S, respectively). Total post-nuclear supernatant (T), cytosol (C), and mitochondria (M). The samples were analyzed by SDS–PAGE and Western blot.
Figure EV7
Figure EV7. Topology and activity of external NADH-ubiquinone oxidoreductase 2 tagged with HA at C-terminus (Nde2-HA).
(A) Subcellular localization of Nde2-HA upon its transfection in the HEK293T cells. Cellular protein extracts (T) or isolated mitochondria (M) of HEK293T cells transfected with an empty plasmid or Nde2-HA were analyzed by reducing SDS–PAGE and Western blot. (B) subcellular fractionation of the HEK293T cells transfected with an empty vector or Nde2-HA. Total post-nuclear supernatant (T), cytosol (C), and mitochondria (M). The samples were analyzed by SDS–PAGE and Western blot. (C) Submitochondrial localization of Nde2-HA upon its transfection in the HEK293T cells analyzed by limited degradation by proteinase K in intact mitochondria (250 mM sucrose) or mitoplasts (5 mM sucrose). The samples were analyzed by SDS–PAGE and Western blot. (D) Contrast microscopy of HEK293T and complex I accessory subunit NDUFA13-KO transfected with an empty plasmid or Nde2-HA. (E) Contrast microscopy images of HEK293T and NDUFA13-KO cells transfected with increasing concentrations of the Nde2-HA plasmid after 48 h. (F) Cellular protein extracts were isolated from HEK293T and NDUFA13-KO cells that were transfected with different concentrations of Nde2-HA plasmid for 48 h. The samples were analyzed by reducing SDS–PAGE and Western blot. (G) HEK293T cells were transfected with an empty vector or Nde2-HA for 48 h. Then, the cells were incubated with a vehicle or 10 nM rotenone for 12 h. Afterward, the measurements of NADH/NAD+ balance were performed. Data shown are mean ± SEM (n = 3 biological replicates). Statistical significance was obtained by an ordinary one-way ANOVA with Bonferroni multiple comparisons test (compared to HEK293T; HEK293T + Nde2-HA, p > 0.9999; HEK293T + rotenone, p = 0.0003; HEK293T + Nde2-HA + rotenone, p = 0.4753). *p < 0.05 indicates a significant difference from HEK293T cells treated with rotenone.

References

    1. Angerer H, Zwicker K, Wumaier Z, Sokolova L, Heide H, Steger M, Kaiser S, Nübel E, Brutschy B, Radermacher M et al (2011) A scaffold of accessory subunits links the peripheral arm and the distal proton-pumping module of mitochondrial complex I. Biochem J 437:279–288. 10.1042/bj20110359 - PMC - PubMed
    1. Banci L, Bertini I, Cefaro C, Ciofi-Baffoni S, Gallo A, Martinelli M, Sideris DP, Katrakili N, Tokatlidis K (2009) MIA40 is an oxidoreductase that catalyzes oxidative protein folding in mitochondria. Nat Struct Mol Bio 16:198–206. 10.1038/nsmb.1553 - PubMed
    1. Bano D, Prehn JHM (2018) Apoptosis-inducing factor (AIF) in physiology and disease: the tale of a repented natural born killer. EBioMedicine 30:29–37. 10.1016/j.ebiom.2018.03.016 - PMC - PubMed
    1. Barchiesi A, Wasilewski M, Chacinska A, Tell G, Vascotto C (2015) Mitochondrial translocation of APE1 relies on the MIA pathway. Nucleic Acids Res 43:5451–5464. 10.1093/nar/gkv433 - PMC - PubMed
    1. Bartha Á, Győrffy B (2021) TNMplot.com: a web tool for the comparison of gene expression in normal, tumor and metastatic tissues. Int J Mol Sci 22:2622. 10.3390/ijms22052622 - PMC - PubMed

MeSH terms

Substances

LinkOut - more resources