. 2025 Mar;5(3):437-449.
doi: 10.1038/s43587-025-00830-4. Epub 2025 Mar 7.

A torpor-like state in mice slows blood epigenetic aging and prolongs healthspan

Affiliations

A torpor-like state in mice slows blood epigenetic aging and prolongs healthspan

Lorna Jayne et al. Nat Aging. 2025 Mar.

Abstract

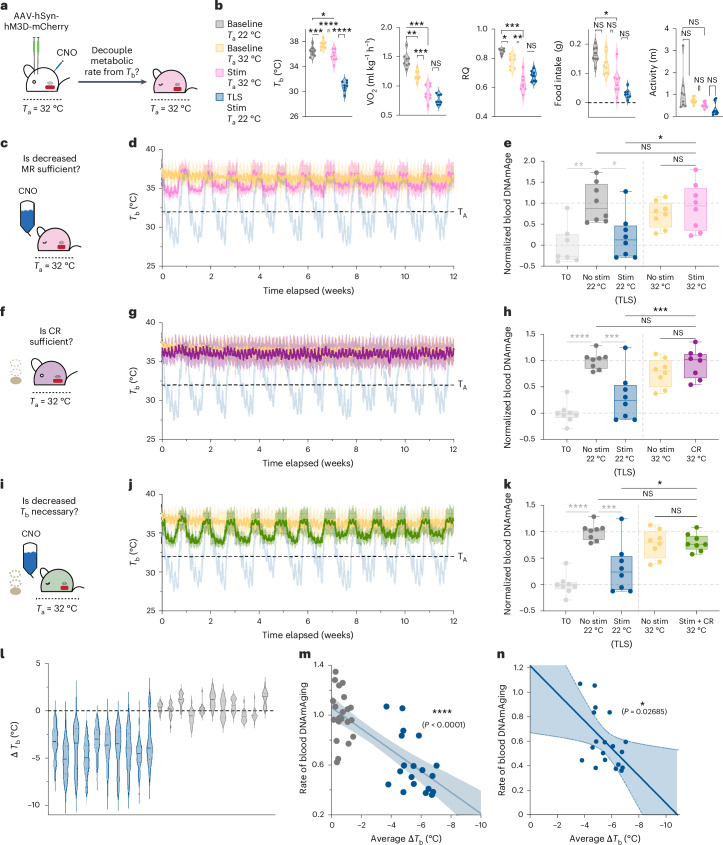
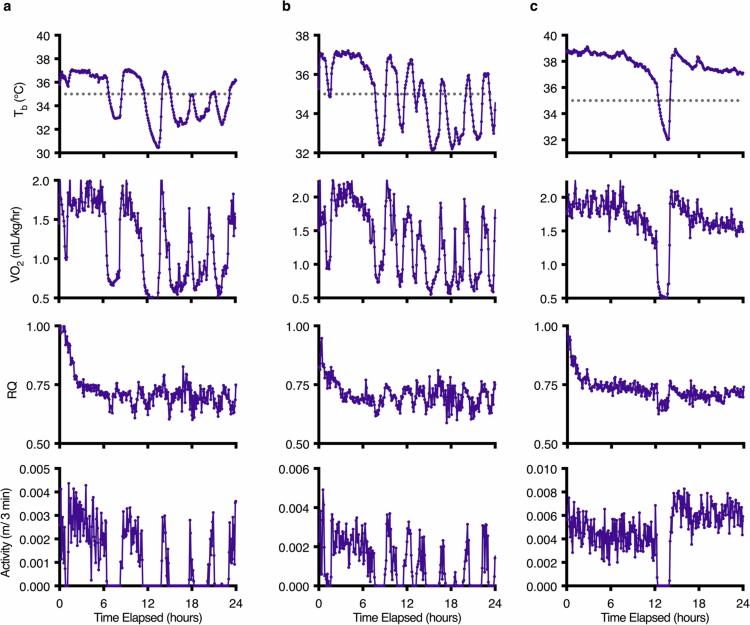
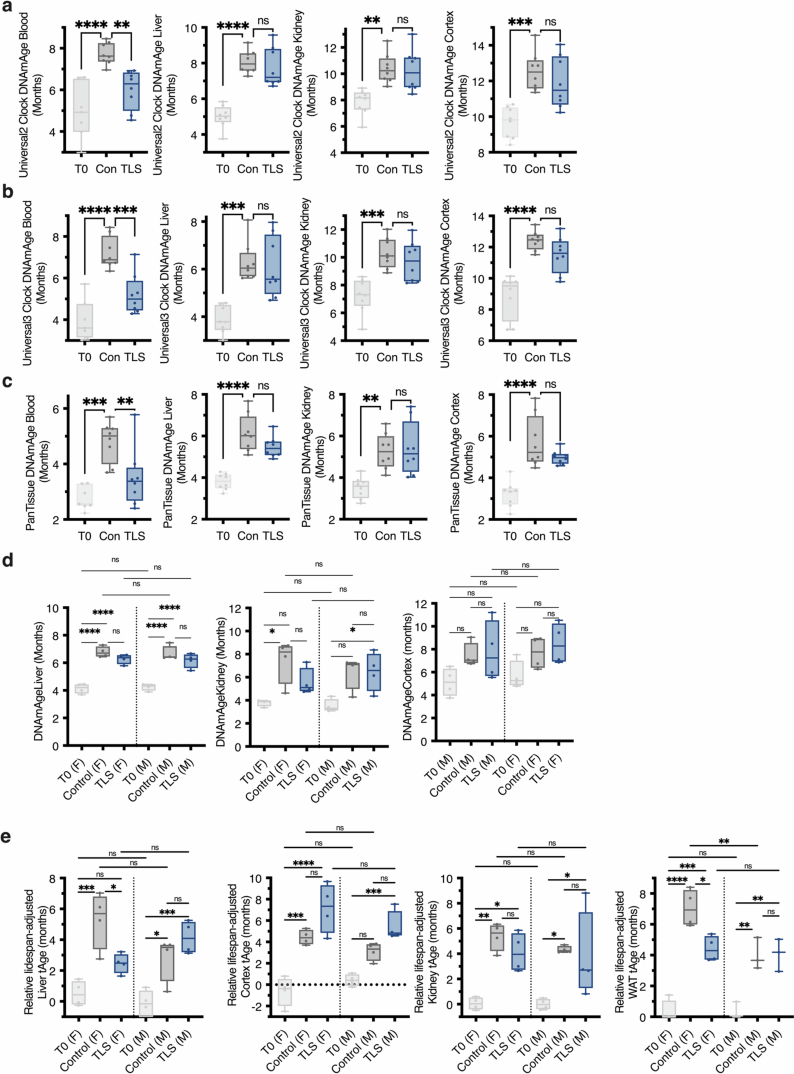
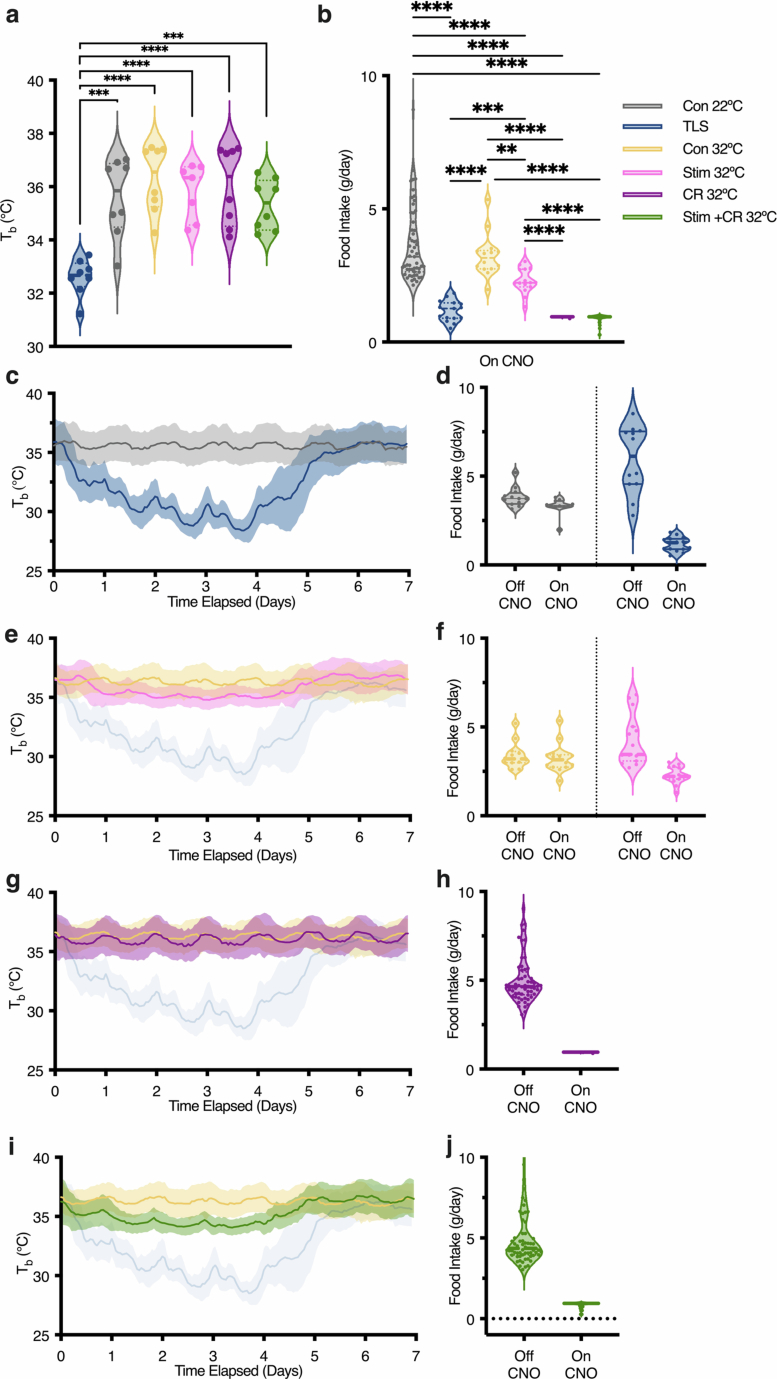
Torpor and hibernation are extreme physiological adaptations of homeotherms associated with pro-longevity effects. Yet the underlying mechanisms of how torpor affects aging, and whether hypothermic and hypometabolic states can be induced to slow aging and increase healthspan, remain unknown. Here we demonstrate that the activity of a spatially defined neuronal population in the preoptic area, which has previously been identified as a torpor-regulating brain region, is sufficient to induce a torpor-like state (TLS) in mice. Prolonged induction of TLS slows epigenetic aging across multiple tissues and improves healthspan. We isolate the effects of decreased metabolic rate, long-term caloric restriction, and decreased core body temperature (Tb) on blood epigenetic aging and find that the decelerating effect of TLSs on aging is mediated by decreased Tb. Taken together, our findings provide novel mechanistic insight into the decelerating effects of torpor and hibernation on aging and support the growing body of evidence that Tb is an important mediator of the aging processes.


Conflict of interest statement

Competing interests: S. Horvath and R.T.B. are founders of the non-profit Epigenetic Clock Development Foundation, which licenses several patents from UC Regents including a patent on the mammalian methylation array platform. These patents list S. Horvath as inventor. V.G.S. serves as an advisor to and/or has equity in Branch Biosciences, Ensoma, and Cellarity, all unrelated to this work. S. Hrvatin is an advisor to Apertura LLC, unrelated to this work. The other authors declare no competing interests.

Figures

Fig. 1
Fig. 1. Development of an inducible TLS in non-transgenic laboratory mice.
a, Schematic of injection of AAV-hSyn-hM3D-mCherry into the avMLPA and subsequent fasting. b, Tb over 24 h fasting (purple) compared to fed animals (gray). Data from fed animals plotted as mean ± s.e.m. (n = 4), data from fasted animals plotted as individual mice. When fasted, all mice engaged in natural fasting-induced daily torpor as defined by Tb < 35 °C with no arousal. Mice began engaging in torpor bouts ~10 h into the fasting interval. During torpor bouts, individual mice had an average Tb (33.0 ± 0.32 °C) lower than at baseline (37.9 ± 0.18 °C) as determined by paired t-test (**P = 0.002) and reported as mean ± s.e.m. c, Schematic of injection of AAV-hSyn-hM3D-mCherry into the avMLPA and subsequent CNO injection. d, Tb after administration of CNO to mice expressing AAV-hSyn-mCherry (controls, gray), and mice injected with AAV-hSyn-hM3D-mCherry (TLS, blue) (n = 4). CNO injection indicated by dashed gray line. Data plotted and reported as mean ± s.e.m. Average Tb of mice 6–24 h after CNO injection was lower in TLS animals (30.6 ± 0.27 °C) compared to controls (37.9 ± 0.18 °C) as determined by two-sided paired t-test (****P < 0.0001). e, Representative coronal section showing neurons in the avMLPA targeted by viral injection. hM3D expression in the avMLPA is visualized by mCherry (black) after viral injection. f, Thermal imaging of Tb of a mouse before (top) and after induction of TLS (bottom) illustrating the decrease in Tb that occurs during TLS. g, Schematic of TLS induction through continuous administration of CNO via drinking water. hl, Tb (h), VO2 (i), food intake (j), respiratory quotient (RQ) (k), and activity at baseline (dark gray) (l), during TLS (blue), and in recovery (light gray). Lines indicate mean; shading denotes ± s.e.m. (n = 8). Violin plots graphed as the average of each individual at baseline (Pre), during TLS (TLS), in recovery (Post), and during natural fasting-induced torpor bouts (Torp.) (purple; Extended Data Fig. 1a–c). All measured metabolic parameters had significant differences across conditions as quantified by Tukey’s multiple comparisons test (Tb Pre = 36.44 ± 0.26, TLS = 29.54 ± 0.30, Post = 36.71 ± 0.22, Torp. = 33.86 ± 0.30; Pre versus Torp. ****P < 0.0001; Torp. versus TLS, ****P < 0.0001; Torp. versus Post, ****P < 0.0001; Pre versus TLS, ****P < 0.0001; Pre versus Post, NS, P = 0.894; TLS versus Post, ****P < 0.0001) (VO2 Pre = 1.44 ± 0.04, TLS = 0.63 ± 0.04, Post = 1.37 ± 0.05, Torp. = 0.73 ± 0.05; Pre versus Torp., ****P < 0.0001; Torp. versus TLS, NS, P = 0.324; Torp. versus Post, **P = 0.0026; Pre versus TLS, ****P < 0.0001; Pre versus Post, NS, P = 0.6991; TLS versus Post, ***P = 0.0003) (Food intake Pre = 0.16 ± 0.01, TLS = 0.03 ± 0.01, Post = 0.20 ± 0.02, Torp. = 0 ± 0; Pre versus Torp., ****P < 0.0001; Torp. versus TLS, **P = 0.0017; Torp. versus Post, ****P < 0.0001; Pre versus TLS, ****P < 0.0001; Pre versus Post, NS, P = 0.2259; TLS versus Post, ***P = 0.0001) (RQ Pre = 0.85 ± 0.01, TLS = 0.69 ± 0.02, Post = 0.89 ± 0.01, Torp. = 0.67 ± 0.0; Torp. versus Pre, ****P < 0.0001; Torp. versus TLS, NS, P = 0.6233; Torp. versus Post, ****P < 0.0001; Pre versus TLS, ***P = 0.0004; Pre versus Post, NS, P = 0.1082; TLS versus Post, ***P = 0.0004), (Activity Pre = 1.11 ± 0.33, TLS = 0.20 ± 0.06, Post = 1.27 ± 0.17, Torp. = 0.03 ± 0.02; Torp. versus Pre, **P = 0.0036; Torp. versus TLS, *P = 0.0353; Torp. versus Post, ***P = 0.0002; Pre versus TLS, NS, P = 0.0504; Pre versus Post, NS, P = 0.8689; TLS versus Post, ***P = 0.0008). Data reported as mean ± s.e.m. m, meters. Source data
Fig. 2
Fig. 2. TLS slows epigenetic aging across multiple tissues.
a, Schematic of long-term TLS induction through repeated CNO administration. TLS mice were injected with pAAV-hSyn-hM3D(GQ)-mCherry, while control mice were injected with pAAV-hSyn-mCherry. Both TLS and control mice received repeated paired CNO administration. b, Tb of TLS (blue) (n = 8, 4 male mice, 4 female mice) and control (gray) (n = 8, 4 male mice, 4 female mice) mice over 12 weeks. Line represents mean; shading denotes ±s.d. c, Aggregate plot of Tb of TLS and control mice over 12-week experiment displayed over a 1-week interval. CNO administration marked by light blue shading between days 1 and 5. Lines and shading as in b. d, TLS mice had significantly lower average Tb per week (30.96 ± 0.19 °C) than control (Con) mice (35.58 ± 0.02 °C) while on CNO as determined by unpaired two-sided t-test (****P < 0.0001) (n = 96, 48 male mice, 48 female mice). Data reported as mean ± s.e.m. Data plotted as average Tb of individuals per week while on CNO. eh, Epigenetic age (DNAmAge) as measured using tissue-specific epigenetic clocks of age-matched mice before the experiment (T0, n = 8, 4 male mice, 4 female mice) and after 3 months (control, n = 8, 4 male mice, 4 female mice, and TLS n = 8, 4 male mice, 4 female mice). Data plotted as box plots indicating median, upper and lower quartiles, and whiskers extending to minimum and maximum values. Data reported as mean ± s.e.m. We found significant differences in epigenetic age between T0 (blood, 4.694 ± 0.2429; kidney, 3.650 ± 0.1529; liver, 4.193 ± 0.1031; cortex, 5.421 ± 0.4188) and control mice (blood, 6.03 ± 0.21; liver, 6.73 ± 0.14; kidney, 6.03 ± 0.47; cortex, 7.58 ± 0.38) across all tissues as measured by one-way ANOVA adjusted for multiple comparisons by Tukey’s HSD, validating the ability of epigenetic clocks to capture age-related changes over the time period (blood, **P = 0.0025; liver, ****P < 0.0001; kidney, ***P = 0.0001; cortex, *P = 0.0274). After 3 months, TLS mice (n = 8, 4 male mice, 4 female mice) had significantly lower epigenetic age in the blood (4.96 ± 0.24) (e) and liver (6.23 ± 0.14) (f) than control mice (blood, *P = 0.011; liver, *P = 0.043). We found no significant differences in the epigenetic age of the kidney (NS, P = 0.348) (g) and cortex (NS, P = 0.7438) (h) between control and TLS mice (kidney, 6.94 ± 0.55; cortex, 8.15 ± 0.69) as measured by one-way ANOVA adjusted for multiple comparisons by Tukey’s HSD. In the liver, kidney and cortex, TLS mice had significantly different epigenetic age than T0 mice (liver, ****P < 0.0001; kidney, **P = 0.0036; cortex, **P = 0.0052), while in the blood T0 mice had similar epigenetic age to TLS mice (NS, P = 0.7240). Source data
Fig. 3
Fig. 3. Long-term induction of TLS causes a cumulative and sustained decrease in blood epigenetic age and improves healthspan.
a, Blood epigenetic age was serially measured every 3 months in control (gray) and TLS (blue) mice over 9 months. Both control and TLS mice were injected with pAAV-hSyn-hM3D(GQ)-mCherry. TLS mice received repeated CNO administration, while control mice received water. Data plotted as box plots (25th to 75th percentiles) with whiskers from minimum to maximum with line at median. Simple linear regression was used to calculate the rate of blood epigenetic aging over 9 months; line represents regression; shading denotes 95% confidence interval (CI). TLS mice had a significantly slower rate of blood epigenetic aging 0.51 [0.46, 0.56] (r2 = 0.924, ****P < 0.0001) than control mice 0.81 [0.74, 0.86] (r2 = 0.953, ****P < 0.0001) (F = 58.14, DFn = 1, DFd = 70, ****P < 0.0001) over 9 months of TLS. Data reported as mean with 95% CI in brackets. b, Quantification of the average rate of epigenetic aging measured every 3 months for 9 months across individual mice. TLS mice had a significantly slower rate of epigenetic aging (n = 26, 0.545 ± 0.047) as determined by two-tailed unpaired t-test than control mice (n = 26, 0.892 ± 0.05) (****P < 0.0001). Data reported as mean ± s.e.m. c, Estimation plots of the difference between means of TLS and control mice across measured time points. Data reported as mean ± s.e.m. Significance determined by unpaired two-tailed t-tests. Before treatment began (T0), control (2.83 ± 0.075) and TLS (2.74 ± 0.03) mice had equivalent blood epigenetic age (control n = 11, 6 female mice, 5 male mice; TLS n = 10, 6 female mice, 4 male mice) (NS, P = 0.252). After 3, 6 and 9 months of TLS, TLS mice had increasingly lower mean epigenetic age than controls (at 3 months, TLS = 4.31 ± 0.168, Con = 5.37 ± 0.121, ****P < 0.0001 (control n = 11, 6 female mice, 5 male mice; TLS n = 10, 6 female mice, 4 male mice); at 6 months, TLS = 5.67 ± 0.180, Con = 7.87 ± 0.178, ****P < 0.0001 (control n = 10, 6 female mice, 4 male mice; TLS n = 9, 6 female mice, 3 male mice); at 9 months, TLS = 7.90 ± 0.330, Con = 10.89 ± 0.434, ***P = 0.0001 (control n = 8, 6 female mice, 2 male mice; TLS, n = 7, 5 female mice, 2 male mice). d, Schematic of testing for sustained epigenetic remodeling. After 9 months of TLS, mice were off CNO for 3 months, after which time blood epigenetic age was measured again. e, Quantification of blood epigenetic age 3 months post-TLS. Data plotted as box plots (25th to 75th percentiles) with whiskers from minimum to maximum with line at median. TLS mice (9.51 ± 0.305) still had significantly younger blood epigenetic age than control mice (10.96 ± 0.305), (**P = 0.0065) (control n = 7, 5 female mice, 2 male mice; TLS n = 6, 4 female mice, 2 male mice) as determined by two-tailed unpaired t-test. Data reported as mean ± s.e.m. f, Heat map of the average scores on frailty index measurements of TLS and control mice after 9 months of TLS (n = 7). Frailty index measurements are arranged in decreasing order of strongest correlation with age. g, Violin plots of frailty index scores of TLS mice and control mice on the five individual frailty index measurements that most strongly correlate with age and overall frailty index score. TLS mice scored significantly lower than control mice as determined by two-tailed unpaired t-test (TLS n = 7, 5 female mice, 2 male mice; control n = 9, 6 female mice, 3 male mice) on tail stiffening (TLS = 0.214 ± 0.101, Con = 0.611 ± 0.139, *P = 0.0463), gait disorders (TLS = 0 ± 0, Con = 0.222 ± 0.088, *P = 0.043), and kyphosis (TLS = 0.071 ± 0.071, Con = 0.333 ± 0.083, *P = 0.037), as well as overall frailty index score (TLS = 0.118 ± 0.034, Con = 0.238 ± 0.035, *P = 0.0290). Data reported as mean ± s.e.m. FI, frailty index. Source data
Fig. 4
Fig. 4. Decreased Tb mediates the rate of blood epigenetic aging during TLS.
a, Schematic of stimulating avMLPA neurons while housing mice at thermoneutrality (Ta = 32 °C) to decouple changes in metabolic rate from changes in temperature. b, Quantification of Tb, metabolic rate (VO2), respiratory quotient (RQ), food intake, and activity of mice at baseline and during stimulation of the avMLPA while housed at thermoneutrality (Ta = 32 °C) compared to mice at baseline and in TLS (Ta = 22 °C). Data plotted as the average of each individual mouse and reported as mean ± s.e.m. Significance determined by one-way ANOVA adjusted for multiple comparisons by Tukey’s HSD (Tb Baseline Ta 22 °C = 36.44 ± 0.26, Baseline Ta 32 °C = 37.50 ± 0.22, Stim Ta 32 °C = 35.73 ± 0.32, TLS (Stim Ta 22 °C) = 30.85 ± 0.28; TLS Stim Ta 22 °C versus Stim Ta 32 °C, ****P < 0.0001; TLS Stim Ta 22 °C versus Baseline Ta 22 °C, ****P < 0.0001; TLS Stim Ta 22 °C versus Baseline Ta 32 °C, ****P < 0.0001; Stim Ta 32 °C versus Baseline Ta 22 °C, *P = 0.0295; Stim Ta 32 °C versus Baseline Ta 32 °C, ****P < 0.0001; Baseline Ta 22 °C versus Baseline Ta 32 °C, ****P < 0.0001), (VO2 Baseline Ta 22 °C = 1.44 ± 0.04, Baseline Ta 32 °C = 1.17 ± 0.03, Stim Ta 32 °C = 0.88 ± 0.05, TLS (Stim Ta 22 °C) = 0.78 ± 0.03; TLS Stim Ta 22 °C versus Stim Ta 32 °C, NS, P = 0.1819; TLS Stim Ta 22 °C versus Baseline Ta 22 °C, ****P < 0.0001; TLS Stim Ta 22 °C versus Baseline Ta 32 °C, ***P = 0.0001; Stim Ta 32 °C versus Baseline Ta 22 °C, ***P = 0.0004; Stim Ta 32 °C versus Baseline Ta 32 °C, ***P = 0.0003; Baseline Ta 22 °C versus Baseline Ta 32 °C, **P = 0.0012), (RQ Baseline Ta 22 °C = 0.85 ± 0.01, Baseline Ta 32 °C = 0.78 ± 0.02, Stim Ta 32 °C = 0.63 ± 0.02, TLS (Stim Ta 22 °C) = 0.68 ± 0.01; TLS Stim Ta 22 °C versus Stim Ta 32 °C, NS, P = 0.1353; TLS Stim Ta 22 °C versus Baseline Ta 22 °C, ****P < 0.0001; TLS Stim Ta 22 °C versus Baseline Ta 32 °C, *P = 0.0104; Stim Ta 32 °C versus Baseline Ta 22 °C, **P = 0.0002; Stim Ta 32 °C versus Baseline Ta 32 °C, **P = 0.0025; Baseline Ta 22 °C versus Baseline Ta 32 °C, *P = 0.0101), (Activity Baseline Ta 22 °C = 1.11 ± 0.33, Baseline Ta 32 °C = 0.73 ± 0.06, Stim Ta 32 °C = 0.52 ± 0.05, TLS (Stim Ta 22 °C) = 0.33 ± 0.10, TLS Stim Ta 22 °C versus Stim Ta 32 °C, NS, P = 0.4208; TLS Stim Ta 22 °C versus Baseline Ta 22 °C, NS, P = 0.0627; TLS Stim Ta 22 °C versus Baseline Ta 32 °C, NS, P = 0.0674; Stim Ta 32 °C versus Baseline Ta 22 °C, NS, P = 0.3760; Stim Ta 32 °C versus Baseline Ta 32 °C, NS, P = 0.0702; Baseline Ta 22 °C versus Baseline Ta 32 °C, NS, P = 0.6862), (Food Intake Baseline Ta 22 °C = 0.16 ± 0.01, Baseline Ta 32 °C = 0.13 ± 0.01, Stim Ta 32 °C = 0.073 ± 0.02, TLS (Stim Ta 22 °C) = 0.03 ± 0.01, TLS Stim Ta 22 °C versus Stim Ta 32 °C, NS, P = 0.0760; TLS Stim Ta 22 °C versus Baseline Ta 22 °C, ****P < 0.0001; TLS Stim Ta 22 °C versus Baseline Ta 32 °C, ***, P = 0.005; Stim Ta 32 °C versus Baseline Ta 22 °C, *P = 0.0206; Stim Ta 32 °C versus Baseline Ta 32 °C, NS, P = 0.0711; Baseline Ta 22 °C versus Baseline Ta 32 °C, NS, P = 0.1285). c, Schematic of experimental design to determine sufficiency of decreased metabolic rate for effects on epigenetic aging. d, Tb over 12 week experiment of mice undergoing stimulation of avMLPA neurons while housed at thermoneutrality (Stim 32 °C, n = 7, 4 female mice, 3 male mice) plotted in pink and control non-stimulated mice housed at thermoneutrality (No Stim 32 °C, n = 8, 4 female mice, 4 male mice) plotted in orange. No Stim 32 °C and No Stim 22 °C mice were injected with pAAV-hSyn-mCherry and administered CNO. Tb of TLS mice shown in blue for reference (as previously shown in Fig. 2b); lines represent means; shading denotes s.d. e, To compare changes in epigenetic aging across experiments, blood DNAmAge was normalized to T0 = 0 ± 0.176 and No Stim 22 °C = 1 ± 0.166 (shown for reference, previously shown in Fig. 2b); data plotted as box plots (25th to 75th percentiles) with whiskers from minimum to maximum with line at median; data reported as mean ± s.e.m. Significance determined by one-way ANOVA adjusted for multiple comparisons by Tukey’s HSD. Stim 32 °C (0.911 ± 0.198) (n = 7, 4 female mice, 3 male mice) had similar blood epigenetic age to No Stim 32 °C mice (n = 8, 4 female mice, 4 male mice) (0.737 ± 0.11) (NS, P = 0.9475) and No Stim 22 °C mice (n = 8, 4 female mice, 4 male mice) (1.00 ± 0.166) (NS, P = 0.9955). Stim 32 °C had higher blood epigenetic age than TLS mice (n = 8, 4 male mice, 4 female mice) (previously shown in Fig. 2b); (0.203 ± 0.188) (*P = 0.0394). f, Schematic of experimental design to determine sufficiency of caloric restriction for effects on epigenetic aging. g, Tb over a 12-week experiment of mice pair-fed with TLS mice while housed at thermoneutrality (CR 32 °C, n = 8, 4 female mice, 4 male mice) plotted in purple. CR 32 °C mice were injected with pAAV-hSyn-mCherry and received CNO. Tb of No Stim 32 °C mice (orange) and TLS mice (blue) shown for reference (as previously shown in d). Lines and shading as in d. h, Quantification of normalized blood DNAmAge of CR 32 °C mice. Data plotted as box plots (25th to 75th percentiles) with whiskers from minimum to maximum with line at median. Normalization performed as in e (T0 = 0 ± 0.069, No Stim 22 °C = 1 ± 0.057). CR 32 °C mice had similar blood epigenetic age to No Stim 22 °C mice (NS, P = 0.9990) and No Stim 32 °C mice (NS, P = 0.7893) and significantly higher epigenetic age than TLS mice (***P = 0.0004) (shown for reference, as previously shown in Fig. 2b). i, Schematic of experimental design to determine the necessity of decreased Tb for effects on epigenetic aging. j, Tb over 12 week experiment of mice pair-fed with TLS mice and undergoing avMLPA stimulation housed at 32 °C (Stim + CR 32 °C, n = 8, 4 female mice, 4 male mice) plotted in green. Tb of No Stim 32 °C mice (orange) and TLS mice (blue) shown for reference (as shown in d). Lines and shading as in h. k, Quantification of normalized blood DNAmAge of Stim + CR 32 °C mice. Data plotted as box plots (25th to 75th percentiles) with whiskers from minimum to maximum with line at median. Normalization performed as in e. Stim + CR 32 °C mice (0.798 ± 0.058) had similar blood DNAmAge to No Stim 32 °C mice (NS, P > 0.9999) and No Stim 22 °C mice (NS, P = 0.6854). Stim + CR 32 °C mice had significantly higher blood epigenetic age than TLS mice (*P = 0.0108) (shown for reference, as previously shown in Fig. 2b). l, ∆Tb of individual control and TLS mice while on CNO over 9 months (mice previously shown in Fig. 3a). m, Correlation between the average ∆Tb and the rate of blood DNAmAging in individual Con 22 °C (gray) and TLS (blue) mice over 9 months (r2 = 0.5650, ****P < 0.0001, F = 50.65, DFn, DFd = 1,39); line represents simple linear regression; shading denotes 95% CI. n, Correlation between the average ∆Tb and the rate of blood DNAmAging in TLS mice over 9 months (r2 = 0.2567, *P = 0.0269, F = 5.871, DFn, DFd = 1, 17). Data shown as in m. Source data
Extended Data Fig. 1
Extended Data Fig. 1. Metabolic characterization of natural fasting-induced daily torpor bouts.
a-c, Tb, VO2, RQ, and activity as measured by the Prometheon Metabolic System in 3 representative individual mice over a 24-hour fasting interval (food was removed at time 0). 6/8 mice underwent natural fasting-induced daily torpor bouts during the fasting interval as defined by Tb < 35°C and lack of arousal (threshold Tb for torpor entry marked by dotted grey line on Tb graph). Source data
Extended Data Fig. 2
Extended Data Fig. 2. The thermoregulatory system during TLS.
a, Schematic of the thermoregulatory model. b, Minimum Tb and VO2 across ambient temperatures (8, 16, 24°C) at baseline (grey) and during TLS (blue) (n = 11). c, The relationship between VO2 and Tb - Ta. The slope of the curve denotes the median value of G, the heat conductance, at baseline (grey) (0.233 mL g−1 h−1 °C−1) and during TLS (blue) (0.172 mL g−1 h−1 °C−1), thin lines denote the 89% highest posterior density interval (HPDI) of G at baseline [0.210, 0.236] mL g−1 h−1 °C−1 and during TLS [0.159, 0.184] mL g−1 h−1 °C−1, and dots represent data d, Relationship between Tb and VO2 across varying Ta. The negative slope denotes the median value of H at baseline (grey) (1.555 g−1 h−1°C−1) and during TLS (blue) (0.780 g−1 h−1°C−1). The X-intercept, where VO2 = 0, represents the median theoretical set point temperature (Tset) at baseline (38.414°C) and during TLS (29.13°C), thin lines represent the 89% HPDI of both H [1.00, 2.46] g−1 h−1°C−1 at baseline and [0.52, 1.31] g−1 h−1°C−1 during TLS and Tset [37.323, 40.0]°C at baseline and 29.13 [28.02, 30.36]°C during TLS, dots represent data. e, Distribution of estimated Tset and H both at baseline (grey) and during TLS (blue). Source data
Extended Data Fig. 3
Extended Data Fig. 3. Additional epigenetic and transcriptomic clock analyses.
a, DNAmAge across tissues as calculated using the Universal2 Epigenetic Clock. Data reported as mean ± SEM. Significance determined by one-way ANOVA adjusted for multiple comparisons by Tukey’s HSD. In the blood, TLS mice (6.01 ± 0.33) had significantly lower DNAmAge than control mice (n = 8) (7.34 ± 0.18) (**P = 0.0015). In the liver, kidney, and cortex, TLS mice (liver = 7.76 ± 0.39, kidney = 10.25 ± 0.56, cortex = 11.92 ± 0.51) had comparable DNAmAge to control mice (liver = 8.08 ± 0.23, kidney = 10.40 ± 0.39, cortex = 12.54 ± 0.38) (liver = ns, P = 0.7240, kidney = ns, P = 0.9705, cortex = ns, P = 0.5352). b, DNAmAge across tissues as calculated using the Universal3 Epigenetic Clock. Data reported as mean ± SEM. Significance determined by one-way ANOVA adjusted for multiple comparisons by Tukey’s HSD. In the blood, TLS mice (5.22 ± 0.34) had significantly lower DNAmAge than control mice (7.21 ± 0.27) (*** P = 0.0008). In the liver, kidney, and cortex, TLS mice (liver = 6.08 ± 0.45, kidney = 9.71 ± 0.51, cortex = 11.50 ± 0.41) had equivalent DNAmAge to control mice (liver = 6.28 ± 0.29, kidney = 10.31 ± 0.39, cortex = 12.41 ± 0.22) (liver = ns, P = 0.7240, kidney = ns, P = 0.6152, cortex = ns, P = 0.2434). c, DNAmAge across tissues as calculated using the PanTissue Epigenetic Clock. Data reported as mean ± SEM. Significance determined by one-way ANOVA adjusted for multiple comparisons by Tukey’s HSD. In the blood, TLS mice (3.5 ± 0.37) had significantly lower DNAmAge than control mice (4.80 ± 0.26) (**P = 0.0099). In the liver, kidney, and cortex, TLS mice (liver = 5.478 ± 0.18, kidney = 5.40 ± 0.45, cortex = 4.98 ± 0.12) had equivalent DNAmAge to control mice (liver = 6.13 ± 0.32, kidney = 5.27 ± 0.30, cortex = 5.72 ± 0.44) (liver = ns, P = 0.1484, kidney = ns, P = 0.959, cortex = ns, P = 0.1997). d, Tissue-specific epigenetic clock analyses across tissues and sexes. All data plotted as box plots indicating median, upper and lower quartiles, and whiskers extending to min and max values. Data reported as mean. Significance determined by one-way ANOVA adjusted for multiple comparisons by Tukey’s HSD. In the liver, there were significant differences between T0 and control mice in both males (T0 M = 4.244, M Control = 6.666, ****P < 0.001) and females (T0 F = 4.143, Control F = 6.788, ****P < 0.001). There were significant differences between T0 and TLS mice in both males (T0 M = 4.224, TLS M = 6.169, ****P < 0.001) and females (T0 F = 4.143, TLS F = 6.283, ****P < 0.001). There were no significant differences between Control and TLS mice in both males (Control M = 6.666, TLS M = 6.169, ns, P = 0.549) and females (Control F = 6.788, TLS F = 6.283, ns, P = 0.531). Across sexes, there were no significant difference between T0 M and T0 F (ns, P = 0.9990), between Control M and Control F (ns, P = 0.9981), or between TLS M and TLS F (ns, P = 0.9986). In the cortex, we found no significant differences between any groups, suggesting the cortex tissue-specific clock lacked the necessary resolution. In the kidney, we found significant differences between T0 F (3.783) and Control F (7.438) (*P = 0.010); however, we did not find significance between T0 M (3.518) and Control M (6.444) (ns, P = 0.0519). We found a significant difference between T0 M and TLS M (6.482) (*P = 0.0478), however we found no significant difference between T0 F and TLS F (5.575) (ns, P = 0.4139). We found no significant differences between control females and TLS females (ns, P = 0.3737) or between control males and TLS males (ns, P > 0.9999). Across sexes, there were no significant difference between T0 M and T0 F (ns, P = 0.9997), between Control M and Control F (ns, P = 0.8855), or between TLS M and TLS F (ns, P = 0.9187). In the cortex there were no significant differences between T0 and control mice in both males (T0 M = 5.129, M Control = 7.475, ns, P = 0.3653) and females (T0 F = 5.713, Control F = 7.690, ns, P = 0.5434). There were no significant differences between T0 and TLS mice in both males (TLS M = 7.813, ns, P = 0.2365) and females (TLS F = 8.490, ns, P = 0.2075). There were no significant differences between Control and TLS mice in both males (ns, P = 0.3653) and females (ns, P = 0.9806). Across sexes, there were no significant difference between T0 M and T0 F (ns, P = 0.9953), between Control M and Control F (ns, P > 0.9999), or between TLS M and TLS F (ns, P = 0.9907). e, Transcriptomic clock analysis across tissues. Data reported as mean. Significance determined by one-way ANOVA adjusted for multiple comparisons by Tukey’s HSD. In the liver, there were significant differences between T0 and control mice in females (F) and males (M) (F T0 = 0.52, F control = 5.29, ***P = 0.0003; M T0 = -0.24, M control = 2.835, *P = 0.022). There were significant differences between control and TLS mice in females (F control =5.29, F TLS = 2.46, *P = 0.039), but not males (M control =2.835, M TLS = 4.15, ns, P = 0.649). We found a significant difference between M T0 (-0.2357) and M TLS (4.147), ***P = 0.0009); however, this comparison was not significant in female mice (F T0 = 0.5166, F TLS = 2.463, ns, P = 0.254). Across sexes there were no significant differences between male and female T0 (ns, P = 0.9467), control (ns, P = 0.090), or TLS mice (ns, P = 0.396). In the cortex there were significant differences between T0 and control mice in females (F T0 = -0.60, F control = 4.44, ***P = 0.0002) but not in males (M T0 = 0.43, M control = 3.12, ns, P = 0.1473). We found no significant differences between control and TLS mice in females (F control = 4.44, F TLS = 7.17, ns, P = 0.1376), or in males (M control = 3.12, M TLS = 5.45, ns, P = 0.3055). We found significant differences between T0 and TLS mice in both males (***P = 0.0007) and females (****P < 0.0001). Across sexes, there were no significant differences between male and female T0 (ns, P = 0.9942), control (ns, P = 0.9476), and TLS mice (ns, P = 0.7365). In the kidney, there were significant differences between T0 and control mice in both females (F T0 = 0.05, F control = 5.37, **P = 0.0027) and males (M T0 = 0.01, M control = 4.33, *P = 0.0166). There were no significant differences between control and TLS mice in females or males (F control = 5.37, F TLS = 4.11, ns, P = 0.8792; M control = 4.33, M TLS = 3.76, ns, P = 0.9960). We found significant differences between T0 and TLS mice in both males (*P = 0.045) and females (*P = 0.0269). Across sexes there were no significant differences between male and female T0 (ns, P > 0.9999), control (ns, P = 0.9426), and TLS mice (ns, P = 0.9996). In the WAT, there were significant differences between T0 and control mice in both females and males (F T0 = 0.17, F control = 7.05, ****P < 0.0001) (M T0 = 0.22, M control = 4.00, **P = 0.0025). There were significant differences between control and TLS mice in females (F control = 7.05, F TLS = 4.42, *P = 0.0153), but not in males (M control = 4.00, M TLS = 4.06, ns, P > 0.9999). There were significant differences between T0 and TLS mice in both males (**P = 0.0022) and females (***P = 0.0002). Across sexes we found significant differences between F control and M control (**P = 0.009). We found no significant differences between male and female T0 (ns, P > 0.9999) and TLS mice (ns, P = 0.9959). All data plotted as box plots indicating median, upper and lower quartiles, and whiskers extending to min and max values. Significance determined by one-way ANOVA adjusted for multiple comparisons by Tukey’s HSD. Source data
Extended Data Fig. 4
Extended Data Fig. 4. Sustained effects of TLS on epigenetic age.
a, DNAmAge blood of control (mice stereotactically injected in the avMLPA with AAV-hSyn-hM3D(Gq)-mCherry and administered drinking water without CNO) and TLS mice over the course of the experiment. Blue shading denotes CNO treatment. Data plotted as box plots (25th to 75th percentile) with whiskers from min-to-max with line at median. A standard curve (DF = 54, R2 = 0.934) was interpolated across all timepoints in control mice to assess the measurements taken after 3 months of water. At 16 months of chronological age, the standard curve approximates that the blood DNAmAge of control mice would be 13.37 with 95% CI ±0.494. This value is higher than the observed value of 10.96 ± 0.305 (n = 7). Thus, while 3 months post CNO cessation there is a smaller difference in epigenetic age between TLS and control mice, there is no evidence for an immediate acceleration of aging in TLS mice (n = 6) after cessation of CNO, rather this effect appears to reflect a possibly inaccurate measurement taken from control mice at 3 months post CNO cessation. b, Examining blood DNAmAge from 9 months after cessation of TLS indicates that while TLS mice (n = 8) still had an average blood DNAmAge (18.1± 1.19) ~ 1.5 months younger than control mice (n = 8) (19.87± 0.72) this difference did not reach significance as determined by unpaired two-tailed T-test (ns, P = 0.297). Data plotted as box plots (25th to 75th percentile) with whiskers from min-to-max with line at median. Source data
Extended Data Fig. 5
Extended Data Fig. 5. Clinical Frailty Index measurements.
a, Schematic of TLS treatment and clinical FI assessment b, Frailty scores across the remaining 23 individual frailty index measurements of TLS and control mice (mice stereotactically injected in the avMLPA with AAV-hSyn-hM3D(Gq)-mCherry and administered drinking water without CNO) after 9 months of TLS. TLS mice (n = 7) (0.07± 0.0) scored significantly lower than control mice (n = 9) (0.67 ± 0.0) on measurement of alopecia as determined by unpaired two-sided T-test (*P = 0.01). Data reported as mean ± SEM. Source data
Extended Data Fig. 6
Extended Data Fig. 6. Bodyweight and ∆Tb (°C) Analysis.
a, Longitudinal measurements of bodyweight over 9 months. Control mice (mice stereotactically injected in the avMLPA with AAV-hSyn-hM3D(Gq)-mCherry and administered drinking water without CNO, grey) and TLS mice (blue) had similar bodyweights over the course of the experiment (TLS n = 8, Con n = 11). Using simple linear regression, we found that there was no significant difference in normalized bodyweight between TLS and control groups over the course of the longest study we performed (ns, F = 0.0467, DFn = 1, Dfd = 376, P = 0.8290). Data plotted as box plots (25th to 75th percentile) with whiskers from min-to-max with line at median. b, Average weight (g) plotted against the normalized epigenetic aging rate of individual TLS mice over the course of 9 months. We found no significant correlation between bodyweight and the rate of epigenetic aging as determined by Pearson correlation two-tailed test (R2 = 0.08914, ns, P = 0.1385). c-e, To test whether average bodyweight correlates with decrease in core body temperature, we stratified the data into 3-month segments (also corresponding to when we measured epigenetic age) to avoid the confounding factor of age. We found no significant correlation between absolute bodyweight and drop in core body temperature in TLS mice across any time points using Pearson two-tailed correlation tests (c, R2 = 0.2243, ns, P = 0.1412, d, R2 = 0.2895, ns, P = 0.1351, e, R2 = 0.04548, ns, P = 0.6121). Source data
Extended Data Fig. 7
Extended Data Fig. 7. Food intake and Tb in TLS, Con 22°C, Con 32°C, Stim 32°C, CR 32°C, and Stim + CR 32°C mice.
a, Average Tb of individual mice across all groups over 3 months. Significance determined by one-way ANOVA adjusted for multiple comparisons by Tukey’s HSD Data reported as mean. TLS mice had significantly lower average Tb (32.6) than Con 32°C mice (36.28) (****P < 0.0001), Stim + CR 32°C mice (35.33) (***P = 0.0005), CR 32°C mice (36.04) (****P < 0.0001), Stim 32°C mice (35.83) (****P < 0.0001), Con 22°C mice (35.58) (***P = 0.0001). There were no significant differences between Con 32°C and Stim + CR 32°C mice (ns, P = 0.5964), between Con 32°C mice and CR 32°C mice (ns, P = 0.9983), between Con 32°C and Stim 32°C mice (ns, P = 0.9737), between Con 32°C and Con 22°C mice (ns, P = 0.8410), between Stim + CR 32°C and CR 32°C mice (ns, P = 0.8357), between Stim + CR 32°C and Stim 32°C mice (ns, P = 0.9654), between Stim + CR 32°C and Con 22°C mice (ns, P = 0.9981), between CR 32°C and Stim 32°C mice (ns, P = 0.9992), between CR 32°C and Con 22°C mice (ns, P = 0.9707), and between Stim 32°C and Con 22°C mice (ns, P = 0.9987). b, Food intake across all groups for the duration of the experiment while on CNO. Data reported as mean ± SEM. Significance determined by one-way ANOVA adjusted for multiple comparisons by Tukey’s HSD. TLS mice (1.17±0.10 g) had significantly lower food intake than Con 22°C mice (3.67± 0.18 g) (****, P < 0.0001), Con 32°C mice (3.25±0.22 g) (****P < 0.0001), and Stim 32°C mice (2.30± 0.12 g) (***, P = 0.0003). Importantly, TLS mice had similar food intake to CR 32°C mice (0.95± 0.0) (ns, P = 0.8868) and Stim + CR 32°C mice (0.88± 0.02) (ns, P = 0.7270). Stim + CR 32°C mice ate equivalent amounts as CR 32°C mice (ns, P = 0.9945), and both groups ate significantly less than Con 22°C mice (Stim + CR 32°C vs. Con 22°C mice, ****P > 0.0001; CR 32°C vs. Con 22°C mice, ****P < 0.0001), Con 32°C mice (Stim + CR 32°C vs. Con 32°C mice, ****P > 0.0001; CR 32°C vs. Con 32°C mice, ****P < 0.0001) and Stim 32°C mice (Stim + CR 32°C vs. Stim 32°C mice, ****P > 0.0001; CR 32°C vs. Stim 32°C mice, ****P < 0.0001). Con 32°C mice ate equivalent amounts as Con 22°C mice (ns, P = 0.3588). Stim 32°C mice ate significantly less than Con 32°C mice (**P = 0.0062) and Con 22°C mice (****P < 0.0001). c, Aggregate plot of Tb over 12 week experiment displayed over a 1 week interval of control (grey) and TLS (blue) mice. Data plotted as mean ± s.d. d, Food intake of TLS mice and Control mice while on and off CNO over duration of the experiment. e, Aggregate plot of Tb over 12 week experiment displayed over a 1 week interval of Con 32°C and Stim 32°C mice. TLS mice shown in blue for reference. Data plotted as mean ± SD. f, Food-intake of Con 32°C and Stim 32°C mice while on and off CNO. g-h, Characterization of CR 32°C mice, data shown as in e-f. i-j, Characterization of Stim + CR 32°C mice, data shown as in e-f. Source data
Extended Data Fig. 8
Extended Data Fig. 8. Analysis of potential sex-differences across experiments.
a, Violin plot showing the distribution of ∆Tb [°C] while on CNO over the course of the longitudinal experiment in male and female TLS mice (Fig. 3). There was no significant difference (ns, P = 0.2691) between males (-5.115) and females (-5.559) as determined by two-sided unpaired T-test (t = 1.131, df = 24). b-d, To test for sex-differences in TLS, we compared rates of epigenetic aging using simple linear regression between (b) female TLS mice and female control mice (c) between male TLS mice and control mice, and (d) between male and female TLS mice. Data plotted as box plots (25th to 75th percentile) with whiskers from min-to-max with line at median. In (b) we found that female TLS mice (r2 = 0.91, slope = 0.5352 ±0.037) age significantly slower than female control mice (r2 = 0.96, slope = 0.8404 ±0.038) (F = 32.72, DFn = 1, DFd = 43, **** P < 0.0001). Slope reported as mean ± standard error. In (c) we found that male TLS mice (r2 = 0.94, slope = 0.60±0.045) age significantly slower than male control mice (r2 = 0.96, slope = 0.97 ± 0.05) (F = 28.7, DFn = 1, DFd = 26, ****P < 0.0001). Slope reported as mean ± standard error. In (d) we found that there is no significant difference between the aging rates of female (r2 = 0.91, slope = 0.5352 ±0.037) and male TLS mice (r2 = 0.94, slope = 0.60±0.045) (F = 1.141, DFn = 1, DFd = 32, ns, P = 0.293). In (e-h) we compared the epigenetic age of male and female TLS and control mice at every timepoint using one-way ANOVA with multiple comparisons. Data plotted as box plots (25th to 75th percentile) with whiskers from min-to-max with line at median. In (e) we found that there were no significant differences between groups at T0 (ns, P = 0.2467). In (f) we found that there were significant differences between control females (0.438) and TLS females (0.357) (*P = 0.011), and between control males (0.458) and TLS males (0.362) (**P = 0.009). There was no significant difference between control females and control males (ns, P = 0.831), or between TLS females and TLS males (ns, P = 0.998). In (g) we found that there were significant differences between control females (0.657) and TLS females (0.465) (****P < 0.0001) and between control males (0.644) and TLS males (0.485) (** P = 0.0018). We found no significant differences between control females and control males (ns, P = 0.971), or between TLS females and TLS males (ns, P = 0.93). In (h) we found that there were significant differences between control females (0.869) and TLS females (0.639) (**P = 0.002) and between control males (1.024) and TLS males (0.706) (**P = 0.007). We found no significant differences between control females and control males (ns, P = 0.112), or between TLS females and TLS males (ns, P = 0.719). i, Violin plot showing the distribution ∆Tb [°C] while on CNO over the course of a 3-month experiment in male and female TLS mice (Figs. 2, 4). There was no significant difference (ns, P = 0.31) between males (-5.223) and females (-5.496) as determined by unpaired T-test (t = 1.039, df = 22). To test whether either sex responded differently to clamping the temperature or to caloric restriction, we compared male and female groups within each experiment using one-way ANOVA corrected for multiple comparisons with Tukey’s HSD in (j-k). In (j), we found that there were no significant differences between T0 females (0.377) and males (0.400) (ns, P = 0.9998), between No Stim 22°C (0.478) females and males (0.527) (ns, P = 0.9322), between TLS males (0.374) and females (0.4525) (ns, P = 0.4795), between No Stim 32°C females (0.47) and males (0.476) (ns, P > 0.9999), and between Stim 32°C females (0.5008) and males (0.507) (ns, P > 0.999). In (k) we found that there were no significant differences between T0 females (0.316) and T0 males (0.316) (ns, P > 0.999), between No Stim 22°C females (0.484) and males (0.496) (ns, P = 0.9998), between CR 32°C females (0.462) and males (0.448) (ns, P > 0.9999), and between Stim+CR 32°C females (0.4755) and males (0.4861) (ns, P = 0.9995).
Extended Data Fig. 9
Extended Data Fig. 9. Differential methylation analysis.
a-e, Volcano plots of differentially methylated regions across all groups as compared to Control 22°C mice. Differential methylation analysis was performed using the SeSAMe pipeline, which identified 183,635 genomic regions with correlated CpGs from 326,723 probes. Dashed lines represent significance thresholds as determined by DMR function, which models DNA methylation levels using mixed linear models, treating conditions as covariates, with the following thresholds (adjusted P-value < 10−3 and |∆Beta | > 0.05). Importantly, only mice that underwent TLS had a meaningful number of differentially methylated regions as compared to Control 22°C mice after 3 months of treatment, suggesting temperature-dependent epigenetic remodeling. a, Control 32°C, no significantly differentially methylated regions b, Stim 32°C, 1 hypermethylated region (highlighted in pink). c, CR 32°C, no differentially methylated regions d, Stim+CR 32°C, had no differentially methylated regions e, TLS, 701 significantly hypermethylated regions highlighted in light blue, 5,332 significantly hypomethylated regions highlighted in dark blue. f, Manhattan plot showing the 286,212 probes that mapped to the mouse genome using the SeSAME pipeline to visualize the genomic locations of differentially methylated probes between TLS and Control 22°C mice. Lower dashed line represents the significance threshold (raw P-value < 10−5). Probes that were significantly hypermethylated in TLS mice as compared to controls are highlighted in light blue; significantly hypomethylated probes are highlighted in dark blue. g, Top 10 enriched gene hits in TLS mice as compared to Control 22°C mice after 3 months of treatment identified via Genomic Regions Enrichment of Annotations Tool (GREAT) analysis from all differentially methylated regions. h, Top 10 enriched biological processes in TLS mice as compared to Control 22°C mice after 3 months of treatment identified via GREAT analysis. Only biological processes with more than 10 foreground gene hits were included. i-j, Volcano plots of differentially methylated regions in TLS mice as compared to control mice after 6 (i) and 9 (j) months of TLS. Differential methylation analysis was performed using the SeSAMe pipeline, which identified 183,635 correlated genomic segments. Dashed lines represent significance thresholds (adjusted P-value < 10−3 and |∆Beta | > 0.05). Significantly hypermethylated regions are highlighted in light blue; significantly hypomethylated regions are highlighted in dark blue. i, After 6 months of TLS, there were 567 significantly differentially hypermethylated regions and 10,614 significantly differentially hypomethylated regions. j, After 9 months of TLS, there were 517 significantly differentially hypermethylated regions and 871 significantly differentially hypomethylated regions. k, Top 10 enriched biological processes after 9 months of TLS identified via GREAT analysis. Only biological processes with more than 10 foreground gene hits were included. l, Shared significantly enriched biological processes after 3 and 9 months of TLS identified using GREAT analysis. Biological processes were limited to those with an FDR < 0.05 and more than 5 foreground gene hits.

Update of

Similar articles

Cited by

  • The cold truth: torpor as a confound in studies of caloric restriction.
    Wheatley WSR, Marshall CJ, Taddei L, Hitrec T, Pickering AE, Ambler MT. Wheatley WSR, et al. J Comp Physiol B. 2025 Jun;195(3):263-276. doi: 10.1007/s00360-025-01616-1. Epub 2025 Jun 9. J Comp Physiol B. 2025. PMID: 40488879 Free PMC article. Review.
  • How extreme lethargy can promote healthy ageing.
    [No authors listed] [No authors listed] Nature. 2025 Mar;639(8055):549. doi: 10.1038/d41586-025-00707-x. Nature. 2025. PMID: 40087390 No abstract available.
  • N-acetylcarnosine attenuates age-associated declines in multi-organ systems to improve survival.
    Miranda ER, Shahtout JL, Watanabe S, Spaas J, Milam NY, Neiswanger G, Werbner B, Stuart D, Mookherjee S, Wilson J, Judge M, Goh IY, Slater T, Gallop MR, Hu G, Karasawa T, Landers JK, Rainbow B, O'Connor KT, Black NJ, Lan H, Nikolova LS, Li Y, Davey CF, Cox JE, Boudina S, Karner CM, Harasymowicz NS, Ramkumar N, Symons JD, Chaix A, Long JZ, Drummond MJ, Funai K. Miranda ER, et al. bioRxiv [Preprint]. 2025 Aug 25:2025.08.19.671148. doi: 10.1101/2025.08.19.671148. bioRxiv. 2025. PMID: 40909683 Free PMC article. Preprint.

References

    1. Wilkinson, G. S. & Adams, D. M. Recurrent evolution of extreme longevity in bats. Biol. Lett.15, 20180860 (2019). - PMC - PubMed
    1. Tan, C. L. & Knight, Z. A. Regulation of body temperature by the nervous system. Neuron98, 31–48 (2018). - PMC - PubMed
    1. Morrison, S. F. & Nakamura, K. Central mechanisms for thermoregulation. Annu. Rev. Physiol.81, 285–308 (2019). - PubMed
    1. Boulant, J. A. & Hardy, J. D. The effect of spinal and skin temperatures on the firing rate and thermosensitivity of preoptic neurones. J. Physiol.240, 639–660 (1974). - PMC - PubMed
    1. Tan, C. L. et al. Warm-sensitive neurons that control body temperature. Cell167, 47–59.e15 (2016). - PMC - PubMed

LinkOut - more resources