. 2025 Mar 7;8(1):385.
doi: 10.1038/s42003-025-07843-0.

STAT1 mediates the pro-inflammatory role of GBP5 in colitis

Affiliations

STAT1 mediates the pro-inflammatory role of GBP5 in colitis

Yichen Li et al. Commun Biol. .

Abstract

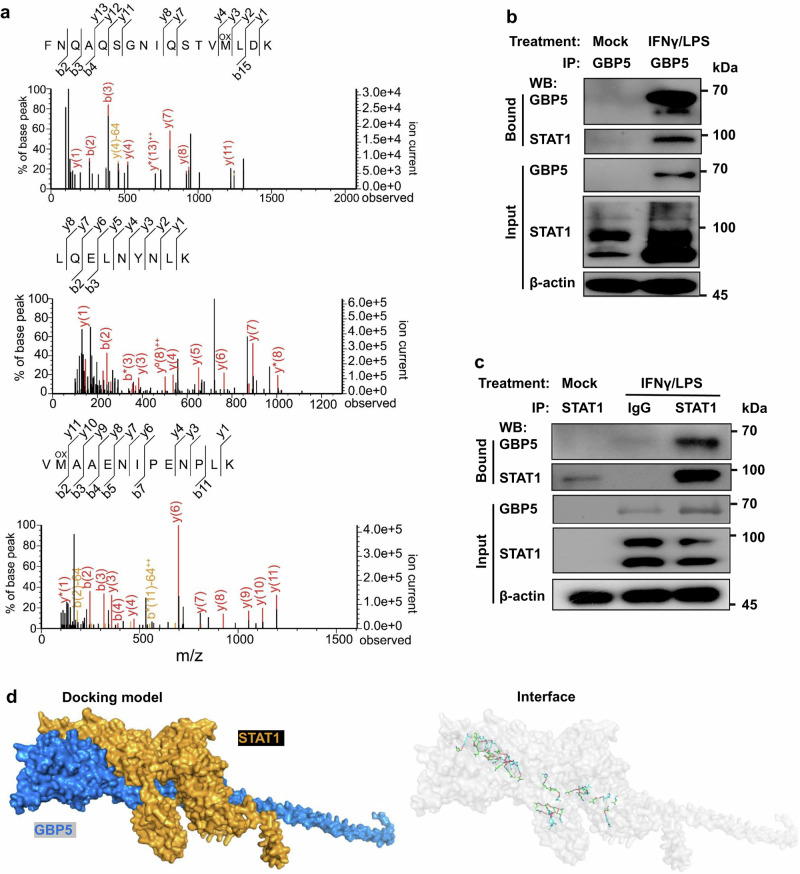
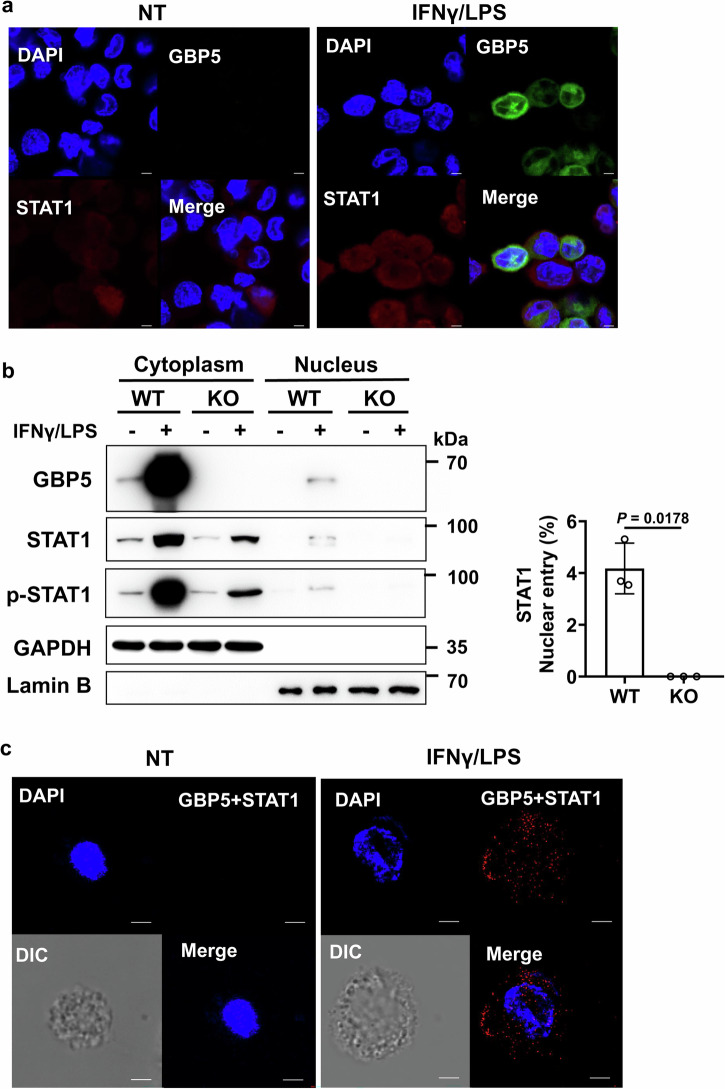
Previous studies establish guanylate binding protein 5 (GBP5) as a driver in the development of inflammatory bowel diseases (IBDs). Here, we aim to elucidate the mechanism underlying the pro-inflammatory role of GBP5. We observe that loss of Gbp5 causes reduced colonic inflammation and decreased numbers of innate lymphoid cells (ILCs) in colitis mice. The transcriptional alterations observed in GBP5-deficient THP-1 cells mirrored those triggered by STAT1 activation, leading to the findings that GBP5 is essential for the stimulated expression of STAT1 and its downstream effectors, including cytokines that drive the expansion of ILCs. Remarkably, over-expression of STAT1 reverses the reduced cytokine expression caused by GBP5 deficiency. While GBP5 does not directly drive gene transcription, it binds with STAT1 and facilitates its nuclear translocation, thereby enhancing the expression of STAT1 itself and its downstream effectors. Overall, GBP5 plays a pro-inflammatory role in IBD by enhancing the activity and expression of STAT1.


Conflict of interest statement

Competing interests: The authors declare no competing interests.

Figures

Fig. 1
Fig. 1. Gbp5 deletion attenuates DSS-induced colitis.
a Genotyping of the founder mice by PCR. −/−, both copies of the Gbp5 locus deleted; +/−, one copy of the Gbp5 locus deleted; and +/+, wildtype (WT). b, c Body weight and Disease Activity Index (DAI) scores of WT and Gbp5-/- mice, treated with 3% DSS for 7 days or not treated (NT). d, e Colon length and representative hematoxylin and eosin (H&E) stained images of colon cross-sections from WT and Gbp5-/- mice, untreated or treated with DSS. n = 5 biologically independent animals for each group. Scale bars: 100 μm (10X, left panels); and 20 μm (80X, right panels). Data are mean ± SEM. NS, not significant, Mann-Whitney U test. DSS, dextran sulfate sodium.
Fig. 2
Fig. 2. Gbp5 is required for expansion of innate lymphoid cells (ILCs) in DSS-induced colitis.
a Counts of ILC1s, ILC2s and ILC3s in the colon of DSS-treated mice and control mice. Values are based on the total numbers of ILCs and the percent representations of each ILC. b Flow cytometry analysis of ILC1s (NKp46+RORγt-), ILC2s (KLRG1+RORγt-) and ILC3s (RORγt+) in the colons of DSS-treated mice and control mice. CD45+Lin- lymphocytes were gated out for analysis of ILCs. (Lin = CD3ε, CD45R/B220). Numbers denote percentage of cells inside the gate. c The expression levels of driver cytokines for ILCs and ILC markers in the colons of WT and Gbp5-/- mice on day 7 of DSS treatment, according to qRT-PCR analyses, normalized to that of ACTB. n = 3 biologically independent samples for each group. Data are mean ± SEM, Mann-Whitney U test.
Fig. 3
Fig. 3. The effect of GBP5 knockout on the global mRNA expression mirrors that of STAT1 activation in THP-1 cells.
a Plots are the mRNA expression data of STAT1 and STAT1 target genes from RNA sequencing-based transcriptome analysis. Wildtype and GBP5-/- THP-1 cells were treated with IFNγ (25 ng/ml) plus LPS (500 ng/ml) or mock-treated for 16 h. The list of the STAT1 target genes was from TRRUST version 2, with a few others (CCND1, MYC, and CDC25A) added according to the literature. Genes known to be stimulated and repressed by STAT1 are indicated by red and green, respectively. n = 3 biologically independent samples for each group. b Gene set enrichment analysis (GSEA) of the entire transcriptome data of GBP5-/- cells compared to wild-type THP-1 cells. The upper panel is the enrichment score curve for JAK-STAT signaling pathway, showing the decreased expression level of relevant genes in Gbp5 deficient cells. The middle panel shows the distribution of the genes related to JAK-STAT signaling pathway. The genes were ranked according to their differential expression between wild-type and GBP5-/- cells. The lower panel is a graphical representation of the correlations between gene expression levels and the genotypes: WT or GBP5-/-. NES, normalized enrichment scores; FDR, false discovery rate.
Fig. 4
Fig. 4. GBP5 is required for the stimulated expression of STAT1.
a Expression of GBP5 and STAT1 in the wildtype and GBP5-/- (three different clones A1, B1, and B2) THP-1 cells. THP-1 cells were treated with IFNγ (25 ng/ml), or IFNγ (25 ng/ml) plus LPS (500 ng/ml), or mock treated for 16 h. Cells were then harvested for Western blot analyses with anti-GBP5, anti-STAT1, and anti-β-actin antibodies, respectively. b Expression of GBP5 and STAT1 after siRNA knockdown of GBP5 in Jurkat cells. Jurkat cells were treated with GBP5 siRNA or control RNA for 48 h and subsequently stimulated with IFNγ/LPS for an additional 16 h. Cells were then harvested and subjected to Western blot analyses with anti-GBP5, anti-STAT1, and anti-GAPDH antibodies, respectively. c GBP5-/- THP-1 cells were transfected with either control (CTRL), GBP5 or STAT1 plasmid for 48 h, followed by treatment with IFNγ/LPS for 16 h. The cells were then harvested and subjected to RT-qPCR analysis. n = 3 biologically independent samples for each group. Data are mean ± SEM, Student t-test. d GBP5-/- THP-1 cells were transfected with either control (CTRL) or GBP5 plasmid for 48 h, followed by treatment with IFNγ/LPS for 16 h. Cells were then harvested and analyzed by Western blot with anti-Flag, anti-GBP5, anti-STAT1, anti-p-STAT1 (S727), and anti-β-actin antibodies, respectively. e Persistent expression of GBP5 despite the diminished expression of STAT1. THP-1 cells were treated with fludarabine (10 ng/ml) or mock-treated for 4 h, followed by IFNγ stimulation for 16 h. Cells were then harvested and analyzed by Western blot with anti-STAT1, anti-GBP5, and anti-β-actin antibodies, respectively. f UCSC genome browser tracks showing ChIP-seq of GBP5 (with or without IFNγ/LPS stimulation) and STAT1 (with or without IFNγ/LPS stimulation) bound promoter region of selected STAT1 effector genes in THP-1 cells.
Fig. 5
Fig. 5. Identification of STAT1 as a GBP5 binding protein.
a Identification of STAT1 in the bound fraction of anti-GBP5 immunoprecipitation by liquid chromatograph followed by tandem mass spectrometry (LC-MS/MS). Wildtype THP-1 cells were treated with IFNγ/LPS or mock treated for 16 h. Cell lysates were immunoprecipitated with anti-GBP5. The bound fraction of the IFNγ/LPS treated sample was in-gel digested before LC-MS/MS analysis of the peptides. The collision-induced dissociation spectra of three STAT1 peptides are shown. b Western blot analyses of the total lysates (input) and bound fractions from immunoprecipitation with anti-GBP5. Lysates were prepared from wild-type THP-1 cells treated with IFNγ/LPS or mock-treated for 16 h. Blots were probed for GBP5, STAT1, and β-actin as indicated. c Western blot analyses of the total lysates (input) and bound fractions from immunoprecipitation with anti-STAT1, or IgG (control). Lysates were prepared from wild-type THP-1 cells treated with IFNγ/LPS or mock-treated for 16 h. Blots were probed for GBP5, STAT1, and β-actin as indicated. d Dock simulation for GBP5 and STAT1 interaction. The left panel represents the surface diagram of the docking model, where blue and yellow indicate GBP5 and STAT1, respectively. The right panel displays the interface of the docking model, highlighting the amino acid residues involved in the interaction.
Fig. 6
Fig. 6. Binding of GBP5 to STAT1 promotes the nuclear translocation of STAT1.
a Immunofluorescence staining of THP-1 cells untreated or treated with IFNγ/LPS using antibodies against GBP5 and STAT1. Scale bar: 5 μm. b Subcellular fractionation analysis of GBP5 and STAT1. WT and GBP5-/- THP-1 cells were untreated or treated with IFNγ/LPS for 16 h, harvested to prepare nuclear and cytoplasmic fractions, and analyzed by Western blot with antibodies against GBP5, STAT1, and p-STAT1 (S727). GAPDH and Lamin B were used as internal references. The bar plot on the right was the quantification of three independent experiments. n = 3 biologically independent experiments for each group. Data are mean ± SEM, paired student t-test. c GBP5-STAT1 proximity ligation assay with THP-1 cells untreated or treated with IFNγ/LPS. Each red spot represents an interaction. Scale bar: 2 μm. Nuclei were stained with DAPI (blue).

References

    1. Adiliaghdam, F. et al. Human enteric viruses autonomously shape inflammatory bowel disease phenotype through divergent innate immunomodulation. Sci. Immunol.7, eabn6660 (2022). - PMC - PubMed
    1. Yang, W. et al. Intrinsic STING Switches off Pathogenetic Programs of Th1 Cells to Inhibit Colitis. Cell. Mol. Gastroenterol. Hepatol.15, 1161–1179 (2023). - PMC - PubMed
    1. Gao, S. et al. IBD Subtype-Regulators IFNG and GBP5 Identified by Causal Inference Drive More Intense Innate Immunity and Inflammatory Responses in CD Than Those in UC. Front. Pharmacol.13, 869200 (2022). - PMC - PubMed
    1. Li, Y. et al. The Proinflammatory Role of Guanylate-Binding Protein 5 in Inflammatory Bowel Diseases. Front. Microbiol.13, 926915 (2022). - PMC - PubMed
    1. Luu, L. D. W. et al. Profiling the colonic mucosal response to fecal microbiota transplantation identifies a role for GBP5 in colitis in humans and mice. Nat. Commun.15, 2645 (2024). - PMC - PubMed

LinkOut - more resources