

Machine learning models compared with current clinical indices to predict the outcome of high flow nasal cannula therapy in acute hypoxemic respiratory failure
- PMID: 40055757
- PMCID: PMC11887196
- DOI: 10.1186/s13054-025-05336-4
Machine learning models compared with current clinical indices to predict the outcome of high flow nasal cannula therapy in acute hypoxemic respiratory failure
Abstract
Background: Early identification of patients with acute hypoxemic respiratory failure (AHRF) who are at risk of failing high-flow nasal cannula (HFNC) therapy could facilitate closer monitoring, and timely adjustment/escalation of treatment. We aimed to establish whether machine learning (ML) models could predict HFNC outcome, early in the course of treatment, with greater accuracy than currently used clinical indices.
Methods: We developed ML models trained using measurements made within the first 2 h of treatment from 184 AHRF patients (37% HFNC failures) treated at the respiratory ICU of the University Hospital of Modena between 2018 and 2023. For external validation, we used a dataset on 567 AHRF patients (22% failures) comprising 510 patients from the recent RENOVATE trial in Brazil and 57 from the MIMIC-IV and eICU databases in the US. Predictive performance of the ML models was benchmarked against optimized thresholds of the following clinical indices: respiratory rate oxygenation index (ROX) and variants, heart rate to saturation of pulse oxygen (SpO2) ratio, SpO2/FiO2 ratio, PaO2/FiO2 ratio, sequential organ failure assessment and heart rate, acidosis, consciousness, oxygenation and respiratory rate scores.
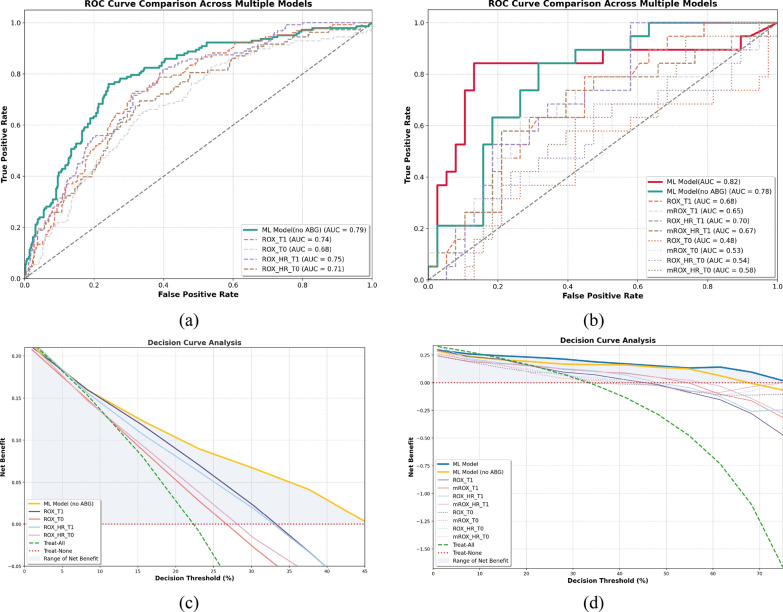
Results: Internal and external predictive performance of a Support Vector Machine (SVM) ML model was superior to all clinical indices across all scenarios tested. In external validation on the 567-patient dataset, a SVM model trained on non-invasive measurements had an accuracy of 73%, sensitivity of 73%, specificity of 73%, and AUC of 0.79. The ROX index had an accuracy of 64%, sensitivity of 79%, specificity of 60%, and AUC of 0.74. When arterial blood gasses (ABG's) were also used for model training, the SVM model had an accuracy of 83%, sensitivity of 84%, specificity of 82%, and AUC of 0.82 in external validation on the MIMIC-IV/eICU dataset. The modified ROX index, which requires PaO2, achieved 70% accuracy, 63% sensitivity, 74% specificity, and AUC of 0.65.
Conclusions: Decision support tools based on SVM models could provide clinicians with more accurate early predictions of HFNC outcome than currently available clinical indices. If available, ABG measurements could improve the capability to accurately identify patients at risk of failing HFNC therapy.
© 2025. The Author(s).
Conflict of interest statement
Declarations. Ethics approval and consent to participate: Not Applicable. Consent for publication: Not Applicable. Competing interests: The authors declare no competing interests.
Figures


References
-
- Frat JP, Thille AW, Mercat A, Girault C, Ragot S, Perbet S, et al. High-flow oxygen through nasal cannula in acute hypoxemic respiratory failure. N Engl J Med. 2015;372:2185–96. - PubMed
-
- Frat JP, Ragot S, Girault C, Perbet S, Prat G, Boulain T, et al. REVA network effect of non-invasive oxygenation strategies in immunocompromised patients with severe acute respiratory failure: a post-hoc analysis of a randomised trial. Lancet Respir Med. 2016;4:646–52. - PubMed
-
- Oczkowski S, Ergan B, Bos L, et al. ERS clinical practice guidelines: high-fow nasal cannula in acute respiratory failure. Eur Respir J. 2022;59(4):2101574. - PubMed
MeSH terms
Grants and funding
LinkOut - more resources
Full Text Sources
Medical
