. 2025 Mar 18;14(6):e039201.
doi: 10.1161/JAHA.124.039201. Epub 2025 Mar 7.

Comprehensive Multiomic Analysis Reveals Metabolic Reprogramming Underlying Human Fontan-Associated Liver Disease

Affiliations

Comprehensive Multiomic Analysis Reveals Metabolic Reprogramming Underlying Human Fontan-Associated Liver Disease

Rasheed Sule et al. J Am Heart Assoc. .

Abstract

Background: The Fontan operation is the current standard of care for single-ventricle congenital heart disease. Almost all patients with Fontan operation develop liver fibrosis at a young age, known as Fontan-associated liver disease (FALD). The pathogenesis and mechanisms underlying FALD remain little understood, and there are no effective therapies. We aimed to present a comprehensive multiomic analysis of human FALD, revealing the fundamental biology and pathogenesis of FALD.

Methods and results: We recently generated a single-cell transcriptomic and epigenomic atlas of human FALD using single-nucleus multiomic RNA sequencing and assay for transposase-accessible chromatin using sequencing, which uncovered substantial metabolic reprogramming. Here, we applied liquid chromatography-mass spectrometry-based untargeted metabolomics to unveil the metabolomic landscape of human FALD, using liver samples/biopsies from age- and sex-matched donors and patients with FALD (n=12 per group). Results were integrated with liver single-nucleus multiomic RNA sequencing and assay for transposase-accessible chromatin using sequencing and serum metabolomics data to present a comprehensive multiomic atlas of FALD.We discovered significant metabolic abnormalities in livers of adolescent patients with Fontan circulation, particularly amino acid metabolism, peroxisomal fatty acid oxidation, cytochrome P450 system, glycolysis, tricarboxylic acid cycle, ketone body metabolism, and bile acid metabolism. Integrated analyses with liver single-nucleus multiomic RNA sequencing and assay for transposase-accessible chromatin using sequencing results unveiled potential underlying mechanisms of these metabolic changes. Comparison with serum metabolomics data indicate that liver metabolic reprogramming contributes to circulatory metabolomic changes in FALD. Furthermore, comparison with metabolomics data of human metabolic dysfunction-associated fatty liver disease and metabolic dysfunction-associated steatohepatitis highlighted dysregulated amino acid metabolism as a common metabolic abnormality.

Conclusions: Our comprehensive multiomic analyses reveal new insights into the fundamental biology and pathogenesis mechanisms of human FALD.

Keywords: Fontan‐associated liver disease (FALD); amino acid metabolism; metabolic reprogramming; metabolomics; multiomics.


Conflict of interest statement

Dr Rychik is a consultant for NUVO Cares. The remaining authors have no disclosures to report.

Figures

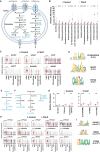
Figure 1
Figure 1. Metabolomics studies identified significant changes in humans FALD.
A, Simplified metadata table showing number of samples in each group, sources of samples, sex, and age. B, Principal component analysis of all detected metabolites between control (n=12) and FALD (n=12) liver tissue samples showing segregation between the 2 groups. C, Heat map showing altered metabolites between control and FALD groups. The color scale from −3 to 3 represents the Z score. A positive Z score (increase in red color intensity) reflects increased metabolite concentration and a negative Z score (increase in blue color intensity) reflects decreased metabolite concentration in FALD liver samples. Hierarchical clustering was performed using Ward's algorithm. D, Enrichment analysis showing the top 25 pathways implicated in FALD. P value is shown as color intensity. CHOP indicates Children's Hospital of Philadelphia; CoA, coenzyme A; ETC, electron transport chain; FALD, Fontan‐associated liver disease; KUMC, Kansas University Medical Center; TCA, tricarboxylic acid; and UBC, University of British Columbia.
Figure 2
Figure 2. Aberrant amino acid metabolism in human FALD.
A, Schematic illustration showing the metabolic pathways of valine, leucine, tyrosine, aspartate, asparagine, glutamate, glutamine, alanine, and proline. Light blue text indicates significantly increased metabolites and gene expression in FALD liver. Purple text indicates significantly decreased metabolites and gene expression in FALD liver. Black text indicates metabolites not detected or not significantly changed. Genes names are italicized and abbreviated. B, Relative abundance of amino acids and their catabolic intermediates (empty circle) in control (n=12) and FALD (n=12) livers. Lines indicate mean±SEM. *P<0.05, **P<0.01, ***P<0.001, based on unpaired 2‐tailed Student's t test. C, Violin plots showing expression of genes involved in metabolism of amino acids in different cell types of control and FALD livers. ^ P adjusted<1×10⁻⁵, ^^ P adjusted<1×10⁻²⁰, ^^^ P adjusted<1×10−50 in cHep FALD vs control. D, Violin plots showing expression of genes involved in liver amino acids transport in different cell types of control and FALD livers. ^ P adjusted<0.05, ^^^ P adjusted<1×10−50 in cHep FALD vs control. E, Enriched DNA sequence motifs and associated transcription factors (P adjusted values shown below protein name) of chromatin regions linked to altered amino acid metabolism and transport gene expression in FALD. Asn indicates asparagine; Asp, aspartate; cHep, central hepatocyte; EC, endothelial cell; FALD, Fontan‐associated liver disease; Gln, glutamine; Glu, glutamate; HSC, hepatic stellate cell; Leu, leucine; pHep, primary hepatocyte; Pro, proline; Tyr, tyrosine; and Val, valine.
Figure 3
Figure 3. Altered peroxisomal fatty acid b‐oxidation and increased cytochrome P450 metabolism in human FALD.
A, Schematic illustration of fatty acid oxidation pathway in the peroxisome. Light blue text indicates significantly increased metabolites/genes in FALD liver tissue. Gene names are italicized and abbreviated. B, Relative abundance of peroxisomal fatty acid oxidation intermediates (empty circle) in control (n=12) and FALD (n=12) liver tissues. Lines indicate mean±SEM. *P<0.05, **P<0.01, ***P<0.001, based on unpaired 2‐tailed Student's t test. C, Violin plots showing relative expression of genes involved in peroxisomal fatty acid oxidation in different cell types of control and FALD livers. ^^ P adjusted<1×10⁻²⁰, ^^^ P adjusted<1×10−50 in cHep FALD vs control. D, Enriched DNA sequence motifs and associated transcription factors (P adjusted values shown below protein name) of chromatin regions linked to peroxisomal FAO gene expression in FALD. E, Schematic illustration of nicotine metabolism via cytochrome P450 metabolic pathway. F, Schematic of a PUFA (linoleic acid) metabolism via cytochrome P450 metabolic pathway. Light blue text indicates significantly increased metabolites/genes in FALD liver tissue. Genes from our snRNA‐ATAC‐seq studies are italicized and abbreviated. G, Relative abundance of nicotine and linoleic acid catabolic intermediates (empty circle) in control (n=12) and FALD (n=12) liver tissues. Lines indicate mean±SEM. *P<0.05, **P<0.01, ***P<0.001, based on unpaired 2‐tailed Student's t test. H, Violin plots showing relative expression of genes involved in cytochrome P450 metabolism in different cell types of control and FALD livers. ^^ P adjusted<1×10⁻²⁰, ^^^ P adjusted<1×10−50 in cHep FALD vs control. I, Enriched DNA sequence motifs and associated transcription factors (P adjusted values shown below protein name) of chromatin regions linked to cytochrome P450 metabolism gene expression in FALD. cHep indicates central hepatocyte; EC, endothelial cell; FALD, Fontan‐associated liver disease; HMG‐CoA, hydroxy‐methylglutaryl coenzyme A; HSC, hepatic stellate cell; pHep, primary hepatocyte; and snRNA‐ATAC‐seq, single‐nucleus multiomic RNA sequencing and assay for transposase‐accessible chromatin using sequencing.
Figure 4
Figure 4. Changes in glycolysis and TCA cycle in human FALD.
A, Schematic illustration of glycolysis and the TCA cycle. Light blue text indicates significantly increased metabolites and genes in FALD liver. Purple text indicates significantly decreased metabolites and genes in FALD liver. Black text indicates metabolites not detected or not significantly changed. Gene names are italicized and abbreviated. B, Relative abundance of glycolysis and TCA cycle intermediates (empty circle) in control (n=12) and FALD (n=12) liver tissues. Lines indicate mean±SEM. *P<0.05, **P<0.01, ***P<0.001, based on unpaired 2‐tailed Student's t test. C, Violin plots showing relative expression of genes involved in glycolysis and TCA cycle in different cell types of control and FALD livers. ^ P adjusted<1×10⁻⁵, ^^ P adjusted<1×10⁻²⁰, ^^^ P adjusted<1×10−50 in cHep FALD vs control. cHep indicates central hepatocyte; FALD, Fontan‐associated liver disease; and TCA, tricarboxylic acid.
Figure 5
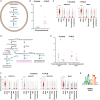
Figure 5. Aberrant ketone and bile acid metabolism in human FALD.
A, Schematic illustration of ketone metabolism. Light blue text indicates significantly increased metabolites and genes in FALD liver tissue. Black text indicates metabolites not detected or no significant changes. Genes from our snRNA‐ATAC‐seq studies are italicized and abbreviated. B, Relative abundance of ketone (empty circle) in control (n=12) and FALD (n=12) liver tissues. Lines indicate mean±SEM. *P<0.05, **P<0.01, ***P<0.001, based on unpaired 2‐tailed Student's t test. C, Violin plots showing relative expression of genes involved in ketone metabolism. ^^^ P adjusted<1×10−50 in cHep FALD vs control. D, Schematic of bile acid metabolism. Light blue text indicates significantly increased metabolites and genes in FALD liver. Purple text indicates significantly decreased metabolites and genes in FALD liver. Black text indicates metabolites not detected or not significantly changed. Gene names are italicized and abbreviated. E, Relative abundance of bile acids (empty circle) in control (n=12) and FALD (n=12) liver tissues. Lines indicate mean±SEM. *P<0.05, **P<0.01, ***P<0.001, based on unpaired 2‐tailed Student's t test. F, Violin plots showing relative expression of genes involved in bile acid metabolism. ^^^ P adjusted<1×10−50 in cHep FALD vs control. G, Enriched DNA sequence motifs and associated transcription factors (P adjusted values shown below protein name) of chromatin regions linked to bile acid metabolism gene expression in FALD. FALD indicates Fontan‐associated liver disease; and snRNA‐ATAC‐seq, single‐nucleus multiomic RNA sequencing and assay for transposase‐accessible chromatin using sequencing
Figure 6
Figure 6. Multiomics comparison for FALD and with MAFLD and MASH.
A, Venn diagram representation of statistically significant unique and overlapping altered metabolic pathways after multiomic integration of transcriptomic data of human liver FALD and metabolomics data of serum and liver FALD. B, Venn diagram representation of significantly altered metabolic pathways in human FALD, MAFLD, and MASH revealed similarities and differences in metabolic changes among different liver disease. C, Schematic illustration of amino acid‐sensing mTORC pathways. Light blue text indicates significantly increased metabolites and genes in FALD liver. Purple text indicates significantly decreased metabolites and gene expression in FALD liver. Black text indicates metabolites not detected or no significant changes. D, Violin plots showing relative expression of genes involved in mTORC signaling. ^P adjusted<1×10⁻⁵, ^^P adjusted<1×10⁻²⁰ in cHep FALD vs control. cHep indicates central hepatocyte; FALD, Fontan‐associated liver disease; MAFLD, metabolic dysfunction–associated fatty liver disease; MASH, metabolic dysfunction–associated steatohepatitis; and mTORC, mechanistic target of rapamycin complex.

Similar articles

Cited by

References

    1. Rychik J, Atz AM, Celermajer DS, Deal BJ, Gatzoulis MA, Gewillig MH, Hsia TY, Hsu DT, Kovacs AH, McCrindle BW, et al. Evaluation and management of the child and adult with Fontan Circulation: a scientific statement from the American Heart Association. Circulation. 2019;140:CIR0000000000000696. doi: 10.1161/CIR.0000000000000696 - DOI - PubMed
    1. Emamaullee J, Zaidi AN, Schiano T, Kahn J, Valentino PL, Hofer RE, Taner T, Wald JW, Olthoff KM, Bucuvalas J, et al. Fontan‐associated liver disease: screening, management, and transplant considerations. Circulation. 2020;142:591–604. doi: 10.1161/CIRCULATIONAHA.120.045597 - DOI - PMC - PubMed
    1. Goldberg DJ, Surrey LF, Glatz AC, Dodds K, O'Byrne ML, Lin HC, Fogel M, Rome JJ, Rand EB, Russo P, et al. Hepatic fibrosis is universal following Fontan operation, and severity is associated with time from surgery: a liver biopsy and hemodynamic study. J Am Heart Assoc. 2017;6:6. doi: 10.1161/JAHA.116.004809 - DOI - PMC - PubMed
    1. Rychik J, Veldtman G, Rand E, Russo P, Rome JJ, Krok K, Goldberg DJ, Cahill AM, Wells RG. The precarious state of the liver after a Fontan operation: summary of a multidisciplinary symposium. Pediatr Cardiol. 2012;33:1001–1012. doi: 10.1007/s00246-012-0315-7 - DOI - PMC - PubMed
    1. Dennis M, Zannino D, du Plessis K, Bullock A, Disney PJS, Radford DJ, Hornung T, Grigg L, Cordina R, d'Udekem Y, et al. Clinical outcomes in adolescents and adults after the Fontan procedure. J Am Coll Cardiol. 2018;71:1009–1017. doi: 10.1016/j.jacc.2017.12.054 - DOI - PubMed

LinkOut - more resources