. 2025 Mar 8;41(1):58.
doi: 10.1007/s10565-025-10001-1.

Targeted nanoparticle delivery system for tumor-associated macrophage reprogramming to enhance TNBC therapy

Affiliations

Targeted nanoparticle delivery system for tumor-associated macrophage reprogramming to enhance TNBC therapy

Xiaoshen Dong et al. Cell Biol Toxicol. .

Abstract

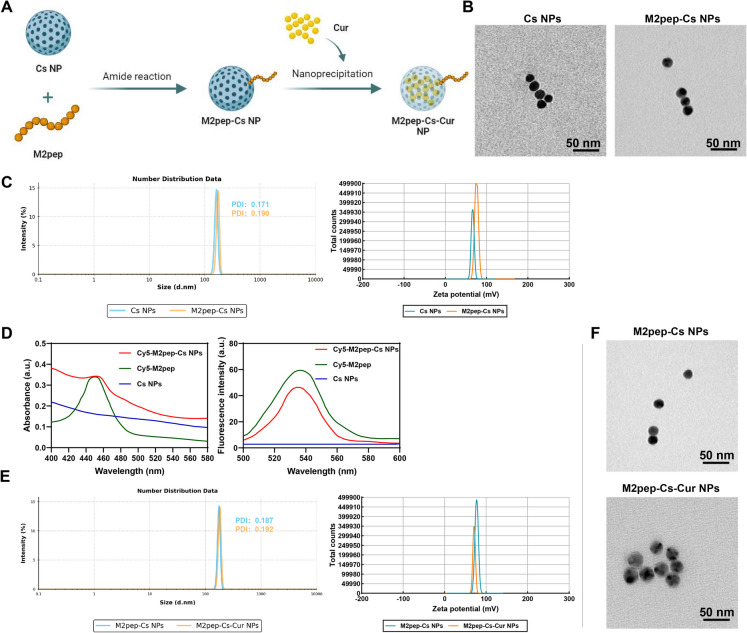
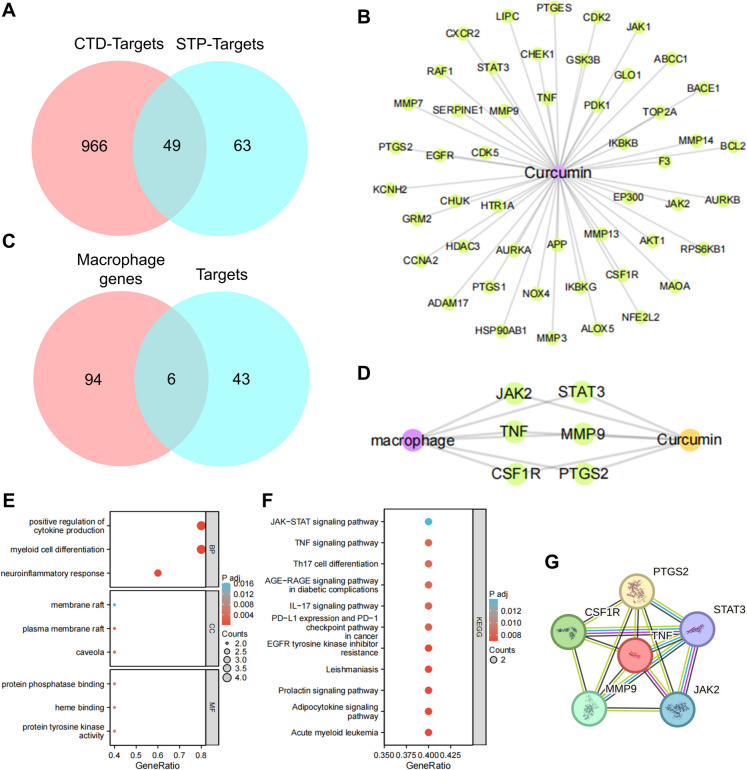
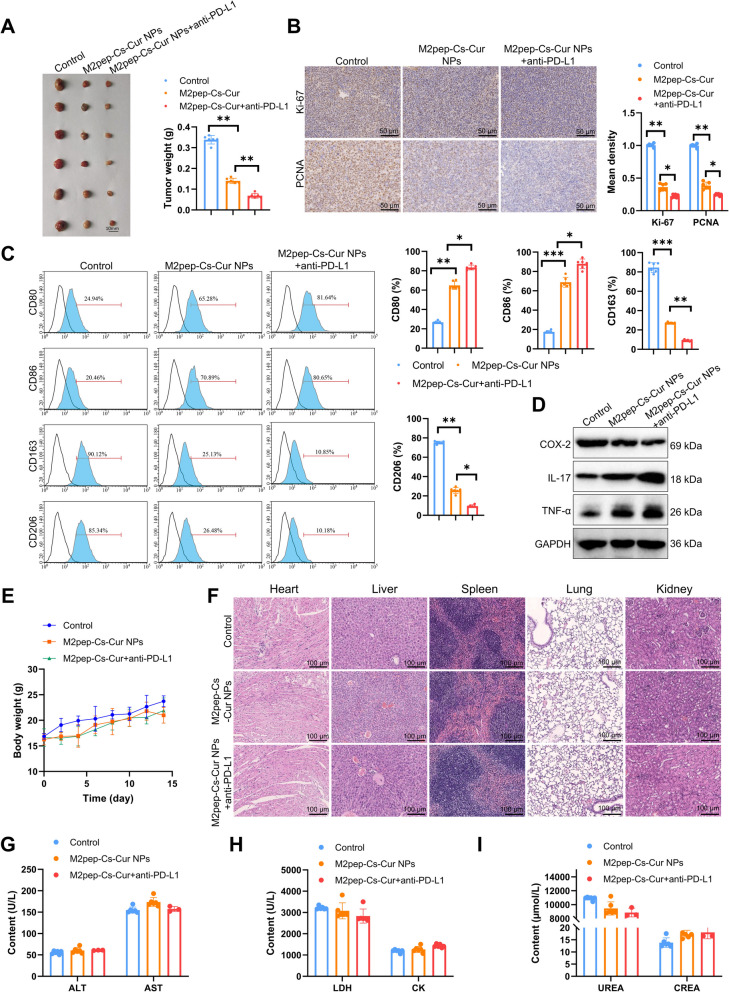
Triple-negative breast cancer (TNBC) poses as a daunting and intricate manifestation of breast cancer, highlighted by few treatment options and a poor outlook. The crucial element in fostering tumor growth and immune resistance is the polarization of tumor-associated macrophages (TAMs) into the M2 state within the tumor microenvironment (TME). To address this, we developed M2 targeting peptide-chitosan-curcumin nanoparticles (M2pep-Cs-Cur NPs), a targeted delivery system utilizing chitosan (Cs) as a carrier, curcumin (Cur) as a therapeutic agent, and targeting peptides for specificity. These NPs effectively inhibited TNBC cell proliferation (~ 70%) and invasion (~ 70%), while increasing the responsiveness of tumors to anti-PD-L1 treatment (~ 50% survival enhancement) in vitro and in vivo. Bioinformatics analysis suggested that Cur modulates TAM polarization by influencing key genes such as COX-2, offering insights into its underlying mechanisms. This study highlights the potential of M2pep-Cs-Cur NPs to reverse M2 polarization in TAMs, providing a promising targeted therapeutic strategy to overcome immunotherapy resistance and improve TNBC outcomes.

Keywords: COX-2; Curcumin; Immunotherapy resistance; Nanoparticles; Reprogramming; Triple-negative breast cancer; Tumor-associated macrophages.


Conflict of interest statement

Declarations. Ethical statement: All animal experiments were approved by the Animal Ethics Committee of China Medical University (No. CMUKT20240259). Competing interests: The authors declare no competing interests.

Figures

Fig. 1
Fig. 1
Preparation and characterization of TAMs M2pep-Cs-Cur NPs. Note: A Simple preparation process of M2pep-Cs-Cur NPs; B TEM images of Cs NPs and M2pep-Cs NPs (scale = 50 nm); C Average hydrodynamic diameter and zeta potential of Cs NPs and M2pep-Cs NPs; D UV/Vis absorption spectra and fluorescence emission spectra of Cs NPs and M2pep-Cs NPs; E Average hydrodynamic diameter and zeta potential of M2pep-Cs NPs and M2pep-Cs-Cur NPs; F TEM images of M2pep-Cs NPs and M2pep-Cs-Cur NPs (scale = 50 nm)
Fig. 2
Fig. 2
Stability, in vitro release, cellular uptake, and toxicity of M2pep-Cs-Cur NPs. Note: A Stability evaluation of M2pep-Cs-Cur NPs at different pH values; B Stability assessment of M2pep-Cs-Cur NPs in various solutions; C In vitro release profile of Cur from M2pep-Cs-Cur NPs at different pH values; D Cytotoxicity of M2pep-Cs NPs or Cs NPs in THP-1 cells; E Dose-dependent cellular toxicity assessment of free Cur and M2pep-Cs-Cur NPs in THP-1 cells; F Immunofluorescence detection of cellular uptake of M2pep-Cs NPs, Cur, and M2pep-Cs-Cur NPs in M2 MΦ (scale = 25 μm); G Flow cytometry analysis of cellular uptake of M2pep-Cs NPs, Cur, and M2pep-Cs-Cur NPs in M2 MΦ; nsP > 0.05, *P < 0.05, ***P < 0.001; All cell experiments were performed in triplicate
Fig. 3
Fig. 3
Impact of M2pep-Cs-Cur NPs on TAMs reprogramming and growth invasion of TNBC cells. Note: A Immunofluorescence assessment of the influence of M2pep-Cs-Cur NPs on M2 cell polarization (scale = 25 μm); B RT-qPCR analysis of the effect of M2pep-Cs-Cur NPs on M2 cell polarization; C Schematic illustration of co-culture of MΦ with MDA-MB-231 and BT-549 cells; (D) CCK8 assay to evaluate the proliferation of MDA-MB-231 and BT-549 cells in each group; E Clonogenic assay to assess the proliferation of MDA-MB-231 and BT-549 cells in each group; F Transwell assay to determine the invasion of MDA-MB-231 and BT-549 cells in each group (scale = 50 μm); G Wound healing test to evaluate the migration of MDA-MB-231 and BT-549 cells in each group (scale = 100 μm); nsP > 0.05, *P < 0.05, ***P < 0.001; All cell experiments were conducted in triplicate
Fig. 4
Fig. 4
Bioinformatics analysis reveals the impact of Cur on key genes in TAMs. Note: A Venn analysis of Cur target genes from CTD and STP databases; B Network diagram of Cur-target genes; C Venn analysis of target genes and MΦ-related genes in the GeneCard database; D Network diagram of Cur-target genes-MΦ; E GO analysis results of six target genes related to MΦ; F KEGG analysis results of six target genes related to MΦ; G Protein interaction results of six target genes related to MΦ
Fig. 5
Fig. 5
Molecular docking results of Cur with six target proteins related to MΦ. Note: A Schematic illustration of the molecular docking of Cur with target proteins; B 2D and 3D structures of Cur molecule; C Molecular docking results of Cur with JAK2; D Molecular docking results of Cur with STAT3; E Molecular docking results of Cur with TNFα; F Molecular docking results of Cur with MMP9; G Molecular docking results of Cur with CSF1R; H Molecular docking results of Cur with COX-2
Fig. 6
Fig. 6
Impact of M2pep-Cs-Cur NPs on TAMs reprogramming through COX-2/TNF&IL-17 pathway. Note: A Expression of COX-2 mRNA in untreated and treated M2 cells with M2pep-Cs-Cur NPs; B Expression of COX-2 protein in untreated and treated M2 cells with M2pep-Cs-Cur NPs; C Protein expression of IL-17 and TNF-α in untreated and treated M2 cells with M2pep-Cs-Cur NPs; D Validation of COX-2 overexpression at mRNA level; E Validation of COX-2 overexpression at protein level; F Immunofluorescence staining of M1 and M2 markers in different groups of MΦ (scale bar = 25 μm); G RT-qPCR analysis of M1 and M2 markers in different groups of MΦ; H EdU labeling experiment to assess the proliferation of MDA-MB-231 and BT-549 cells co-cultured with MΦ in different groups (scale bar = 25 μm); I Clonogenic assay to evaluate the proliferation of MDA-MB-231 and BT-549 cells co-cultured with MΦ in different groups; J Scratch wound assay of MDA-MB-231 and BT-549 cells co-cultured with MΦ, evaluating migration (scale bar = 100 μm); K Transwell assay of MDA-MB-231 and BT-549 cells co-cultured with MΦ, assessing invasion (scale bar = 50 μm); *P < 0.05, **P < 0.01, ***P < 0.001; All cellular experiments were performed in triplicate
Fig. 7
Fig. 7
M2pep-Cs-Cur NPs induce TAMs reprogramming to suppress TNBC growth, invasion, and immunoresistance. Note: A Tumor weight changes in each group of mice; B Immunohistochemical detection of Ki-67 and PCNA expression in tumor tissues (scale = 50 μm); C Flow cytometric analysis of MΦ M1 and M2 markers in tumors; D Expression detection of COX-2, IL-17, and TNFα in tumor tissues of each group of mice; E Changes in body weight of mice in each group; F H&E staining results of heart, liver, spleen, lungs, and kidneys in each group of mice (scale = 100 μm); G Evaluation of liver function indicators (ALT, AST) in each group of mice; H Assessment of cardiac function indicators (CK, LDH) in each group of mice; I Examination of renal function indicators (CREA, urea) in each group; *P < 0.05, **P < 0.01, ***P < 0.001; n = 6 for each group
Fig. 8
Fig. 8
Transcriptomic sequencing reveals key pathway changes in M2pep-Cs-Cur NPs targeting TAMs reprogramming. Note: A Schematic overview of transcriptomic sequencing in TNBC mouse tissues; B Volcano plot analysis of DGEs in untreated (Control, n = 3) and treated (Treat, n = 3) groups with M2pep-Cs-Cur NPs, with red dots indicating significantly upregulated genes, green dots representing significantly downregulated genes, and black dots denoting genes with no significant difference; C Bubble chart for DEGs GO analysis; D Bubble chart for DEGs KEGG analysis; E Expression levels of COX-2 gene in transcriptomic sequencing data; F Expression levels of genes related to MΦ M1 and M2 phenotypes in transcriptomic sequencing data; n = 3 for each group
Fig. 9
Fig. 9
M2pep-Cs-Cur NPs target COX-2 to reverse TAMs M2 polarization and inhibit immunotherapy resistance in TNBC

References

    1. Abdou Y, Goudarzi A, Yu JX, Upadhaya S, Vincent B, Carey LA. Immunotherapy in triple negative breast cancer: beyond checkpoint inhibitors [Internet]. npj Breast Cancer. Springer Science and Business Media LLC. 2022. [cited 2025 Jan 16]. Available from: 10.1038/s41523-022-00486-y. - PMC - PubMed
    1. Aghbashlo M, Amiri H, Moosavi Basri SM, Rastegari H, Lam SS, Pan J, et al. Tuning chitosan’s chemical structure for enhanced biological functions [Internet]. Trends in Biotechnology. Elsevier BV. 2023; pp 785–97. [cited 2025 Jan 16]. Available from: 10.1016/j.tibtech.2022.11.009. - PubMed
    1. Asadollahi L, Mahoutforoush A, Dorreyatim SS, Soltanfam T, Paiva-Santos AC, Peixoto D, et al. Co-Delivery of erlotinib and resveratrol via nanostructured lipid Carriers: A synergistically promising approach for cell proliferation prevention and ROS-Mediated apoptosis activation [Internet]. International Journal of Pharmaceutics. Elsevier BV. 2022; p 122027 [cited 2025 Jan 16]. Available from: 10.1016/j.ijpharm.2022.122027. - PubMed
    1. Bai X, Oberley‐Deegan RE, Bai A, Ovrutsky AR, Kinney WH, Weaver M, et al. Curcumin enhances human macrophage control of Mycobacterium tuberculosis infection [Internet]. Respirology. Wiley. 2016, pp 951–7 [cited 2025 Jan 16]. Available from: 10.1111/resp.12762. - PubMed
    1. Barkal AA, Brewer RE, Markovic M, Kowarsky M, Barkal SA, Zaro BW, et al. CD24 signalling through macrophage Siglec-10 is a target for cancer immunotherapy [Internet]. Nature. Springer Science and Business Media LLC. 2019; pp 392–6 [cited 2025 Jan 16]. Available from: 10.1038/s41586-019-1456-0. - PMC - PubMed

MeSH terms

LinkOut - more resources