. 2025 Apr:81:103578.
doi: 10.1016/j.redox.2025.103578. Epub 2025 Mar 1.

Choline alleviates cognitive impairment in sleep-deprived young mice via reducing neuroinflammation and altering phospholipidomic profile

Affiliations

Choline alleviates cognitive impairment in sleep-deprived young mice via reducing neuroinflammation and altering phospholipidomic profile

Si-Yu Huang et al. Redox Biol. 2025 Apr.

Abstract

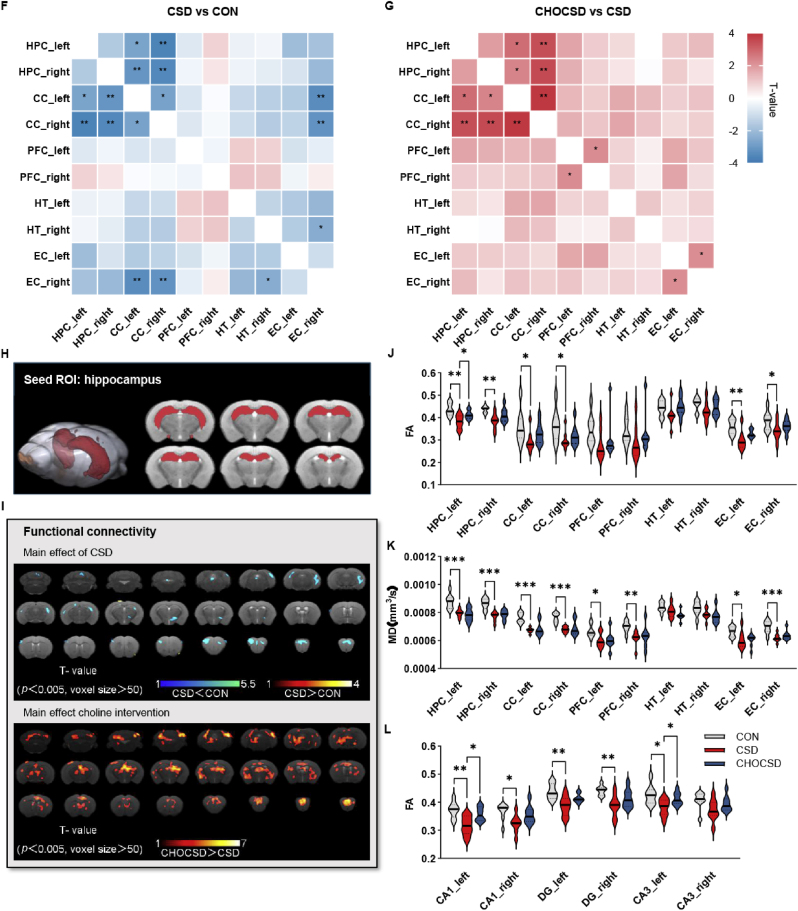
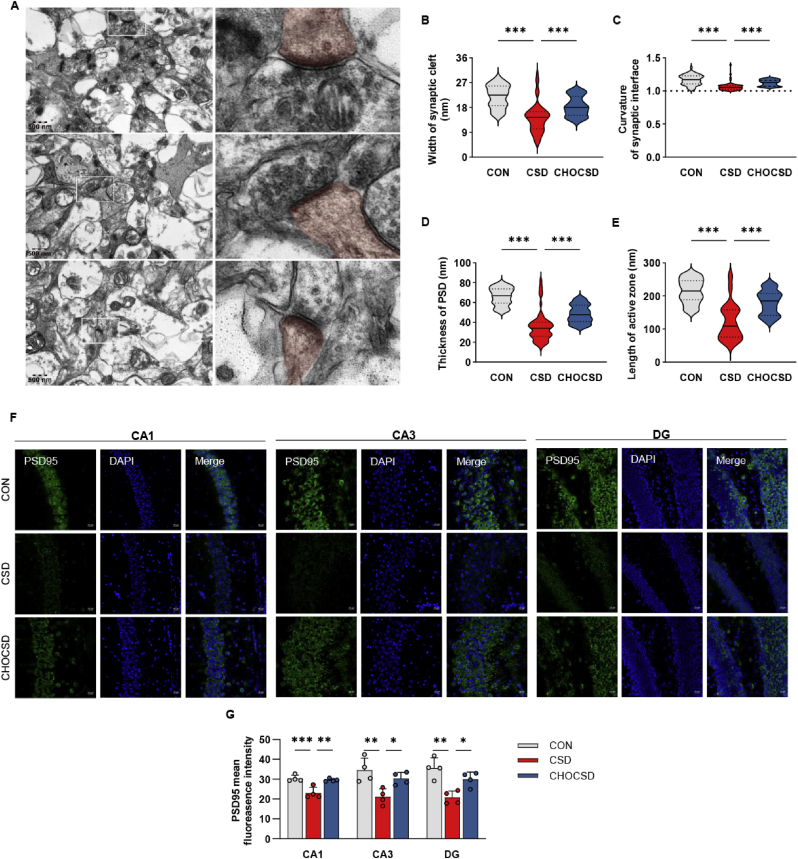
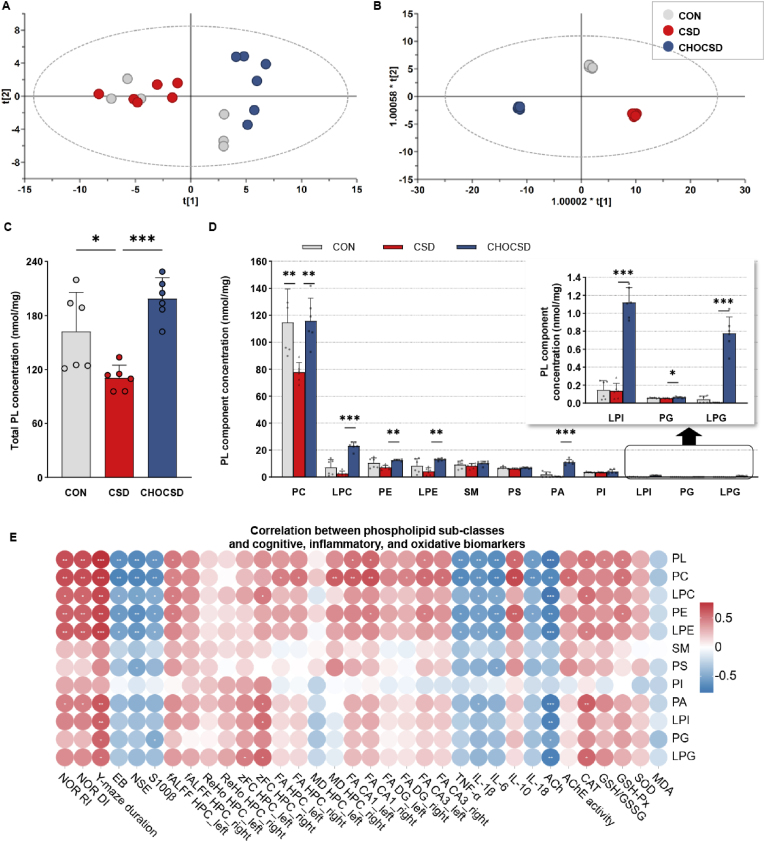
Cognitive impairment resulting from insufficient sleep poses a significant public health concern, particularly in children. The effects and mechanisms of choline on cognitive impairment caused by sleep deprivation are unknown. Chronic sleep deprivation is induced in young mice in this study, followed by feeding diet containing 11.36 g/kg choline bitartrate. Choline supplementation significantly improves spatial learning ability. Functional MRI results reveal the hippocampus as a key region affected by sleep deprivation, where choline supplementation notably preserves hippocampal structural integrity and enhanced connectivity. Additionally, choline ameliorates hippocampal pathological injury, reduces blood-brain barrier permeability and serum brain injury biomarkers. Choline also reduces inflammation and oxidative stress biomarkers, and mitigates microglial activation in the hippocampus, which preserves synaptic plasticity. A key finding is the changes of hippocampal phospholipidomic profile along with cognitive function, and a total of 313 phospholipid molecules are identified. Choline increases the levels of total phospholipid and sub-classes (particularly PC), which are strongly correlated with reduced neuroinflammation and oxidative stress biomarkers, as well as improved cognitive outcomes. Furthermore, there are similar findings in some phospholipid molecules such as PC 36:1, PC O-33:0, PC p-38:3, PE 36:3, PE p-42:4 and PS 44:12. These findings highlight that choline alleviates cognitive impairment in sleep deprivation via reducing neuroinflammation and oxidative stress as well as altering phospholipidomic profile. This study suggests that choline could develop into functional food or medicine ingredient to prevent and treat cognitive impairment by sleep disturbances, particularly children and adolescents.

Keywords: Choline; Cognitive impairment; Magnetic resonance imaging; Neuroinflammation; Phospholipidomics; Sleep deprivation.


Conflict of interest statement

Declaration of competing interest The authors declare that they have no known competing financial interests or personal relationships that could have appeared to influence the work reported in this paper.

Figures

Image 1
Graphical abstract
Fig. 1
Fig. 1
Choline improves spatial learning ability. (A) Schematic outline of the experimental design. (B) Diagram of the NOR test. (C) Diagram of the Y-maze test. (D) Heatmaps from the NOR test. (E) Heatmaps from the Y-maze test. (F) Duration (%) spent in the novel arm of the Y-maze test across groups. (G) Discrimination index analysis in the NOR test across groups. (H) Recognition index in the NOR test across groups. (I) Exploration time of novel versus habituated objects in the NOR test across groups. Data are presented as mean ± SD; n = 8 per group; n defines biological replicates; one-way ANOVA followed by Dunnett's t-test; ∗p < 0.05, ∗∗p < 0.01, ∗∗∗p < 0.001. Abbreviations: NOR, novel object recognition; CON, control; CSD, chronic sleep deprivation; CHOCSD, choline-supplemented chronic deprivation; MRI, magnetic resonance imaging; DTI, diffusion tensor imaging; BOLD, blood oxygen level dependent.
Fig. 2
Fig. 2
Choline preserves brain structure and function. (A) Voxel-wise analysis of fALFF showing the main effects of CSD (upper panel) and the impact of choline supplementation (lower panel); n = 8 per group; one-tailed t-test. (B) Voxel-wise analysis of ReHo changes in the HPC and other brain regions showing the main effects of CSD (upper panel) and the impact of choline supplementation (lower panel); n = 8 per group; one-tailed t-test. (C–E) fALFF value, ReHo value, and zFC analysis of four key DMN-related brain regions and the hypothalamus (HT) across groups; n = 8 per group; one-way ANOVA followed by Dunnett's t-test. (F) Heatmap showing FC correlation differences between the CSD and CON groups in four key DMN-related brain regions and HT; n = 8 per group; Pearson correlation. (G) Heatmap showing FC correlation differences between the CHOCSD and CSD groups in four key DMN-related brain regions and HT; n = 8 per group; Pearson correlation. (H) Anatomical illustration of the seed ROI in the HPC used for FC analysis. (I) Seed-based FC analysis showing the main effects of CSD (upper panel) and the impact of choline supplementation (lower panel); n = 8 per group; one-tailed t-test. (J–L) FA and MD value analysis of four key DMN-related brain regions and the HT across groups; FA values in HPC subregions (CA1, CA3, DG) across groups; n = 8 per group; one-way ANOVA followed by Dunnett's t-test. Data are presented as mean ± SD; n defines biological replicates; ∗p < 0.05, ∗∗p < 0.01, ∗∗∗p < 0.001. Abbreviations: CON, control; CSD, chronic sleep deprivation; CHOCSD, choline-supplemented chronic deprivation; fALFF, fractional amplitude of low-frequency fluctuations; DMN, default mode network; ReHo, regional homogeneity; HPC, hippocampus; zFC, z-transformed functional connectivity; FC, functional connectivity; ROI, region of interest; FA, fractional anisotropy; MD, mean diffusivity; DG, dentate gyrus; CC, cingulate cortex; PFC, prefrontal cortex; HT, hypothalamus; EC; entorhinal cortex.
Fig. 2
Fig. 2
Choline preserves brain structure and function. (A) Voxel-wise analysis of fALFF showing the main effects of CSD (upper panel) and the impact of choline supplementation (lower panel); n = 8 per group; one-tailed t-test. (B) Voxel-wise analysis of ReHo changes in the HPC and other brain regions showing the main effects of CSD (upper panel) and the impact of choline supplementation (lower panel); n = 8 per group; one-tailed t-test. (C–E) fALFF value, ReHo value, and zFC analysis of four key DMN-related brain regions and the hypothalamus (HT) across groups; n = 8 per group; one-way ANOVA followed by Dunnett's t-test. (F) Heatmap showing FC correlation differences between the CSD and CON groups in four key DMN-related brain regions and HT; n = 8 per group; Pearson correlation. (G) Heatmap showing FC correlation differences between the CHOCSD and CSD groups in four key DMN-related brain regions and HT; n = 8 per group; Pearson correlation. (H) Anatomical illustration of the seed ROI in the HPC used for FC analysis. (I) Seed-based FC analysis showing the main effects of CSD (upper panel) and the impact of choline supplementation (lower panel); n = 8 per group; one-tailed t-test. (J–L) FA and MD value analysis of four key DMN-related brain regions and the HT across groups; FA values in HPC subregions (CA1, CA3, DG) across groups; n = 8 per group; one-way ANOVA followed by Dunnett's t-test. Data are presented as mean ± SD; n defines biological replicates; ∗p < 0.05, ∗∗p < 0.01, ∗∗∗p < 0.001. Abbreviations: CON, control; CSD, chronic sleep deprivation; CHOCSD, choline-supplemented chronic deprivation; fALFF, fractional amplitude of low-frequency fluctuations; DMN, default mode network; ReHo, regional homogeneity; HPC, hippocampus; zFC, z-transformed functional connectivity; FC, functional connectivity; ROI, region of interest; FA, fractional anisotropy; MD, mean diffusivity; DG, dentate gyrus; CC, cingulate cortex; PFC, prefrontal cortex; HT, hypothalamus; EC; entorhinal cortex.
Fig. 3
Fig. 3
Choline reverses brain injury. (A) Representative H&E staining of HPC subregions (CA1, CA3, DG) across groups; n = 4 per group; Scale bar = 100 μm. (B) Representative Nissl staining of HPC subregions (CA1, CA3, DG) across groups; n = 4 per group; Scale bar = 100 μm. (C) Representative images of Evans Blue (EB) staining of HPC subregions (CA1, CA3, DG) across groups; n = 4 per group; Scale bar = 20 μm. (D) Quantification analysis of EB fluorescence intensity in HPC subregions (CA1, CA3, DG) across groups; n = 4 per group; one-way ANOVA followed by Dunnett's t-test. (E) Brain tissue EB concentration across groups; n = 6 per group; one-way ANOVA followed by Dunnett's t-test. (F–G) Serum S100β and NSE levels measured by ELISA across groups; n = 8 per group; one-way ANOVA followed by Dunnett's t-test. Data are presented as mean ± SD; n defines biological replicates; ∗p < 0.05, ∗∗p < 0.01, ∗∗∗p < 0.001. Abbreviations: CON, control; CSD, chronic sleep deprivation; CHOCSD, choline-supplemented chronic deprivation; DG, dentate gyrus; EB, evans blue; NSE, neuron-specific enolase.
Fig. 4
Fig. 4
Choline inhibits inflammation and oxidative stress. (A) Level of ACh content; n = 6 per group; one-way ANOVA followed by Dunnett's t-test. (B) Representative images of α7-nAChR staining in the HPC across groups; n = 4 per group; Scale bar = 50 μm. (C) Quantitative analysis of α7-nAChR positive area (% of total area); n = 4 per group. (D–E) The protein expression of α7-nAChR protein expression in HPC across groups detected by western blot; n = 3 per group; one-way ANOVA followed by Dunnett's t-test. (F–J) ELISA results showing levels of inflammatory cytokines: TNF-α, IL-1β, IL-6, IL-18, and IL-10 in the HPC across groups; n = 6 per group; one-way ANOVA followed by Dunnett's t-test. (K–Q) Levels of oxidative stress-related markers, including MDA, GSH, GSSG, and the GSH/GSSG ratio measured by LC-MS/MS, as well as GSH-Px, CAT, and SOD activities, were assessed in the HPC across groups; n = 6 per group; one-way ANOVA followed by Dunnett's t-test. Data are presented as mean ± SD; n defines biological replicates; ∗p < 0.05, ∗∗p < 0.01, ∗∗∗p < 0.001. Abbreviations: CON, control; CSD, chronic sleep deprivation; CHOCSD, choline-supplemented chronic deprivation; ACh, acetylcholine; α7-nAChR, alpha7 nicotinic acetylcholine receptor; HPC, hippocampus; MDA, malondialdehyde; CAT, catalase; GSH, glutathione; GSH-Px, glutathione peroxidase; GSSG, oxidized glutathione; SOD, superoxide dismutase.
Fig. 5
Fig. 5
Choline reduces activation of microglia. (A) Representative images of Iba1+ microglia staining of HPC subregions (CA1, CA3, DG) across groups; n = 4 per group; Scale bar = 50 μm. (B) Quantitative analysis of IBA1+ microglia as a percentage of the total area in HPC subregions (CA1, CA3, DG) across groups; n = 4 per group; one-way ANOVA followed by Dunnett's t-test. (C) Representative 3D reconstruction of Iba1+ microglia from confocal microscopy images in the CA1 region illustrating morphological differences between groups; n = 4 per group; Scale bar = 10 μm. (D–F) Quantitative analysis of soma volume, total process length and total terminal points of IBA1+ microglia in the CA1 region across groups; n = 4 per group; one-way ANOVA followed by Dunnett's t-test. (G) Sholl analysis of IBA1+ microglial process complexity showing the number of intersections at different distances from the soma; n = 4 per group. Data are presented as mean ± SD; n defines biological replicates; ∗p < 0.05, ∗∗p < 0.01, ∗∗∗p < 0.001. Abbreviations: CON, control; CSD, chronic sleep deprivation; CHOCSD, choline-supplemented chronic deprivation; DG, dentate gyrus.
Fig. 6
Fig. 6
Choline preserves synaptic plasticity. (A) Transmission electron microscopy (TEM) images of synaptic structures in the CA1 region across the three groups, with the postsynaptic membrane and its adjacent regions marked in red to highlight the postsynaptic elements; n = 4 per group; Scale bar = 500 nm. (B–E) Quantitative bar graphs depicting the width of the synaptic cleft, curvature of the synaptic interface, thickness of the postsynaptic density (PSD) and length of the active zone across groups, with 60 synapses observed per group; n = 4 per group; one-way ANOVA followed by Dunnett's t-test. (F) Representative images of PSD95 staining of HPC subregions (CA1, CA3, DG) across groups; n = 4 per group; Scale bar = 20 μm. (G) Quantitative analysis of PSD95 mean fluorescence intensity in HPC subregions (CA1, CA3, DG) across groups; n = 4 per group; one-way ANOVA followed by Dunnett's t-test. Data are presented as mean ± SD; n defines biological replicates; ∗p < 0.05, ∗∗p < 0.01, ∗∗∗p < 0.001. Abbreviations: CON, control; CSD, chronic sleep deprivation; CHOCSD, choline-supplemented chronic deprivation; TEM, transmission electron microscopy; PSD, postsynaptic density; HPC, hippocampus; DG, dentate gyrus.
Fig. 7
Fig. 7
Phospholipidomic profile characteristics and the role of phospholipid sub-classes in enhancing cognitive function. (A) Score plots for PL profile in HPC samples from three groups based on PCA model; n = 6 per group. (B) Score plots for PL profile in HPC samples from three groups based on OPLS-DA model; n = 6 per group. (C) Total phospholipid concentration in the HPC across groups; n = 6 per group; one-way ANOVA followed by Dunnett's t-test. (D) PL component analysis showing concentrations of PC, LPC, PE, and other major PL components in the HPC; The inset shows the concentrations of LPI, PG, and LPG across groups; n = 6 per group; one-way ANOVA followed by Dunnett's t-test. (E) Correlation heatmaps showing the relationship between phospholipid sub-classes and cognitive, inflammatory, and oxidative biomarkers; n = 6 per group; Pearson correlation. Data are presented as mean ± SD; n defines biological replicates; ∗p < 0.05, ∗∗p < 0.01, ∗∗∗p < 0.001. Abbreviations: CON, control; CSD, chronic sleep deprivation; CHOCSD, choline-supplemented chronic deprivation; PL, phospholipid; PC, phosphatidylcholine; LPC, lyso-phosphatidylcholine; PE, phosphatidylethanolamine; LPE, lyso-phosphatidylethanolamine; SM, sphingomyelin; PS, phosphatidylserine; PA, phosphatidic acid; PI, phosphatidylinositol; LPI, lyso-phosphatidylinositol; PG, phosphatidylglycerol; LPG, lyso-phosphatidylglycerol; NOR, novel object recognition; RI, recognition index; DI, discrimination index; EB, evans blue; NSE, neuron-specific enolase; fALFF, fractional amplitude of low-frequency fluctuations; ReHo, regional homogeneity; zFC, z-transformed functional connectivity; FA, fractional anisotropy; MD, mean diffusivity; DG, dentate gyrus; ACh, acetylcholine; α7-nAChR, alpha7 nicotinic acetylcholine receptor; HPC, hippocampus; MDA, malondialdehyde; CAT, catalase; GSH, glutathione; GSSG, oxidized glutathione; SOD, superoxide dismutase; PCA, principal component analysis; OPLS-DA, orthogonal projections to latent structures-discriminant analysis; SD, standard deviation.
Fig. 8
Fig. 8
Role of phospholipid molecules in cognitive improvement. (A)–(B) Volcano plots of OPLS-DA models displaying the differential phospholipid species between group comparisons: CON vs. CSD and CSD vs. CHOCSD. (C) The bar plots display the log fold changes in key phospholipid molecules between the CSD vs. CON group and the CHOCSD vs. CSD group; The molecules are arranged along the X-axis in decreasing order of their VIP values derived from the OPLS-DA model comparing the CSD and CON groups. (D) Correlation heatmaps showing the relationship between key phospholipid molecules and cognitive, inflammatory, and oxidative biomarkers; Pearson correlation. n = 6 per group; n defines biological replicates. Abbreviations: CON, control; CSD, chronic sleep deprivation; CHOCSD, choline-supplemented chronic deprivation; PL, phospholipid; PC, phosphatidylcholine; LPC, lyso-phosphatidylcholine; PE, phosphatidylethanolamine; LPE, lyso-phosphatidylethanolamine; SM, sphingomyelin; PS, phosphatidylserine; PA, phosphatidic acid; PI, phosphatidylinositol; LPI, lyso-phosphatidylinositol; PG, phosphatidylglycerol; LPG, lyso-phosphatidylglycerol; NOR, novel object recognition; RI, recognition index; DI, discrimination index; EB, evans blue; NSE, neuron-specific enolase; fALFF, fractional amplitude of low-frequency fluctuations; ReHo, regional homogeneity; zFC, z-transformed functional connectivity; FA, fractional anisotropy; MD, mean diffusivity; DG, dentate gyrus; ACh, acetylcholine; α7-nAChR, alpha7 nicotinic acetylcholine receptor; HPC, hippocampus; MDA, malondialdehyde; CAT, catalase; GSH, glutathione; GSSG, oxidized glutathione; SOD, superoxide dismutase; PCA, principal component analysis; OPLS-DA, orthogonal projections to latent structures-discriminant analysis; VIP, variable importance in projection.

References

    1. Hirshkowitz M., Whiton K., Albert S.M., Alessi C., Bruni O., DonCarlos L., Hazen N., Herman J., Katz E.S., Kheirandish-Gozal L., Neubauer D.N., O'Donnell A.E., Ohayon M., Peever J., Rawding R., Sachdeva R.C., Setters B., Vitiello M.V., Ware J.C., Adams Hillard P.J. National Sleep Foundation's sleep time duration recommendations: methodology and results summary. Sleep Health. 2015;1:40–43. doi: 10.1016/j.sleh.2014.12.010. - DOI - PubMed
    1. Matricciani L., Olds T., Petkov J. In search of lost sleep: secular trends in the sleep time of school-aged children and adolescents. Sleep Med. Rev. 2012;16:203–211. doi: 10.1016/j.smrv.2011.03.005. - DOI - PubMed
    1. Lan Q.-Y., Chan K.C., Yu K.N., Chan N.Y., Wing Y.K., Li A.M., Au C.T. Sleep duration in preschool children and impact of screen time. Sleep Med. 2020;76:48–54. doi: 10.1016/j.sleep.2020.09.024. - DOI - PubMed
    1. Lowe C.J., Safati A., Hall P.A. The neurocognitive consequences of sleep restriction: a meta-analytic review. Neurosci. Biobehav. Rev. 2017;80:586–604. doi: 10.1016/j.neubiorev.2017.07.010. - DOI - PubMed
    1. Giri B., Kinsky N., Kaya U., Maboudi K., Abel T., Diba K. Sleep loss diminishes hippocampal reactivation and replay. Nature. 2024;630:935–942. doi: 10.1038/s41586-024-07538-2. - DOI - PMC - PubMed

MeSH terms

LinkOut - more resources