. 2025 Mar 18;6(3):102000.
doi: 10.1016/j.xcrm.2025.102000. Epub 2025 Mar 7.

LTA4H improves the tumor microenvironment and prevents HCC progression via targeting the HNRNPA1/LTBP1/TGF-β axis

Affiliations

LTA4H improves the tumor microenvironment and prevents HCC progression via targeting the HNRNPA1/LTBP1/TGF-β axis

Shuai Yang et al. Cell Rep Med. .

Abstract

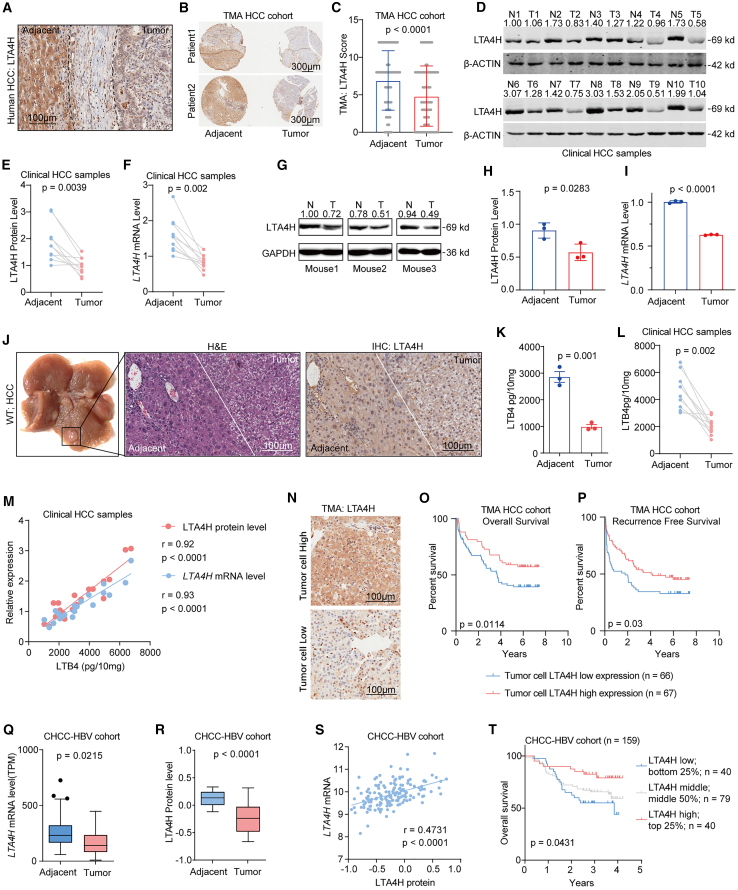
Leukotriene A4 hydrolase (LTA4H), an inflammatory mediator, has garnered attention for its role in the development of chronic lung diseases and various cancers. Our study highlights the protective role of LTA4H in hepatocellular carcinoma (HCC) occurrence and progression. LTA4H is downregulated in clinical and mouse HCC tumors. LTA4H deficiency exacerbates hepatocyte damage by restraining JNK activation and promotes CD206+ macrophage polarization through the upregulation of LTBP1 expression and downstream transforming growth factor β (TGF-β) secretion and activation. Mechanistically, LTA4H induces heterogeneous nuclear ribonucleoprotein A1 (HNRNPA1) phosphorylation, enhancing their interaction and leading to the functional inhibition of HNRNPA1 in regulating Ltbp1 mRNA maturation and processing in the nucleus. LTA4H-deficient patients exhibit poor prognosis and immunotherapy resistance. Combination therapy targeting TGF-β and PD-1 significantly improves the immunotherapy resistance of LTA4H-knockout Hepa1-6 tumors. Our findings reveal the previously unreported role of LTA4H in regulating the tumor microenvironment and provide insights into potential diagnostic and therapeutic strategies for patients with LTA4H-deficient HCC.

Keywords: BLT1; CD206(+) macrophage; H3K27ac; HDAC1; HNRNPA1; LTA4H; LTBP1; TGF-β; hepatocellular carcinoma; immunotherapy resistance.


Conflict of interest statement

Declaration of interests H.W., S.Y., and L.C. are inventors on a provisional China patent application related to this work (serial no. 202410654363.0, filed on 24 May 2024).

Figures

None
Graphical abstract
Figure 1
Figure 1
Downregulation of LTA4H was associated with poor prognosis in patients with HCC (A) IHC detection of LTA4H in human HCC tissues. (B and C) TMA analysis of LTA4H in HCC and para-tumor tissues. (D and E) Western blot (WB) and quantification of LTA4H in clinical HCC samples. (F) qPCR detection of LTA4H in clinical HCC samples. (G–J) WB, qPCR, and IHC detection of LTA4H in the DEN-induced mouse HCC model. (K) ELISA detection of LTB4 in DEN-induced mouse HCC models. (L) ELISA detection of LTB4 in clinical HCC samples. (M) Pearson correlation of LTB4 with LTA4H mRNA and protein levels in clinical HCC samples. (N) Representative images of tumors with low and high LTA4H expression in the TMA HCC cohort. (O and P) Overall survival (OS) and recurrence-free survival (RFS) according to LTA4H level of patients with HCC in the TMA HCC cohort (n = 133). (Q and R) Comparison of LTA4H mRNA and protein levels in tumoral and adjacent tissues in the CHCC-HBV cohort. (S) Pearson correlation of LTA4H mRNA and protein levels in the CHCC-HBV cohort. (T) OS analysis according to the LTA4H protein level in the CHCC-HBV cohort. (A, J, and N) Scale bar: 100 μm. (B) Scale bar: 300 μm. (C) p value was calculated by Wilcoxon rank-sum test (n = 133), data represent mean ± SD. (E, F, and L) p value was calculated by paired Wilcoxon signed-rank test (n = 10). (O, P, and T) p value was calculated by log rank test. (H, I, and K) p value was calculated by Student’s t test (n = 3), data represent mean ± SD. (Q and R) p value was calculated by Wilcoxon rank-sum test (n = 159), the line and box represent median and upper and lower quartiles, respectively. All the replicates represent biological replicates. See also Tables S1 and S2.
Figure 2
Figure 2
Hepatocyte-specific LTA4H ablation promotes hepatocarcinogenesis (A) Scheme of the DEN-induced HCC mouse model. (B) Gross liver tumor images from LTA4Hf/f, LTA4HΔhep, and LTA4HKO mice post DEN treatment. (C and D) Liver weight/body weight ratios and tumor counts among LTA4Hf/f, LTA4HΔhep, and LTA4HKO mice. (E and F) Serum ALT and AST levels for liver injury evaluation. (G) H&E, LTA4H, TUNEL, and PCNA staining of mouse liver sections. (H and I) Comparison of the proportions of TUNEL+ and PCNA+ cells among LTA4Hf/f, LTA4HΔhep, and LTA4HKO mice. (G) H&E image scale bar: 500 μm, IHC image scale bar: 200 μm. (C–F, H, and I) p values were calculated by one-way ANOVA with Tukey’s multiple comparison analysis (n = 6). Data represent mean ± SD. All the replicates represent biological replicates. See also Figure S1.
Figure 3
Figure 3
LTA4H ablation mediates hepatocytic damage via reducing JNK signal activation (A) RNA sequencing scheme for LTA4Hf/f and LTA4HKO primary hepatocytes. (B) KEGG enrichment of downregulated genes in LTA4HKO hepatocytes. (C) Enriched genes in the ErbB signaling pathway in LTA4HKO hepatocytes. (D) WB detection of key MAPK signaling molecules (total/phosphorylated p38 MAPK, JNK, and ERK) in LTA4Hf/f, LTA4HΔhep, and LTA4HKO adjacent liver tissues from mice HCC models. (E–G) qPCR analysis of Egf, Egfr, and Nras in LTA4Hf/f and LTA4HKO hepatocytes (n = 3). (H–J) Validation of Egf, Egfr, and Nras expression in adjacent liver tissues from LTA4Hf/f, LTA4HΔhep, and LTA4HKO mice HCC models (n = 6). (K) Immunoblot of total/phosphorylated JNK and c-Jun in LTA4Hf/f and LTA4HKO hepatocytes treated with DEN, ethanol (vehicle of LTB4), LTB4, JNK inhibitor, BLT1 inhibitor, and BLT2 inhibitor as indicated. (L) Comparison of the viability of LTA4Hf/f and LTA4HKO hepatocytes subjected to different treatments (n = 3). (M) qPCR analysis of Il6 expression in LTA4Hf/f and LTA4HKO hepatocytes under various treatments (n = 3). (E–G) p values were calculated by Student’s t test, data represent mean ± SD. (H–J, L, and M) p values were calculated by one-way ANOVA with Tukey’s multiple comparison analysis, data represent mean ± SD. All the replicates represent biological replicates. See also Figure S2; Table S3.
Figure 4
Figure 4
LTA4H deficiency shifts the tumor microenvironment of HCC toward high infiltration of M2-like macrophage (A) Heatmap of 29 markers expression in each cell cluster. (B) t-distributed stochastic neighbor embedding (t-SNE) plot of CyTOF data from CD45+ cells in LTA4Hf/f and LTA4HKO HCC tumors (n = 5), annotated into specific cell types. (C and D) t-SNE plots showing cell subpopulations with annotations based on differentially expressed markers in CD45+ cells from LTA4Hf/f and LTA4HKO HCC tumors. (E) Proportion of differential cell clusters among CD45+ cells in LTA4Hf/f and LTA4HKO HCC tumors. (F) Diffusion map showing macrophage clusters as a phenotypic continuum. (G and H) Mean expression of CD206 and CD274 along diffusion component 1. (I) Ratio comparison of CD206+ to CD40+ macrophages in LTA4Hf/f and LTA4HKO HCC tumors. (J) mIHC staining of F4/80, CD40, and CD206 verifying macrophage infiltration in LTA4Hf/f, LTA4HΔhep, and LTA4HKO HCC tissues. Red arrow: CD206+ macrophages; green arrow: CD40+ macrophages. Scale bar: 20 μm. (K) Quantification of CD206+ macrophages and the CD206+/CD40+ macrophage ratio in LTA4Hf/f, LTA4HΔhep, and LTA4HKO HCC tumors. (E) The p value was calculated by Wilcoxon rank-sum test with Benjamini-Hochberg adjustment (n = 5), the line and box represent median and upper and lower quartiles, respectively. (I) The p value was calculated by Wilcoxon rank-sum test (n = 5), the line and box represent median and upper and lower quartiles, respectively. (K) p values were calculated by one-way ANOVA with Tukey’s multiple comparison analysis (n = 5), data represent mean ± SD. All the replicates represent biological replicates. See also Figures S3 and S4; Table S4.
Figure 5
Figure 5
Hepatocyte-specific LTA4H deficiency promotes M2-like macrophage polarization by upregulating LTBP1 expression and TGF-β secretion (A) Volcano plot of differentially expressed and secreted genes in LTA4HKO vs. LTA4Hf/f hepatocytes (Figure 3A). (B) Transcript level of Ltbp1 in LTA4Hf/f and LTA4HKO hepatocytes (n = 3). (C and D) mRNA and protein levels of LTBP1 in liver tissues of LTA4Hf/f, LTA4HΔhep, and LTA4HKO mice (n = 5). (E–G) mRNA and protein levels of LTBP1 in Hepa1-6 cells with LTA4H overexpression or knockout (n = 3). (H and I) ELISA for secreted TGF-β in supernatants of Hepa1-6 cells with LTA4H overexpression or knockout (n = 3). (J and K) ELISA for active and total TGF-β serum levels in LTA4Hf/f, LTA4HΔhep, and LTA4HKO DEN-induced HCC models (n = 4). (L) The coculture model of BMDMs and CM from scramble or LTA4H KO Hepa1-6 cells, CM pretreated with HCl/NaOH. (M and N) Transcript levels of Arg1 and Mrc1 in BMDMs under different treatments (n = 3). (O) CD206 immunofluorescence in BMDMs from coculture system under various treatments. Scale bar: 200 μm. (P) Quantification of CD206+ macrophage in BMDMs from coculture system under various treatments (n = 3). (Q) mIHC staining for LTA4H, LTBP1, CD206, and CD68 in HCC tissues with low or high LTA4H expression from the TMA HCC cohort. Scale bar: 200 μm, enlarged images scale bar: 20 μm. (R) Quantification and Pearson correlation among LTA4H, LTBP1, and CD206+ macrophages in the TMA HCC cohort. (S) Liver images and H&E staining of orthotopic HCC tumors (Hepa1-6 scramble and LTA4H KO) with or without macrophage depletion. Scale bar: 4 mm. (T) Tumor burden comparison across groups, determined by tumor-to-liver area ratio in sections (n = 5). (B, E, and H) p value was calculated by Student’s t test, data represent mean ± SD. (C, F, I–K, M, N, P, and T) p values were calculated by one-way ANOVA with Tukey’s multiple comparison analysis, data represent mean ± SD. All the replicates represent biological replicates. See also Figures S5 and S6.
Figure 6
Figure 6
LTA4H negatively regulates LTBP1 expression by inhibiting Ltbp1 mRNA maturation and processing mediated by HNRNPA1 (A) Venn diagram of proteins identified via anti-IgG and anti-Flag immunoprecipitation-mass spectrometry (IP-MS). (B) Gene Ontology (GO) and Reactome pathway analyses of 46 potential LTA4H-binding proteins. (C) Venn diagram of top LTA4H-binding candidates. (D and E) WB and qPCR for LTBP1 and HNRNPA1 expression in Hepa1-6 with Hnrnpa1 knockdown. (F and G) Reciprocal IP validated LTA4H-HNRNPA1 interaction in Hepa1-6 cells. (H and I) Reciprocal IP validated LTA4H-HNRNPA1 interaction in primary hepatocytes. (J and K) coIP tested LTA4H-HNRNPA1 interaction in LTA4H-overexpressing Hepa1-6 cells with or without RNaseA/T1 treatment. (L) Endogenous HNRNPA1 phosphorylation assessed via WB after coIP in LTA4H KO Hepa1-6 cells treated with LTB4 for various durations. (M) RIP-PCR validated HNRNPA1 and Ltbp1 mRNA interaction after LTB4 treatment in Hepa1-6 cells with or without LTA4H knockout. (N) coIP tested LTA4H-HNRNPA1 interaction in Hepa1-6 cells over time under LTB4 treatment. (O) RIP-PCR verified HNRNPA1-Ltbp1 mRNA interaction in cells described in (N). (P) LTA4H distribution was examined in nuclear and cytoplasmic extracts from Hepa1-6 cell with different treatments. (Q) WB examined the effects of LTB4, BLT1 inhibitor, and HNRNPA1 knockdown on LTBP1 expression in Hepa1-6 scramble and LTA4H KO cells. (R) Liver images and H&E staining of Hepa1-6 scramble and LTA4H KO orthotopic HCC tumors with Hnrnpa1 or Ltbp1 knockdown (n = 5). Scale bar: 4 mm. (E, M, and Q) p values were calculated by one-way ANOVA with Tukey’s multiple comparison analysis (n = 3), data represent mean ± SD. All the replicates represent biological replicates. See also Figures S7 and S8; Table S5.
Figure 7
Figure 7
TGF-β blockade potentiates the efficacy of anti-PD-1 therapy in LTA4H knockout tumor-bearing mice (A) Tumor progression was monitored at 5, 9, and 13 days post inoculation using live bioluminescent imaging in mice injected with scramble or LTA4H KO Hepa1-6 cells and treated with IgG or blocking antibody as indicated. (B and C) Quantification of the liver tumor burden from live bioluminescent imaging studies. (D) Images of orthotopic HCC tumors from the indicated treatment groups. (E) H&E staining of Hepa1-6 orthotopic HCC tumors from treatment groups. Scale bar: 4 mm. (F) Comparison of tumor burden (tumor area/whole liver area) in orthotopic HCC tumors. (G) mIHC staining of CD206+ macrophages, PD-1+CD8+ T cells, and GZMB+CD8+ T cells in Hepa1-6 scramble and LTA4H KO orthotopic HCC tumors with the indicated treatments. Scale bar: 20 μm. (H–K) Comparison of CD206+ macrophages, CD8+ T cells, PD-1+CD8+ T cells, and GZMB+CD8+ T cells among Hepa1-6 scramble and LTA4H KO orthotopic HCC tumors with the indicated treatments. (L) mIHC staining of LTA4H, CD68, and CD206 in human HCC samples with varying responses to ICIs. Scale bar: 100 μm. (M and N) Comparison of LTA4H expression in HCC tumor cells and the percentage of CD206+ macrophages between responders (n = 6) and non-responders (n = 7). (B, C, F, and H–K) p values were calculated by one-way ANOVA with Tukey’s multiple comparison analysis (n = 5), data represent mean ± SD. (M and N) p value was calculated by Wilcoxon rank-sum test, data represent mean ± SD. All the replicates represent biological replicates. See also Table S6.

References

    1. Singal A.G., Kanwal F., Llovet J.M. Global trends in hepatocellular carcinoma epidemiology: implications for screening, prevention and therapy. Nat. Rev. Clin. Oncol. 2023;20:864–884. doi: 10.1038/s41571-023-00825-3. - DOI - PubMed
    1. Llovet J.M., Pinyol R., Yarchoan M., Singal A.G., Marron T.U., Schwartz M., Pikarsky E., Kudo M., Finn R.S. Adjuvant and neoadjuvant immunotherapies in hepatocellular carcinoma. Nat. Rev. Clin. Oncol. 2024;21:294–311. doi: 10.1038/s41571-024-00868-0. - DOI - PMC - PubMed
    1. Yang X., Yang C., Zhang S., Geng H., Zhu A.X., Bernards R., Qin W., Fan J., Wang C., Gao Q. Precision treatment in advanced hepatocellular carcinoma. Cancer. Cell. 2024;42:180–197. doi: 10.1016/j.ccell.2024.01.007. - DOI - PubMed
    1. Hou J., Zhang H., Sun B., Karin M. The immunobiology of hepatocellular carcinoma in humans and mice: Basic concepts and therapeutic implications. J. Hepatol. 2020;72:167–182. doi: 10.1016/j.jhep.2019.08.014. - DOI - PubMed
    1. Chen J., Gingold J.A., Su X. Immunomodulatory TGF-β Signaling in Hepatocellular Carcinoma. Trends Mol. Med. 2019;25:1010–1023. doi: 10.1016/j.molmed.2019.06.007. - DOI - PubMed

MeSH terms

Substances