

Mapping the global prevalence, incidence, and mortality of Plasmodium falciparum and Plasmodium vivax malaria, 2000-22: a spatial and temporal modelling study
- PMID: 40056919
- PMCID: PMC11928297
- DOI: 10.1016/S0140-6736(25)00038-8
Mapping the global prevalence, incidence, and mortality of Plasmodium falciparum and Plasmodium vivax malaria, 2000-22: a spatial and temporal modelling study
Abstract
Background: Malaria remains a leading cause of illness and death globally, with countries in sub-Saharan Africa bearing a disproportionate burden. Global high-resolution maps of malaria prevalence, incidence, and mortality are crucial for tracking spatially heterogeneous progress against the disease and to inform strategic malaria control efforts. We present the latest such maps, the first since 2019, which cover the years 2000-22. The maps are accompanied by administrative-level summaries and include estimated COVID-19 pandemic-related impacts on malaria burden.
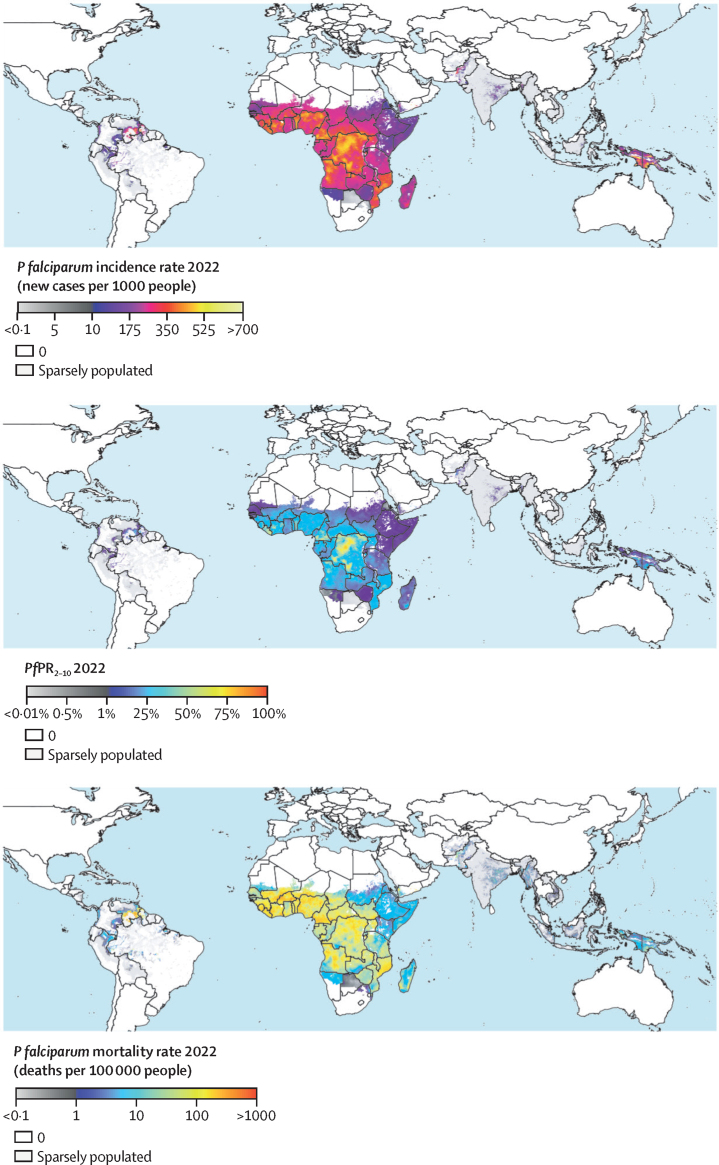
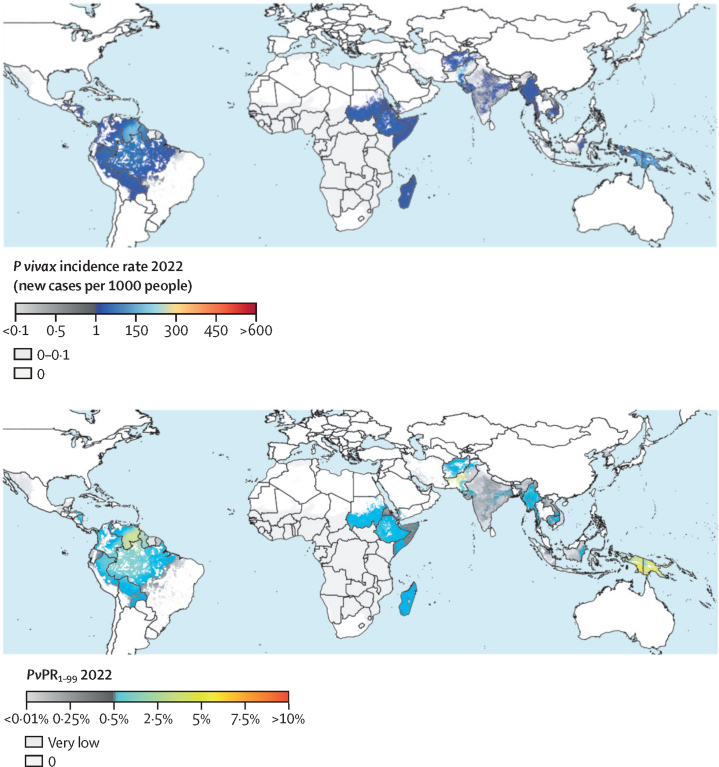
Methods: We initially modelled prevalence of Plasmodium falciparum malaria infection in children aged 2-10 years in high-burden African countries using a geostatistical modelling framework. The model was trained on a large database of spatiotemporal observations of community infection prevalence; environmental and anthropogenic covariates; and modelled intervention coverages for insecticide-treated bednets, indoor residual spraying, and effective treatment with an antimalarial drug. We developed an additional model to incorporate disruptions to malaria case management caused by the COVID-19 pandemic. The resulting high-resolution maps of infection prevalence from 2000 to 2022 were subsequently translated to estimates of case incidence and malaria mortality. For other malaria-endemic countries and for Plasmodium vivax estimates, we used routine surveillance data to model annual case incidence at administrative levels. We then converted these estimates to infection prevalence and malaria mortality, and spatially disaggregated administrative-level results to produce high-resolution maps. Lastly, we combined the modelled outputs to produce global maps and summarised tables that are suitable for assessing changing malaria burden from subnational to global scales.
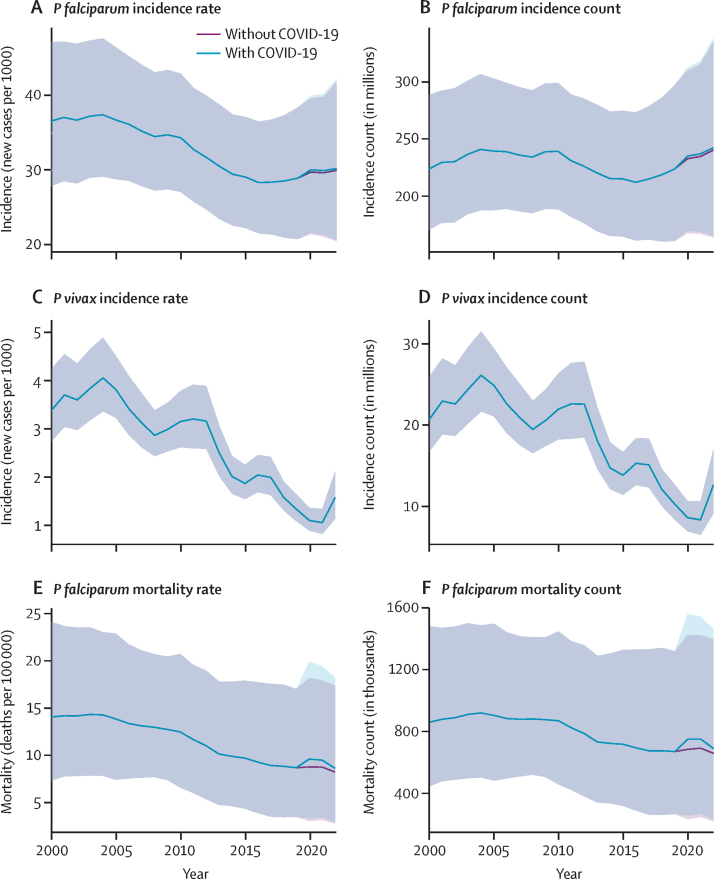
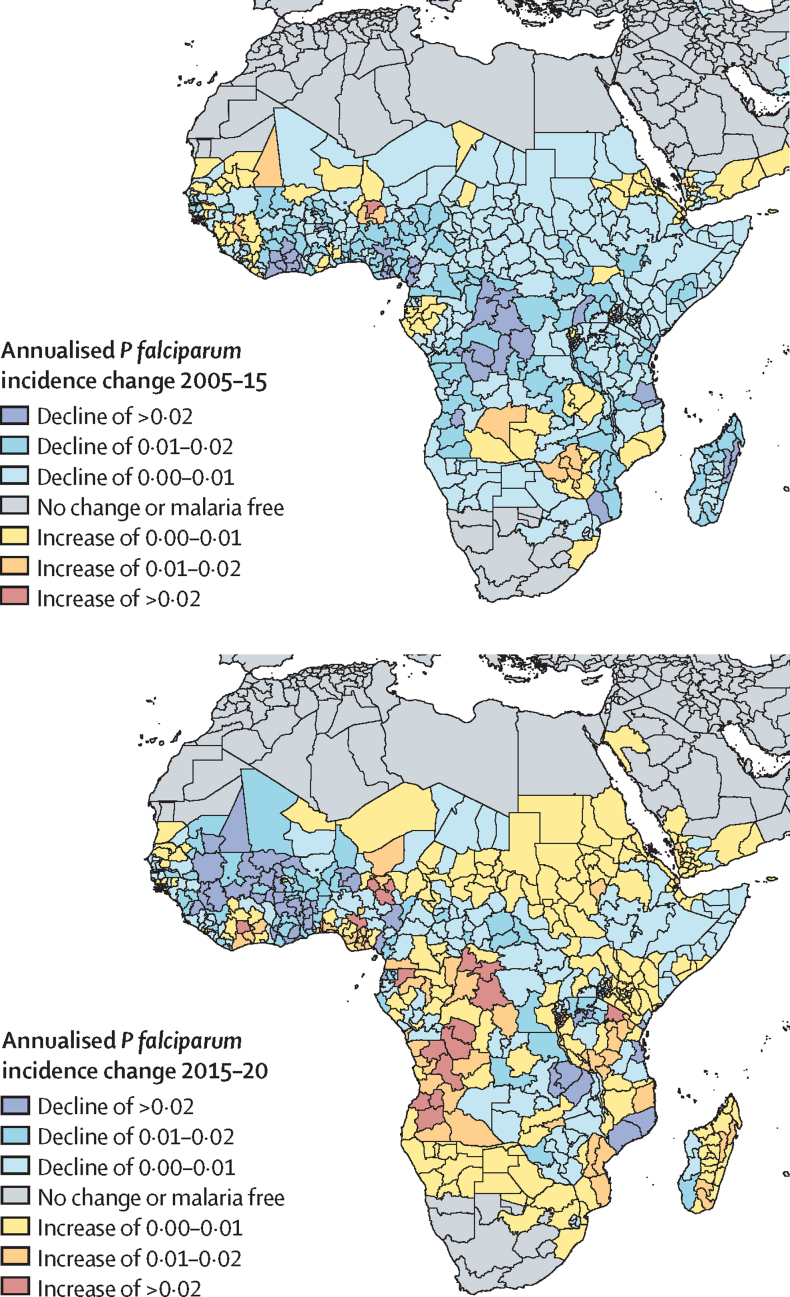
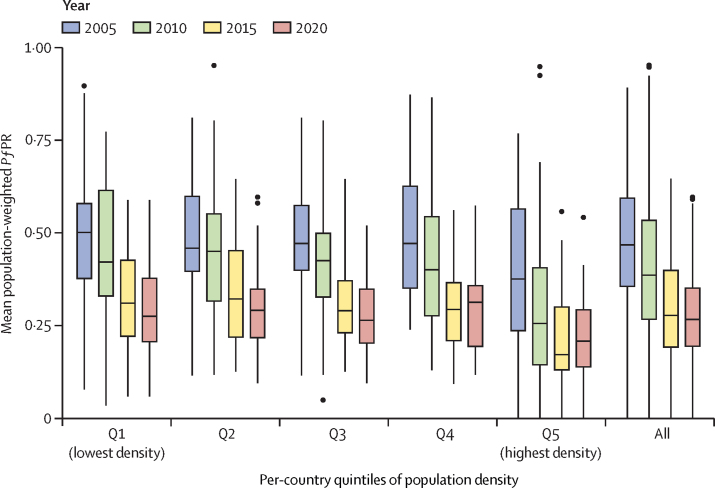
Findings: We found an ongoing plateau in rates of malaria infection prevalence and case incidence within sub-Saharan Africa, with consistent year-on-year improvements not evident since 2015. Due to the concentration of malaria burden in sub-Saharan Africa and the region's rapid population growth relative to other endemic regions, we estimate that 2022 had 234·8 (95% uncertainty interval 179·2-299·0) million clinical cases of P falciparum malaria, the most since 2004. Despite these findings, deaths from malaria continued to decline in sub-Saharan Africa and consequently globally after 2015, except for the COVID-19-impacted years of 2020-22. Similarly, progress in reducing P falciparum and P vivax morbidity outside Africa continued despite stalled progress globally. However, a major malaria outbreak in Pakistan following intense flooding in 2022 resulted in a reversal in this improving trend and contributed heavily to the global total of 12·4 (10·7-14·8) million clinical cases of P vivax malaria. Within Africa, we found that the plateau in infection prevalence occurred earlier in more densely populated areas, whereas more sparsely populated regions have continued a trajectory of modest improvement.
Interpretation: The unprecedented investment in malaria control since the early 2000s has averted an enormous amount of malaria burden. However, case incidence rates in Africa have flattened, and with a rapidly growing population at risk, the number of P falciparum cases in Africa, and thus globally, is now comparable to levels before the surge of investment. Outside Africa progress against malaria morbidity continued after 2015, but a resurgence of P vivax cases in 2022 underscores the fragility of progress against malaria in the face of climatic shocks. COVID-19-related disruptions led to increased malaria cases and deaths, but the impact was less severe than feared, in part because endemic countries continued to prioritise malaria control during the pandemic. Nevertheless, improved tools and strategies remain urgently needed to regain momentum against this disease.
Funding: Bill & Melinda Gates Foundation and Australian National Health and Medical Research Council.
Copyright © 2025 The Author(s). Published by Elsevier Ltd. This is an Open Access article under the CC BY 4.0 license. Published by Elsevier Ltd.. All rights reserved.
Conflict of interest statement
Declaration of interests We declare no competing interests.
Figures
Comment in
-
Mapping the malaria burden in the context of a global pandemic: progress, hiccups, and challenges.Lancet. 2025 Mar 22;405(10483):952-953. doi: 10.1016/S0140-6736(25)00418-0. Epub 2025 Mar 5. Lancet. 2025. PMID: 40056921 No abstract available.
References
-
- WHO . The potential impact of health service disruptions on the burden of malaria: a modelling analysis for countries in sub-Saharan Africa. World Health Organization; 2020.
-
- WHO . World malaria report 2020: 20 years of global progress and challenges. World Health Organization; 2020.
Publication types
MeSH terms
LinkOut - more resources
Full Text Sources
