. 2025 Mar 8;16(1):2325.
doi: 10.1038/s41467-025-57671-3.

An atlas of RNA-dependent proteins in cell division reveals the riboregulation of mitotic protein-protein interactions

Affiliations

An atlas of RNA-dependent proteins in cell division reveals the riboregulation of mitotic protein-protein interactions

Varshni Rajagopal et al. Nat Commun. .

Abstract

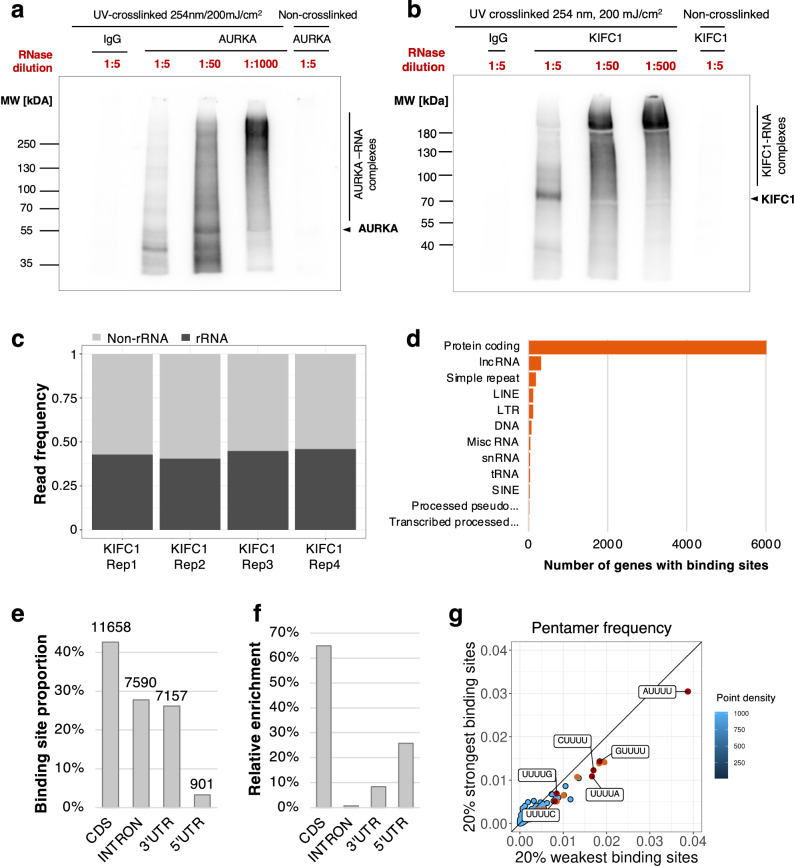
Ribonucleoprotein complexes are dynamic assemblies of RNA with RNA-binding proteins, which modulate the fate of RNA. Inversely, RNA riboregulates the interactions and functions of the associated proteins. Dysregulation of ribonucleoprotein functions is linked to diseases such as cancer and neurological disorders. In dividing cells, RNA and RNA-binding proteins are present in mitotic structures, but their impact on cell division remains unclear. By applying the proteome-wide R-DeeP strategy to cells synchronized in mitosis versus interphase integrated with the RBP2GO knowledge, we provided an atlas of RNA-dependent proteins in cell division, accessible at R-DeeP3.dkfz.de. We uncovered AURKA, KIFC1 and TPX2 as unconventional RNA-binding proteins. KIFC1 was identified as a new substrate of AURKA, and new TPX2-interacting protein. Their pair-wise interactions were RNA dependent. In addition, RNA stimulated AURKA kinase activity and stabilized its conformation. In this work, we highlighted riboregulation of major mitotic factors as an additional complexity level of cell division.


Conflict of interest statement

Competing interests: The authors declare the following competing interests: S.D. is co-owner of siTOOLs Biotech, Martinsried, Germany, without relation to this work. This study is part of the PhD thesis of V.R. The other authors declare no competing interests.

Figures

Fig. 1
Fig. 1. R-DeeP in HeLa mitotic and interphasic cells.
a HeLa mitotic or interphasic untreated (control) or RNase-treated cell lysates were prepared and loaded onto sucrose density gradients (5–50%). Following ultracentrifugation, the gradients were fractionated into 25 fractions and subjected to either mass spectrometry (proteome-wide screen) or Western blot analysis (individual protein analysis) for validation of the screens (N = 3 in total). Adapted from. b Venn diagram indicating the total number of proteins identified in each R-DeeP screen (mitosis: 7152 and interphase: 7069). 6059 proteins were commonly identified. c Each graph (mitosis and interphase, respectively) indicates the position of maxima for each shift in the control and RNase-treated gradients according to the mean of three replicates. The inset bar graph shows the number of proteins in each sub-category (left shift: blue, right shift: red, no shift: gray and precipitated proteins: orange). Source data for graphs are provided as Source Data files (see Data availability). Code for mass spectrometry analysis is available online (see Code availability).
Fig. 2
Fig. 2. Differential analysis of R-DeeP in HeLa mitotic and interphasic cells.
a Schematic representation of the differential protein levels of the common left-shifting proteins in mitotic and interphasic R-DeeP screens in HeLa cells. While 736 proteins depicted equal expression levels in both cell cycle phases, 160 proteins were higher expressed in mitosis and 52 proteins were preferentially expressed in interphase and thus showed differential expression in a cell cycle dependent manner. b Table depicting differential shifting behavior of the 6059 common proteins in mitosis as compared to interphase. While 1100 proteins presented a significant shift in both phases, we detected 726 proteins with interphase specific shifts and 586 mitotic proteins with specific shifts. 3647 proteins did not present RNA dependence. Within the 1100 proteins commonly shifting, most of the proteins were left shifted. There were also 136 proteins shifting in opposite directions. c Bar plot indicating the details of the mitotic- and interphase-shifting proteins. The number of proteins which were shifting only in one cell cycle phase are indicated in the “differential” shift categories. (438 + 148 = 586 in mitosis and 670 + 56 = 726 in interphase). The number of proteins which were detected only in one cell cycle phase are indicated in the mitotic left/right shift category (51/14) and interphase left/right shift category (81/5), respectively. d Upset plot showing the intersection between the three R-DeeP screens: “R-DeeP unsync” in unsynchronized HeLa cells, and the two new “R-DeeP interphase” and “R-DeeP mitosis” datasets. e Venn diagram depicting the intersection (number of detected proteins) between the unsynchronized R-DeeP screen in HeLa cells (R-DeeP unsync) and the new mitotic R-DeeP screen. The newly detected left-shifted proteins are indicated below. The results of the R-DeeP analysis with the shifting/non-shifting proteins are available as Supplementary Data 1.
Fig. 3
Fig. 3. An atlas of RNA-dependent proteins in cell division.
a Schematic representation of a mitotic spindle showing the localization of RNA-dependent proteins to mitotic structures, based on their association with the respective GO terms as indicated. Data from the 43 proteome-wide human RBP screens as compiled in the RBP2GO database were used for this analysis. The numbers indicate the number of proteins in each group. In total, 826 mitosis-related proteins (out of 1472 proteins) depict an RNA dependence in mitosis. The complete dataset can be consulted in Supplementary Data 2. b Same as in a for mitotic proteins involved in different cell cycle transitions and related to the mitotic cell cycle. The complete mitotic R-DeeP profile of the proteins is available within the R-DeeP3 database (R-DeeP3.dkfz.de).
Fig. 4
Fig. 4. AURKA is an RNA-dependent protein in mitosis.
a Graphical representation of the protein amount in 25 different fractions of control (green) and RNase-treated (red) sucrose density gradients analyzed by mass spectrometry. Raw data (mean of three replicates) are depicted by line with markers. Smooth lines represent the respective Gaussian fit. The overall protein amount of the raw data was normalized to 100. b Graph showing the quantitative analysis of Western blot replicates depicted by the mean of three replicates with standard error of the mean (SEM, N = 3). c Western blot representing the distribution of AURKA (46 kDa) in 25 different fractions in control and RNase-treated mitotic gradients. One replicate out of three biological replicates is shown. Source data for graphs and blots are provided as Source Data files.
Fig. 5
Fig. 5. RNA-dependent protein interactors of AURKA.
a Pie chart showing the percentage of AURKA protein interactors that are RNA dependent (dark orange) or RNA independent (dark blue), according to RBP2GO and our new mitotic R-DeeP screen, and identified by AURKA pulldown and mass spectrometry analysis in HeLa cells synchronized in mitosis (N = 3). See also Supplementary Data 3. b Schematic representation of AURKA interactors which are RNase-sensitive mitotic factors, RNA-dependent according to the mitotic R-DeeP screen and co-migrating around the control fraction 21 together with AURKA. See also Supplementary Data 3. c, d R-DeeP profile of KIFC1 (74 kDa) and TPX2 (86 kDa) respectively showing their RNA dependence in mitosis and Western blot validation as for AURKA (see Fig. 4). Top: graphical representation of the protein amount in 25 different fractions of control (green) and RNase-treated (red) sucrose density gradients analyzed by mass spectrometry. Raw data (mean of three replicates) are depicted by line with markers. Smooth lines represent the respective Gaussian fit. The overall protein amount of the raw data was normalized to 100. Bottom: graph showing the quantitative analysis of Western blot replicates depicted by the mean of three replicates with standard error of the mean (SEM, N = 3). e Western blot analysis showing the immunoprecipitation of AURKA in mitotic HeLa cells. AURKA pulldown was performed in mitotic lysate treated in presence or absence of RNase I. Rabbit IgG was used as a negative control. KIFC1 (74 kDa) and TPX2 (86 kDa) were pulled down with AURKA (46 kDa) in control samples whereas their interaction was significantly reduced upon RNase treatment (reduction of the band intensity for KIFC1 and TPX2 in the last lane). f Graph representing quantification of the amount of KIFC1 and TPX2 present in IgG and AURKA pulldown samples treated or not with RNase I. The intensity of the bands as in e were quantified and represented in the bar graph with SEM (three biological replicates). P-values were evaluated using a two-tailed, paired t-test (**P-value < 0.01, ***P-value < 0.001). Source data for graphs and blots are provided as Source Data files.
Fig. 6
Fig. 6. RNA dependence of the identified interaction between AURKA and KIFC1.
a Representative proximity ligation assay (PLA) images indicating the close proximity of AURKA and KIFC1 in HeLa cells across the cell cycle (interphase to telophase as indicated, N = 3 with 10 images each). The interaction is represented by dots (PLA channel, red dots in the merge channel), AURKA was stained per immunofluorescence (green) and DNA was stained using DAPI (blue). Individual antibody controls of the PLA assay are shown in Supplementary Fig. 6. Scale bar, 10 µm. b, d Representative images showing the PLA assay of AURKA and KIFC1 in HeLa cells at prometaphase and metaphase, respectively (PLA channel, red dots in the merge channel). AURKA is seen in green (immunostaining) and DNA was stained using DAPI (blue). The top images depict representative images in control cells. Bottom images depict representative images in RNase-treated cells. Scale bar, 10 µm. c and e Quantification of the PLA signal (as shown in b and d) for the PLA of AURKA and KIFC1 in HeLa prometaphase and metaphase cells in absence (-RNase) or presence (+RNase) of RNase treatment, as well as in the individual antibody control PLA assays (see Supplementary Fig. 6). The signal intensities in each sample was normalized to the signal intensity of the -RNase sample. The error bars indicate the SEM (for three biological replicates of 10 images each). The P-values were calculated using a two-tailed, unpaired t-test (*P-value < 0.05, **P-value < 0.01). Source data for raw images and graphs are provided as Source Data files.
Fig. 7
Fig. 7. Analysis of the RNA mediating the interaction of AURKA, KIFC1 and TPX2.
a, b Autoradiography indicating the direct binding of AURKA and KIFC1, respectively, to RNA by iCLIP indicated by shifting of the radioactive RNA signal towards higher molecular weights with decreasing RNase I concentrations in HeLa prometaphase cells. The non-crosslinked sample is used as a control for UV-crosslinking which indicates the absence of RNA signal due to the lack of covalent bond between the protein and RNA (one representative image out of N = 3 biological replicates is shown for each protein). The results of the corresponding IP showing the protein amounts are shown in Supplementary Figs. 9 and 12. c Bar plot depicting the ribosomal RNA (rRNA) and non-ribosomal RNA (non-rRNA) read frequencies in individual KIFC1 iCLIP-Seq replicates in HeLa prometaphase cells. The amount of rRNA reads was determines in the sequencing libraries, before removal of unmapped reads using an alignment to rRNA sequences. d Horizontal bar plot showing the KIFC1 target non-rRNA gene spectrum with number of genes identified in iCLIP in HeLa prometaphase cells in decreasing order. The genes are classified as protein coding, lncRNA, simple repeat, LINE, LTR, DNA, Misc RNA, snRNA, tRNA, SINE, processed pseudogene and transcribed processed pseudogene. e Bar plot representing the proportion of binding sites in the respective transcript regions of protein coding genes. The number of regions is indicated at the top of each bar. f Bar plot representing the relative enrichment per region, that is, number of binding sites normalized by the summed length of respective bound transcript regions. g Scatter plot comparing the pentamer frequency within the 7-nt binding sites in the 20% strong binding sites vs. 20% weakest binding sites as defined by the PureCLIP score. The pentamers with the most extreme frequencies are colored in orange and red and contain U-stretches. These do not appear enriched in the strong binding sites. Source data for blots and code for the analysis are provided as Source Data files.
Fig. 8
Fig. 8. The kinase activity of AURKA is RNA dependent.
a Autoradiography indicating the phosphorylation intensity of KIFC1 in wild-type (WT) and non-phosphorylatable KIFC1 mutants in the presence of purified AURKA WT or AURKA kinase-dead mutant (D274A). One representative image is shown (N = 3). b Quantification of the autoradiography image (as in a), representing the KIFC1 phosphorylation signal in the form of a bar graph with SEM (N = 3). The phosphorylation signal was normalized to the KIFC1 WT signal. P-values were calculated using two-tailed, paired t-test (**P-value < 0.01). c Autoradiography indicating the phosphorylation of KIFC1 by AURKA (lane 3) and the substantial increase of the phosphorylation signal in the presence of total RNA (lane 4). KIFC1 WT protein with or without RNA and AURKA kinase-dead mutant (D274A) were used as negative control (lanes 1, 2 and 5). One representative image is shown (N = 3). d Autoradiography indicating the phosphorylation of TPX2 by AURKA and the increase in the phosphorylation signal in the presence of total RNA. Same as in c (N = 3). e Autoradiography indicating the autophosphorylation of AURKA and the increase in the autophosphorylation signal in the presence of total RNA. AURKA kinase-dead mutant (D274A) was used as a negative control (N = 3). f Graph showing the stabilization of AURKA upon addition of total RNA as indicated by a shift towards higher temperatures of AURKA melting temperature Tm (light green and purple curves). Protein unfolding upon exposition to an increasing temperature gradient was monitored by analyzing the fluorescence emission intensities at 350 nm and 330 nm (the first derivative of the ratio F350/F330 is shown). AURKA alone and AURKA in presence of RNA in high-salt conditions (gray dotted curves, dark green and dark purple curves) had similar Tm (around 44 °C). Two different total RNA preparations were tested (RNA1 and RNA2) resulting in an increased Tm (around 51 °C). No changes in ratio were observed with RNA alone in low-salt conditions (blue curves). HS high salt, 750 mM NaCl, PBS phosphate-buffered saline, 137 mM NaCl, LS low salt, 10 mM NaCl. Source data for blots and graphs are provided as Source Data files.

Update of

References

    1. Dreyfuss, G., Kim, V. N. & Kataoka, N. Messenger-RNA-binding proteins and the messages they carry. Nat. Rev. Mol. Cell Biol.3, 195–205 (2002). - PubMed
    1. Mitchell, S. F. & Parker, R. Principles and properties of eukaryotic mRNPs. Mol. Cell54, 547–558 (2014). - PubMed
    1. Gebauer, F., Schwarzl, T., Valcarcel, J. & Hentze, M. W. RNA-binding proteins in human genetic disease. Nat. Rev. Genet.22, 185–198 (2021). - PubMed
    1. Mayr, C. Regulation by 3’-Untranslated Regions. Annu. Rev. Genet.51, 171–194 (2017). - PubMed
    1. Hentze, M. W., Castello, A., Schwarzl, T. & Preiss, T. A brave new world of RNA-binding proteins. Nat. Rev. Mol. Cell Biol.19, 327–341 (2018). - PubMed

LinkOut - more resources