. 2025 Mar 8;16(1):2324.
doi: 10.1038/s41467-025-57297-5.

Uncovering the rewired IAP-JAK regulatory axis as an immune-dependent vulnerability of LKB1-mutant lung cancer

Affiliations

Uncovering the rewired IAP-JAK regulatory axis as an immune-dependent vulnerability of LKB1-mutant lung cancer

Changfa Shu et al. Nat Commun. .

Abstract

Harnessing the power of immune system to treat cancer has become a core clinical approach. However, rewiring of intrinsic circuitry by genomic alterations enables tumor cells to escape immune surveillance, leading to therapeutic failure. Uncovering the molecular basis of how tumor mutations induce therapeutic resistance may guide the development of intervention approaches to advance precision immunotherapy. Here we report the identification of the Liver Kinase B1 (LKB1)-Inhibitor of Apoptosis Protein (IAP)- Janus Kinase 1 (JAK1) dynamic complex as a molecular determinant for immune response of LKB1-mut lung cancer cells. LKB1 alteration exposes a critical dependency of lung cancer cells on IAP for their immune resistance. Indeed, pharmacological inhibition of IAP re-establishes JAK1-regulated Stimulator of interferon genes (STING) expression and DNA sensing signaling, enhances cytotoxic immune cell infiltration, and augmentes immune-dependent anti-tumor activity in an LKB1-mutant immune-competent mouse model. Thus, IAP-JAK1-targeted strategies, like IAP inhibitors, may offer a promising therapeutic approach to restore the responsiveness of immunologically-cold LKB1-mutant tumors to immune checkpoint inhibitors or STING-directed therapies.


Conflict of interest statement

Competing interests: The authors declare no competing interests.

Figures

Fig. 1
Fig. 1. Onco-Immune PPI profiling reveals the rewired LKB1-cIAP1 axis.
A Scatter plot showing the identification of LKB1-interacting immune-regulatory protein binding partners. B Immunoblot showing GST-PD confirmation of LKB1-cIAP1 PPI. Cell lysate from HEK293T cells co-expressing GST-cIAP1, cIAP2, or XIAP, VF-tagged LKB1 were subjected to the GST-PD as indicated. C Immunoblot showing endogenous interaction of LKB1-cIAP1 with the co-IP assay in H1299 cells. D Schematic illustration of the design of cIAP1 domain truncations. E, F Immunoblot showing mapping of LKB1-binding domain on cIAP1. Cell lysate from HEK293T cells co-expressing GST-LKB1 and VF-tagged cIAP1 full-length (FL), N-terminal truncation (N), C-terminal truncation (C) or BIR domain truncations (B1, B2 and B3) were subjected to the GST-PD as indicated. G Immunoblot showing the mapping of cIAP1-binding domain on LKB1. Cell lysate from HEK293T cells co-expressing GST-cIAP1 and VF-tagged LKB1 N-terminal truncation (NT,), kinase domain N-lobe truncation (NL), kinase domain C-lobe truncation (CL), and C-terminal truncation (CT) were subjected to the GST-PD as indicated. H Immunoblot showing the LKB1 kinase-dependency of LKB1-cIAP1 PPI. Cell lysate from HEK293T cells co-expressing GST-cIAP1 and VF-tagged LKB1 WT or K78I kinase-dead mutant were subjected to the GST-PD as indicated. Before collecting lysate, cells were serum-starved for overnight. I Schematic illustration of the LKB1 domain structures and mutations (upper) and a bar graph showing the PPI signal between cIAP1 and LKB1 WT or patient-derived mutants from TR-FRET assay (lower). The PPI signal was expressed as fold-of-change of the TR-FRET signal over the empty vector control (-) and presented as mean±SD from n = 4 independent experiments. P-values were calculated by unpaired Student’s t-test with two-tailed analysis without adjustments comparing with control. J Representative immunoblot showing PPI signal between cIAP1 and LKB1 WT or naturally occurring mutant. Cell lysate from HEK293T cells co-expressing GST-cIAP1 and VF-tagged LKB1 WT or mutant as indicated were subjected to the GST-pulldown assay. Source data are provided as a Source Data file. For (B, C, EH, and J), data are presented as one representative blot of n = 3 independent experiments.
Fig. 2
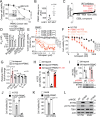
Fig. 2. Discovery of IAP inhibitors as immune response sensitizers in LKB1-mut lung cancer and identification of IAP-STING axis as downstream effectors of LKB1-cIAP1 PPI.
A Dose-response curve showing cell viability of isogenic LKB1-WT or KD H1792 cells co-cultured with PBMC. B AUC analysis of PBMC-dose dependent killing curves of lung cancer cells with LKB1-WT (Calu-1, H1299, H1792, and H292) or MUT (A549, H1792, H23 and H460). Each dot represents an individual cell line, and the data were presented as mean ± SD. C Selectivity of compounds in the immune cell-dependent killing of H1755 from the primary screening. D IC50s of six IAP inhibitors in H1755 cancer cell alone culture versus co-culture with PBMC. E Dose-response confirmation of birinapant-induced immune-dependent killing in additional LKB1-mut LUAD cell lines as indicated. F Dose-response curves of birinapant-induced CD8+ T and CD56+ NK cell-dependent killing in H1755 cell. G STING gene expression in H1755 cells cultured alone or co-cultured with immune cells. The relative mRNA expression was expressed as fold-of-change upon birinapant (50 nM) treatment over normalized DMSO control. H The vialibity of H1755 cells cultured alone or co-cultured with PBMC, or treated with birinapant (100 nM) or in combination with H151 (5 μM). I The cell viability of isogenic H1755 cells expressing non-targeting control (ctrl) shRNA or STING-targeting (STING) shRNA cultured alone or co-cultured with PBMC, or treated with birinapant (100 nM) as indicated. Immunoblot (lower) showing birinapant-induced STING expression in control H1755 cells, but not STING knockdown isogenic cells. J, K Cell viability of stable isogenic H1755 (J) and A549 (K) cells overexpressing STING cultured alone or co-cultured with PBMC. L Immunoblot showing indicated proteins of stable isogenic H1755 and A549 cells overexpressing STING by lentiviral transduction using a pHAGE-STING plasmid. One representative blot from n = 3 independent experiments. Source data are provided as a Source Data file. For (A, B) and (DG), data are presented as mean ± SD from n = 3 independent experiments; For H-K, data are presented as mean ± SD from n = 4 independent experiments. P-values were calculated by unpaired Student’s t-test with two-tailed analysis without adjustments.
Fig. 3
Fig. 3. IAP inhibitors synergize with IFNγ to induce STING expression in LKB1-mut cells.
A DEGs in H1755 cell treated with birinapant (50 nM) in cancer cells alone culture or co-cultured with PBMC (n = 3 technical replicates). B Gene ontology analysis showing DEGs-associated top-enriched pathways. C, D STING mRNA (C) and proteins expression (D) in A549 cells upon birinapant (500 nM) treatment without (-) or with (+) IFNγ (1 ng/mL) for 24 h. E, F STING mRNA (E) and protein expression (F) in A549 cells upon treatment with IAP inhibitors (500 nM) or in combination with IFNγ (1 ng/mL) for 24 h. G STING expression in A549 STING-HiBiT cells treated with IAP inhibitors (500 nM) or in combination with IFNγ (1 ng/mL) for 24 h (n = 4 independent experiments). H Dose-response curve of birinapant-induced STING expression in A549 STING-HiBiT cells in the presence of 1 ng/mL IFNγ. I STING expression in isogenic cIAP1 knockdown A549 cells treated with 1 ng/mL IFNγ for 24 h. J, K STING protein (J) and mRNA (K) expression in A549 cells treated with birinapant (500 nM) and IFNγ (1 ng/mL) in combination with JAK inhibitors, oclacitinib (Ocla, 10 μM) and tofacitinib (Tofa, 10 μM), or RIPK inhibitor, necrostatin-1 (Nec-1, 10 μM). L STING-HiBiT signal in genetically engineered A549 cells treated with birinapant (500 nM) and IFNγ (1 ng/mL) in combination with Ocla(10 μM) and Tofa (10 μM) (n = 4 independent experiments). M, N STING expression in isogenic JAK1 (M) or STAT1 (N) knockdown (KD) A549 cells treated with birinapant (500 nM) and 1 ng/mL IFNγ for 24 h. O Viability of H1755 cells in cancer cell alone culture or co-culture with PBMC in combination with Ocla(10 μM) and Tofa (10 μM). Source data are provided as a Source Data file. For (C, E, H, K, and O), data are presented as mean ± SD of n = 3 independent experiments. For (D, F, I, J and M, N), data are presented as one representative blot of n = 3 independent experiments. P-values were calculated by unpaired Student’s t-test with two-tailed analysis without adjustments.
Fig. 4
Fig. 4. IAP inhibitors synergize with IFNγ to induce STING-mediated DNA sensing pathway activation in LKB1-mut cells.
A Immunoblot showing indicated proteins in A549 cells treated with birinapant (500 nM) and/or IFNγ (1 ng/mL) for 24 h as indicated. BD Bar graphs showing birinapant and IFNγ combination-induced expression of IFNβ (B), CXCL10 (C), and CCL5 (D) by qPCR in A549 cells treated with birinapant (500 nM) and/or IFNγ (1 ng/mL) for 24 h as indicated (n = 3 independent experiments). E Immunoblot showing indicated proteins in A549 cells treated with poly(dA:dT) (1 μg/mL) for 4 h in the presence or absence of 24 h pre-treatment with birinapant (500 nM) and IFNγ (1 ng/mL) combination. FH Bar graphs showing poly(dA:dT)-induced expression of IFNβ (F), CXCL10 (G) and CCL5 (H) by qPCR in A549 cells treated with poly(dA:dT) (1 μg/mL) for 4 h in the presence or absence of 24 h pre-treatment with birinapant (500 nM) and IFNγ (1 ng/mL) combination (n = 3 independent experiments). I Immunoblot showing indicated proteins in A549 cells treated with poly(dA:dT) (1 μg/mL) for 4 h in the presence of 24 h pre-treatment of birinapant (500 nM) plus IFNγ (1 ng/mL) in combination with Ocla (10 μM), Tofa (10 μM), or H151 (5 μM) as indicated. JL Bar graphs showing JAK- and STING-dependency of birinapant-induced expression of IFNβ (J), CXCL10 (K), and CCL5 (L) by qPCR in A549 cells treated with poly(dA:dT) (1 μg/mL) for 4 h in the presence of 24 h pre-treatment of birinapant (500 nM) plus IFNγ (1 ng/mL) in combination with Ocla (10 μM), Tofa (10 μM) or H151 (5 μM) (n = 3 independent experiments). Source data are provided as a Source Data file. For (A, E, and I), data are presented as one representative blot of n = 3 independent experiments. For (BD, FH, and JL), data are presented as mean values ± SD. P-values were calculated by unpaired Student’s t test with two-tailed analysis without adjustments.
Fig. 5
Fig. 5. Birinapant induces STING-mediated apoptosis of LKB1-mut cancer cells and chemotaxis of immune cells in vitro.
A Time-dependent curve of apoptotic cell counts of A549 cells treated with birinapant (500 nM), IFNγ (1 ng/mL) or in combination. (n = 3 independent biological replicates using different passages of A549 cells). B Representative images showing apoptotic A549 cells treated with birinapant (500 nM), IFNγ (1 ng/mL), or in combination. Scale bar: 100 μm. C Bar graph showing birinapant-induced STING-mediated cancer cell apoptosis. A549 cells were treated with birinapant (500 nM), IFNγ (1 ng/mL), H151 (5 μM,) or in combination as indicated for 72 h. (n = 4 independent experiments). D Representative images showing apoptotic A549 cells treated with birinapant (500 nM), IFNγ (1 ng/mL), H151 (5 μM), or in combination as indicated for 72 h. Scale bar: 100 μm. E Schematic illustration of transwell assays for measuring immune cell infiltration in vitro. F Representative images showing birinapant-induced Jurkat T cells migration. A549 cells (red) and Jurkat T cells (green) were co-cultured in transwell as shown in (E) and were treated with birinapant (100 nM), poly(dA:dT) (1 μg/mL), or in combination with H151 (5 μM), or JAK inhibitor (JAKi), tofacitinib (10 μM), for 48 h, labeled as the letters a-h. A549 was labeled with Nuclight Red fluorescence protein, and Jurkats were pre-labeled with CellTracker™ Green CMFDA Dye. IL2 and anti-CD3 antibody were used to activate Jurkat T cells. Scale bar: 200 μm. G Bar graph showing the quantification of infiltrated Jurkat T cells in transwell-based migration assays. The letters a-h in lowcase were corresponding to the conditions of F (n = 3 independent experiments). Source data are provided as a Source Data file. For (A, C, and G), data are presented as mean ± SD. P-values were calculated by unpaired Student’s t test with two-tailed analysis without adjustments.
Fig. 6
Fig. 6. Birinapant exhibits immune-dependent anti-tumor activity in vivo in a LKB1-mut syngeneic allograft mouse model.
A Schematics of mouse study design. B, C Time course of tumor volume change in immune-competent mice (B, n = 6 mice per group) and immune-deficient nude mice (C, n = 5 mice per group) treated with vehicle control or birinapant (10 mg/kg) as indicated. The data are presented as mean ± SD of the entire experimental cohort. D Representative images from immunohistochemistry (IHC) staining showing 2-doses birinapant-induced increase of tumor infiltrated CD8+ T cells in vivo. Tumor samples were collected on Day 6 for the IHC staining analysis. Scale bar: 100 μm. E tSNE plots from single-cell mass cytometry (CyTOF) showing increased tumor infiltrated CD8+ T cells upon 2-doses birinapant treatment in vivo. (F) Quantification of tumor-infiltrated CD8+ T cells from single-cell CyTOF profiling. The data are expressed as the percentage of CD8+ T cells in the live cell population. Each data point represents individual samples from immune-competent mice. (n = 5 mice for vehicle group, n = 7 mice for birinapant group). G Immunoblot showing birinapant-induced STING expression in vivo. Tumor samples harvested from the immune-competent mice at the endpoint were analyzed by SDS-PAGE and western blot with indicated antibodies. One representative blot of n = 3 biological replicates. Source data are provided as a Source Data file. For (B, C, and F), data are presented as mean values ± SD. P-values were calculated by unpaired Student’s t test with two-tailed analysis without adjustments.
Fig. 7
Fig. 7. Identification of the LKB1-cIAP1-JAK1 trimolecular complex in shaping IAP- and STING-dependency in LKB1-mut cells.
A TR-FRET PPI signal between cIAP1 and IFNγ-JAK-STAT pathway proteins. Data were presented as the average of n = 3 independent experiments. B GST-PD confirmation of cIAP1-JAK1 PPI in HEK293T cells. C Endogenous interaction of cIAP1-JAK1 with the co-IP assay in A549 cells. D, E Mapping of JAK1-binding domain on cIAP1 in HEK293T cells co-expressing GST-JAK1 with and VF-tagged cIAP1 full-length (FL), N-terminal truncation (N), C-terminal truncation (C) or BIR domain truncations (B1, B2 and B3). F Competitive binding between LKB1 and JAK1 with cIAP1. G, H Immunoblot showing indicated proteins (G) and qPCR showing JAK1 mRNA expression (H) (n = 3 independent experiments) in isogenic LKB1-KD H1299 cells treated with 1 ng/mL IFNγ or PBS for 1 h. I STAT-driven ISRE transcriptional activatity in HEK293T cells transfected with ISRE-luc reporter plasmid with (+) or without (−) LKB1-WT overexpression, and treated with 1 ng/mL IFNγ or PBS for 24 h (n = 4 independent experiments). J, K JAK1 protein (J) and mRNA expression (K) (n = 3 independent experiments) upon IAP inhibitor treatment in A549 cells treated with IAP inhibitors (500 nM) as indicated for 24 h. L JAK1 ubiquitination in A549 cells with 18 h birinapant (500 nM) followed by 6-hour MG132 (20 μM) treatment. M Immunoblot showing indicated proteins in A549 cells treated with IFNγ (1 ng/mL) or PBS for 1 h with (+) or without 24 h pretreatment of birinapant (500 nM). N, O IRF1 (N) and TAP1 (O) mRNA expression in A549 cells treated with birinapant (500 nM), IFNγ (1 ng/mL), or in combination for 24 h (n = 3 independent experiments). Source data are provided as a Source Data file. For (BG, J, and L, M), data are presented as one representative blot of n = 3 independent experiments. For (H, K, and N, O), data are presented as mean values ± SD. P-values were calculated by unpaired Student’s t test with two-tailed analysis without adjustments.

References

    1. Waldman, A. D., Fritz, J. M. & Lenardo, M. J. A guide to cancer immunotherapy: from T cell basic science to clinical practice. Nat. Rev. Immunol.20, 651–668 (2020). - PMC - PubMed
    1. Robert, C. A decade of immune-checkpoint inhibitors in cancer therapy. Nat. Commun.11, 3801 (2020). - PMC - PubMed
    1. Hellmann, M. D. et al. Nivolumab plus ipilimumab in advanced non-small-cell Lung Cancer. N. Engl. J. Med381, 2020–2031 (2019). - PubMed
    1. Hellmann, M. D. et al. Nivolumab plus ipilimumab in Lung Cancer with a high tumor mutational burden. N. Engl. J. Med.378, 2093–2104 (2018). - PMC - PubMed
    1. Aguiar, P. N. Jr. et al. Immune checkpoint inhibitors for advanced non-small cell lung cancer: emerging sequencing for new treatment targets. ESMO Open2, e000200 (2017). - PMC - PubMed

MeSH terms