. 2025 Mar 8;16(1):2340.
doi: 10.1038/s41467-025-57505-2.

Genome-wide profiling of highly similar paralogous genes using HiFi sequencing

Collaborators, Affiliations

Genome-wide profiling of highly similar paralogous genes using HiFi sequencing

Xiao Chen et al. Nat Commun. .

Abstract

Variant calling is hindered in segmental duplications by sequence homology. We developed Paraphase, a HiFi-based informatics method that resolves highly similar genes by phasing all haplotypes of paralogous genes together. We applied Paraphase to 160 long (>10 kb) segmental duplication regions across the human genome with high (>99%) sequence similarity, encoding 316 genes. Analysis across five ancestral populations revealed highly variable copy numbers of these regions. We identified 23 paralog groups with exceptionally low within-group diversity, where extensive gene conversion and unequal crossing over contribute to highly similar gene copies. Furthermore, our analysis of 36 trios identified 7 de novo SNVs and 4 de novo gene conversion events, 2 of which are non-allelic. Finally, we summarized extensive genetic diversity in 9 medically relevant genes previously considered challenging to genotype. Paraphase provides a framework for resolving gene paralogs, enabling accurate testing in medically relevant genes and population-wide studies of previously inaccessible genes.


Conflict of interest statement

Competing interests: X.C., D.B., Egor D., and M.A.E. are employees of PacBio. J.M.D., J.N., A.S.B., R.B., K.S.H., L.L., P.K. and S.N. are employees of GeneDx. The remaining authors declare no competing interests.

Figures

Fig. 1
Fig. 1. Paraphase design and the regions it analyzes.
a Paraphase extracts read (short horizontal lines) that align to a paralog group (gene: green, paralog: magenta), realigns to the archetype gene, and phases reads into haplotypes (long horizontal lines). Variant calling is performed on each haplotype. Copy number changes can be identified from the number of haplotypes, e.g. an extra haplotype in this example indicates a copy number gain in the paralog. b Comparison of summary MAPQs between HiFi and Illumina WGS data in 160 groups of paralogous regions analyzed by Paraphase, highlighting mapping difficulty in these challenging regions for both short and long reads.
Fig. 2
Fig. 2. Distribution of the total CN of each paralog group across populations.
One archetype gene is selected to represent the name of each group. a Paralog groups with high CN variability. For the two paralog groups (OPN1LW and XAGE1A) located on the X chromosome, only female samples are plotted. b False duplication regions in GRCh38, where more than 95% of individuals have a total CN of two.
Fig. 3
Fig. 3. Paralog groups with low within-group diversity.
a Haplotypes of the AMY1 paralog group in a sample, realigned to AMY1A, showing two copies each of AMY1A, AMY1B and AMY1C. Reads in blue are consistent with a single haplotype. Reads in gray are consistent with more than one possible haplotype, i.e. when two or more haplotypes are identical over a region. The ends of the haplotypes extend into downstream non-homologous regions so we can assign the haplotypes into the three genes. bd PCA of haplotype sequences of the AMY1A/AMY1B/AMY1C (b), BOLA2-SLX1B-SULT1A4/BOLA2B-SLX1A-SULT1A3 (three paralog groups in tandem and genotyped as one region by Paraphase) (c) and CTAG1A/CTAG1B (d). Each dot represents a haplotype in the population. Colors represent different genes in a paralog group as assigned according to the ending sequences of each haplotype (which extends into non-homologous regions). e Sequence divergence between haplotypes in cis vs. trans in three palindromic paralog groups. Within each boxplot, the center lines denote median values; boxes extend from the 25th to the 75th percentile of each group’s values; the whiskers extend from the box to the minimum (maximum) value that falls within 1.5 times the interquartile range below (above) the 25th (75th) percentile of each group; dots denote outlier values. One gene is selected to represent the name of each paralog group: CENPVL1 for CENPVL1/CENPVL2 (cis n = 93, trans n = 80), SSX2 for SSX2/SSX2B (cis n = 117, trans n = 163), SSX4 for SSX4/SSX4B (cis n = 275, trans n = 308).
Fig. 4
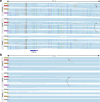
Fig. 4. De novo non-allelic gene conversion in a trio.
a Haplotypes are labeled in different colors in the proband, father, and mother, with matching colors indicating inherited haplotypes (haplotypes not inherited are labeled in gray in the parents). The black arrow denotes the SNV created by non-allelic gene conversion on haplotype 2 (labeled in red) of the proband. It is not present on the inherited haplotype, haplotype 2 (labeled in red) in the father. Instead, it is present on haplotype 4 (labeled in magenta) of the father, which belongs to the other gene in the paralog group. The curved arrow shows the direction of the gene conversion. b Close view of the converted variant.
Fig. 5
Fig. 5. Population results in CYP21A2, PMS2 and OPN1LW/OPN1MW.
a Paraphase resolved haplotypes in the RCCX module, realigned to the RCCX copy that encodes CYP21A2. Haplotypes of the same color (purple or green) are from the same allele. Longer haplotypes represent the last RCCX copies in the array on each allele, and shorter haplotypes represent remaining copies. Two examples are shown, including a sample with no CNV (top) and a sample with RCCX duplication (bottom), which carries an allele (purple) with a wild-type copy of CYP21A2 and another copy of CYP21A2 harboring a pathogenic variant Q319X (red arrow). b Frequency of the total RCCX CN per allele across populations. c Paraphase resolved haplotypes in PMS2/PMS2CL, realigned to PMS2. Exon numbers are labeled with respect to PMS2. Three examples are shown, including a sample with no gene conversion and two samples carrying alleles converted in Exon 12 or Exons 13-14 (conversions in PMS2 shown in black boxes and conversions in PMS2CL shown in red boxes). d Frequency of gene conversions between PMS2 and PMS2CL across populations in Exon 12 and Exons 13-14. e Paraphase resolved haplotypes in OPN1LW/OPN1MW, realigned to OPN1LW. Longer haplotypes represent the first copies of the repeat in the array on each allele, and shorter haplotypes represent remaining copies. The first two copies of the repeat on each allele are colored in green, and the blue color indicates gene copies beyond the second copy in the array, i.e. not expressed. OPN1LW and OPN1MW are assigned based on variants in Exon 5 (red arrows). Two examples are shown, including a normal allele with a copy of OPN1LW followed by a copy of OPN1MW (top) and an allele (deutan) with a copy of OPN1LW followed by a copy of OPN1LW (bottom, the third unexpressed copy marked in blue). f Distribution of the summed CN of OPN1LW and OPN1MW per allele across populations.

References

    1. The 1000 Genomes Project Consortium. A global reference for human genetic variation. Nature526, 68–74 (2015). - PMC - PubMed
    1. Bycroft, C. et al. The UK Biobank resource with deep phenotyping and genomic data. Nature562, 203–209 (2018). - PMC - PubMed
    1. Karczewski, K. J. et al. The mutational constraint spectrum quantified from variation in 141,456 humans. Nature581, 434–443 (2020). - PMC - PubMed
    1. Mandelker, D. et al. Navigating highly homologous genes in a molecular diagnostic setting: a resource for clinical next-generation sequencing. Genet. Med. J. Am. Coll. Med. Genet.18, 1282–1289 (2016). - PubMed
    1. Ebbert, M. T. W. et al. Systematic analysis of dark and camouflaged genes reveals disease-relevant genes hiding in plain sight. Genome Biol. 20, 97 (2019). - PMC - PubMed