. 2025 Mar 8;16(1):2329.
doi: 10.1038/s41467-025-57453-x.

Salmonella exploits LRRK2-dependent plasma membrane dynamics to invade host cells

Affiliations

Salmonella exploits LRRK2-dependent plasma membrane dynamics to invade host cells

Hongxian Zhu et al. Nat Commun. .

Abstract

Salmonella utilizes type 3 secreted effector proteins to induce plasma membrane (PM) perturbations during invasion of host cells1. The effectors drive mobilization of host membranes to generate cell surface ruffles, followed by invagination and scission of the PM to generate Salmonella-containing vacuoles (SCVs)2. Here, we show that LRRK2 kinase generates membrane reservoirs exploited by Salmonella during invasion. The reservoirs are tubular compartments associated with the PM under basal conditions and are formed through the phosphorylation of RAB10 GTPase by LRRK2. Mobilization of membrane reservoirs to generate invasion ruffles mediates delivery of phosphorylated RAB10 to invasion sites. Subsequently, RAB10 dephosphorylation is required for its inactivation by a bacterial GTPase activating protein and subsequent scission of the PM. RAB10 dephosphorylation is mediated by a TLR4/PIEZO1/TMEM16F-dependent pathway and is inhibited by hyperactive variants of LRRK2. Our findings reveal how Salmonella exploits LRRK2-dependent PM dynamics during invasion and provide new insight into how LRRK2 variants can protect against bacterial infection3,4.


Conflict of interest statement

Competing interests: The authors declare no competing interests.

Figures
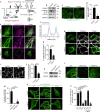
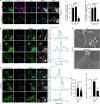
Fig. 1
Fig. 1. LRRK2 generates membrane reservoirs via RAB10 T73 phosphorylation.
a Current model of RAB10’s roles in STm invasion. b WT Henle 407 cells were treated with 50 nM MLi-2 for 90 min and cell lysates were immunoblotted with indicated antibodies. c and d Representative images (c) and quantifications (d) of RAB10+ tubules (visualized with anti-RAB10 antibody) in WT Henle 407 cells in control condition or treated with MLi-2 as in (b). e Representative images of Henle 407 cells transfected with GFP-RAB10 and stained for phospho-RAB10 (T73), with or without MLi-2 treatment. f Line plot profile of the white arrow in the inset (control) in e. Arb. units (arbitrary units) indicate the signal densities along the chosen white arrow. g and h Representative images (g) and quantifications (h) of RAB10+ membrane reservoirs in WT Henle 407 cells transfected with GFP-RAB10 and treated with MLi-2. Arrow indicates a RAB10+ membrane reservoir structure. i and j Representative images (i) and quantifications (j) of CellMask+ membrane reservoirs in WT Henle 407 cells in control condition or treated with MLi-2 as in (b). Cells in both conditions did not have RAB10 overexpressed. k CRISPR/Cas9-mediated deletion of LRRK2. l and m, Representative images (l) and quantifications (m) of endogenous RAB10+ membrane reservoirs in indicated cells in basal growth condition. n and o, Representative images (n) and quantifications (o) of RAB10+ membrane reservoirs in RAB10 KO Henle 407 cells transfected with myc-PM-RAB10 constructs, and treated with or without MLi-2 (50 nM, 90 min). All images shown are representative images from three independent experiments. Data shown are means ± standard deviation (S.D.) for three independent experiments. At least 100 cells for each condition in each experiment were scored for the presence of RAB10-(c, g and l) or CellMask-(h) positive tubules. P values were calculated using two tailed unpaired t-test (d, h and j), one-way analysis of variance (ANOVA) (m), or two-way ANOVA (o). Scale bars, (c, g, i, l and n) 10 μm, (e, upper and lower panels) 10 μm, (e, middle panel) 3 μm. Source data are provided as a Source Data file.
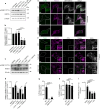
Fig. 2
Fig. 2. LRRK2-dependent membrane reservoirs are exploited by STm during invasion.
a Representative images of WT Henle 407 cells transfected with GFP-RAB10 and infected with WT STm. Cells were fixed at 10 min p.i. and stained for phospho-RAB10 (T73). In this and following panels, invasion sites at 10 min p.i. were identified by positive F-actin and STm staining. The cell boundaries are depicted by the white outlines. b and c Representative images (b) and quantifications (c) of myc-PM-RAB10 recruitment to STm invasion sites. RAB10 KO Henle 407 cells were transfected with myc-PM-RAB10 WT, T73E or T73A construct, and then infected with WT STm. Cells were fixed at 10 min p.i. and stained for myc-tag. Line plot profile follows the white arrow in the ‘Merge’ channel in (b). d and e, Representative images (d) and quantifications (e) of GFP-RAB10 recruitment to STm invasion sites. RAB10 KO Henle 407 cells were transfected with GFP-RAB10 WT, Q68L or T23N construct and infected with WT STm. Cells were fixed and imaged at 10 min p.i. Line plot profile follows the white arrow in the ‘Merge’ channel in d. f Representative SEM images of invasion ruffles. WT and LRRK2 KO Henle 407 cells were infected with WT STm and fixed at 10 min p.i. g Quantifications of invasion ruffle areas identified in (f). The areas of individual invasion ruffle were measured as described in the “Methods” section. h WT and LRRK2 KO Henle 407 cells were infected with WT STm and lysed at 2 hours p.i. for CFU counting. All images shown are representative images from three independent experiments. Data shown are means ± S.D. for three independent experiments. At least 100 invasion sites (c and e) for each condition in each experiment were scored for the recruitment of RAB10. For SEM analysis of invasion ruffle area (g), 15 invasion ruffles for each condition in each experiment were scored (45 invasion ruffles in total for each condition). P values were calculated using one-way ANOVA (c and e) or two tailed unpaired t-test (g and h). Scale bars, 10 μm. Source data are provided as a Source Data file.
Fig. 3
Fig. 3. RAB10 dephosphorylation is required for its removal from STm invasion sites.
a and b Representative images (a) and quantifications (b) of phospho-RAB10 (T73) signal measured by western blot in WT Henle 407 cells infected with WT STm for indicated time. In this and following panels with the quantification of RAB10 phosphorylation by western blot, the relative phospho-RAB10 (T73) signal was calculated by comparison with the respective total RAB10 signal. c and d, Representative images (c) and quantifications (d) of PM-RAB10 retention at STm invasion sites at 30 min p.i. RAB10 KO Henle 407 cells were transfected with WT, T73E or T73A myc-PM-RAB10, and then infected with WT STm. Cells were fixed at 30 min p.i. and stained for myc-tag. In this and the following panels, invasion sites at 30 min p.i. were identified by staining of extracellular STm before permeabilization. Line plot profile follows the white arrow in the ‘Merge’ channel in c. e and f, Representative images (e) and quantifications (f) of GFP-RAB10 retention at STm invasion sites at 30 min p.i. RAB10 KO Henle 407 cells were transfected with GFP-RAB10 WT, Q68L or T23N construct, and then infected with WT STm. Cells were fixed and imaged at 30 min p.i. Data shown are means ± S.D. for three independent experiments. At least 100 invasion sites (d and f) for each condition in each experiment were scored for the retention of RAB10. P values were calculated using one-way ANOVA. Scale bars, 10 μm. Source data are provided as a Source Data file.
Fig. 4
Fig. 4. RAB10 dephosphorylation is required for STm invasion.
a Representative images of WT or RAB10 KO Henle 407 cells transfected with the indicated constructs (PM-mCherry with empty vector or indicated PM-RAB10 construct), infected with WT BFP-STm for 30 min and labeled with CellMask. b Quantifications of a and Supplementary Fig. 5. Scission is represented as the percent of bacteria in SCVs. The total number of bacteria that were positive for PM-mCherry at the invasion site was quantified and the proportion of these bacteria that were negative for CellMask was determined. These bacteria were in a sealed compartment that was considered an SCV and the number was used to represent the invasion efficiency at 30 min p.i. (c and d) Representative images (c) and quantifications (d) of phospho-RAB10 (T73) signal measured by western blot in WT Henle 407 cells, or LRRK2 KO Henle 407 cells complemented with LRRK2 WT or mutant expression. The cells were infected with WT STm and cell lysates were collected and immunoblotted at 30 min p.i. for phospho-RAB10 (T73), total RAB10, or ß-actin (loading control). e WT or LRRK2 KO Henle 407 cells transfected with indicated constructs (PM-mCherry with empty vector or indicated LRRK2 construct), and then infected with WT BFP-STm SL1344 strain for 30 min and labeled with CellMask. PM scission was quantified as in c. Representative images are shown in Supplementary Fig. 6a, b. Data shown are means ± S.D. for three independent experiments. At least 25 independent cells (b and e) for each condition in each experiment were scored for PM scission. P values were calculated using two-way ANOVA. In b and e P values were calculated between the KOs (RAB10 KO or LRRK2 KO) and their respective WT controls. Scale bars, 10 μm. Source data are provided as a Source Data file.
Fig. 5
Fig. 5. TLR4 mediates RAB10 dephosphorylation during STm invasion.
a and b Representative images (a) and quantifications (b) of phospho-RAB10 (T73) signal measured by western blot in WT Henle 407 cells infected with the indicated STm strains. Cell lysates were collected and immunoblotted for phospho-RAB10 (T73), total RAB10, or ß-actin (loading control) at 30 min p.i. c and d, Representative images (c) and quantifications (d) of phospho-RAB10 (T73) signal measured by western blot in WT Henle 407 cells infected with WT STm, treated with WT STm supernatant (STm S/N), dead WT STm, LPS (100 ng/ml) or ΔinvA/Inv STm (invasion-deficient attenuated strain with inactivation of T3SS-1, and with invasin gene from Yersinia expressed) for 30 min. e and f Representative images (e) and quantifications of (f) phospho-RAB10 (T73) signal measured by western blot. WT, LRRK2 KO and TLR4 KO Henle 407 cells were infected with WT STm and cell lysates were collected at 10 min or 30 min p.i. and immunoblotted for TLR4, phospho-RAB10 (T73), total RAB10, or ß-actin (loading control). g and h Quantifications (g) and representative images (h) of phospho-RAB10 (T73) localization at WT STm invasion sites at the indicated times p.i. WT, LRRK2 KO or TLR4 KO Henle 407 cells were transfected with GFP-RAB10 and then infected with WT STm. Cells were fixed at 10 or 30 min p.i. and stained for phospho-RAB10 (T73) and STm. The cell boundaries in h are depicted by the white outlines. i WT Henle 407 cells and TLR4 KO Henle 407 cells were infected with WT STm and lysed at 2 hours p.i. for CFU counting. Data shown are means ± S.D. for three independent experiments. In g At least 100 invasion sites for each condition in each experiment were scored for the recruitment or the retention of RAB10. P values were calculated using one-way ANOVA (b and d), two-way ANOVA (f and g), or two tailed unpaired t-test (i). P values in d were calculated and labeled between the treated groups with the untreated control. Scale bars, 10 μm. Source data are provided as a Source Data file.
Fig. 6
Fig. 6. PIEZO1 regulates plasma membrane dynamics at invasion sites via RAB10 dephosphorylation.
a and b Representative images (a) and quantifications (b) of phospho-RAB10 (T73) and total RAB10 signal measured by western blot in WT Henle 407 cells treated with the PIEZO1 agonist, Yoda1. Cell lysates were collected and immunoblotted following a 30 min treatment with either DMSO or Yoda1. Data shown are means ± S.D. for three independent experiments. c and d Representative images (c) and quantifications (d) of phospho-RAB10 (T73) signal measured by western blot in WT Henle 407 cells. The cells were treated with the PIEZO1 inhibitor GsMTx4, LPS and/or the PIEZO1 agonist Yoda1, and cell lysates were collected and immunoblotted for phospho-RAB10 (T73), total RAB10, or ß-actin (loading control) following 30 min treatment. e Representative images of TLR4 and PIEZO1 localizations in uninfected condition. WT or TLR4 KO Henle 407 cells were transfected with GFP-RAB10, or RAB10 KO Henle 407 cells were nontransfected. Then the cells were fixed and stained for TLR4 and PIEZO1. f Representative images of TLR4 and PIEZO1 localizations in at 10 min p.i. WT, TLR4 KO or RAB10 KO Henle 407 cells were infected with WT STm and then fixed at 10 min p.i. and stained for STm, TLR4 and PIEZO1. The images in the ‘Merge’ channel represent the merged accumulative fluorescence signals from the TLR4, PIEZO1 and STm channels. g and h Quantifications of TLR4 (g) and PIEZO1 (h) localizations at invasion sites in (f). i WT Henle 407 cells were untreated or pretreated with indicated PIEZO1 inhibitors, and then infected with WT STm and lysed at 2 hours p.i. for CFU counting. At least 100 invasion sites (g and h) for each condition in each experiment were scored for the recruitment of TLR4 or PIEZO1. All images shown are representative images from three independent experiments. Data shown are means ± S.D. for three independent experiments. P values were calculated using one-way ANOVA. Scale bars, 10 μm. In e and f the cell boundaries are depicted by the white outlines. Source data are provided as a Source Data file.
Fig. 7
Fig. 7. TMEM16F is required for local phosphatidylserine scrambling at STm invasion sites.
a WT and TMEM16F KO Henle 407 cells were infected with WT STm and lysed at 2 hours p.i. for CFU counting. b Representative images of WT Henle 407 cells transfected with GFP-TMEM16F and myc-PM-RAB10 and infected with WT STm. Cells were fixed at 10 min p.i. and stained for myc-tag and STm. The image in the ‘Merge’ channel represents the merged accumulative fluorescence signals from the GFP-TMEM16F, myc-PM-RAB10 and STm channels. c and d Representative images (c) and quantifications (d) of GFP-TMEM16F’s localizations to STm invasion sites at 10 min p.i. WT, or RAB10 KO Henle 407 cells were transfected with GFP-TMEM16F and then infected with WT STm. Cells were fixed at 10 min p.i. and stained for STm. The images in the ‘Merge’ channel represent the merged accumulative fluorescence signals from the GFP-TMEM16F and STm channels. e A schematic model of LactC2-GFP probe labeling of local phosphatidylserine scrambling. Created in BioRender. Brumell, J. (2024) https://BioRender.com/u42p691. Representative images (middle and right panels) of WT or TMEM16F KO Henle 407 cells transfected with PM-mCherry and infected with WT or ΔsopD BFP-STm SL1344 along with the addition of LactC2-GFP probe. Cells were fixed and imaged at 30 min p.i. The cell boundaries are depicted by the white outlines. f Quantifications of LactC2-GFP localization at invasion sites in e. All images shown are representative images from three independent experiments. Data shown are means ± S.D. for three independent experiments. At least 100 invasion sites for each condition in each experiment were scored for GFP-TMEM16F (d) or LactC2-GFP (f) localization to STm invasion sites. P values were calculated using two tailed unpaired t-test (d) or two-way ANOVA (f). Scale bars, 10 μm. Source data are provided as a Source Data file.
Fig. 8
Fig. 8. TMEM16F is required for LRRK2 removal from STm invasion sites.
a and b Representative images (a) and quantifications (b) of LRRK2 localization at invasion sites at 30 min p.i. WT or TMEM16F KO Henle 407 cells were transfected with LRRK2-mNeon and myc-PM-RAB10 and infected with WT or ΔsopD STm. Cells were fixed at 30 min p.i. and stained with myc-tag. Line plot profile follows respective white arrows in the insets of the ‘Merge’ channels on the left. c and d, Representative images (c) and quantifications of (d) phospho-LRRK2 (S935) signal measured by western blot. WT, LRRK2 KO and TLR4 KO Henle 407 cells were infected with WT STm and cell lysates were collected at 30 min p.i. and immunoblotted for phospho-LRRK2 (S935), total LRRK2, or ß-actin (loading control). Data shown are means ± S.D. for three independent experiments. At least 100 invasion sites for each condition in each experiment were scored for LRRK2 localization to STm invasion sites. P values were calculated using two-way ANOVA. Scale bars, 10 μm. Source data are provided as a Source Data file.
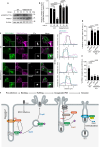
Fig. 9
Fig. 9. TMEM16F reduces RAB10 phosphorylation and promotes DNM2 recruitment at STm invasion sites.
a and b Representative images (a) and quantifications of (b) phospho-RAB10 (T73) signal measured by western blot. Henle 407 cells were infected with WT STm for 30 min and immunoblotted for indicated antibodies. c Representative images of Henle 407 cells transfected with GFP-RAB10 and DNM2-mCherry and infected with WT or ΔsopD STm. Cells were fixed at 30 min p.i. and stained for STm. Line plot profile follows respective white arrows in the insets of the ‘Merge’ channels on the left. d and e Quantifications of RAB10 (d) or DNM2 (e) localization at invasion sites at 30 min p.i. Data shown are means ± S.D. for three independent experiments. At least 100 invasion sites (d and e) for each condition in each experiment were scored for RAB10 or DNM2 localizations to invasion sites. P values were calculated using two-way ANOVA. Scale bars, 10 μm. Source data are provided as a Source Data file. f Model depicting the results of this study. Prior to infection, RAB10 is recruited to the plasma membrane (PM) where it stabilizes tubular invaginations (membrane reservoirs). LRRK2 may also contribute to membrane tubulation through binding to acidic phospholipids, including phosphatidylserine (PS), on the cytoplasmic leaflet of the PM. RAB10’s T73 phosphorylation by LRRK2 maintains RAB10 in a GTP-bound state by preventing its interaction with GTPase activating proteins (GAPs). In turn, phosphorylated RAB10 promotes LRRK2 activity at the membrane in a feed-forward activation loop. With STm infection, membrane reservoirs can be redistributed to STm invasion sites by carrier vesicle delivery and/or tubule resorption, helping to generate invasion ruffles. Phosphorylated and GTP-bound RAB10 is recruited to STm invasion sites and generates invaginated portions of the PM containing bacteria. Bacterial lipopolysaccharide (LPS) stimulates TLR4 to induce PIEZO1-mediated calcium influx, a signal that activates the PS scramblase TMEM16F. PS scrambling promotes LRRK2 release from the membrane, enabling RAB10 dephosphorylation by PPM1H and/or other phosphatases. Dephosphorylated RAB10 is targeted by SopD, a Salmonella T3SS effector with GAP activity. GDP-bound RAB10 interacts with DNM2, promoting invaginated PM scission to generate SCVs.

References

    1. Pillay, T. D. et al. Speaking the host language: how Salmonella effector proteins manipulate the host. Microbiol. (N. Y)169, 1342 (2023). - PMC - PubMed
    1. Finlay, B. B., Ruschkowski, S. & Dedhar, S. Cytoskeletal rearrangements accompanying salmonella entry into epithelial cells. J. Cell Sci.99, 283–296 (1991). - PubMed
    1. Liu, W. et al. LRRK2 promotes the activation of NLRC4 inflammasome during Salmonella Typhimurium infection. J. Exp. Med. 214, 3051 (2017). - PMC - PubMed
    1. Lian, H. et al. Parkinson’s disease kinase LRRK2 coordinates a cell-intrinsic itaconate-dependent defence pathway against intracellular Salmonella. Nat. Microbiol. 2023 8:108, 1880–1895 (2023). - PMC - PubMed
    1. Mead, P. S. et al. Food-related illness and death in the United States. Emerg. Infect. Dis.5, 607–625 (1999). - PMC - PubMed

MeSH terms

Substances

LinkOut - more resources