. 2025 Mar 8;16(1):2338.
doi: 10.1038/s41467-025-57299-3.

Mitochondrial damage in muscle specific PolG mutant mice activates the integrated stress response and disrupts the mitochondrial folate cycle

Affiliations

Mitochondrial damage in muscle specific PolG mutant mice activates the integrated stress response and disrupts the mitochondrial folate cycle

Simon T Bond et al. Nat Commun. .

Abstract

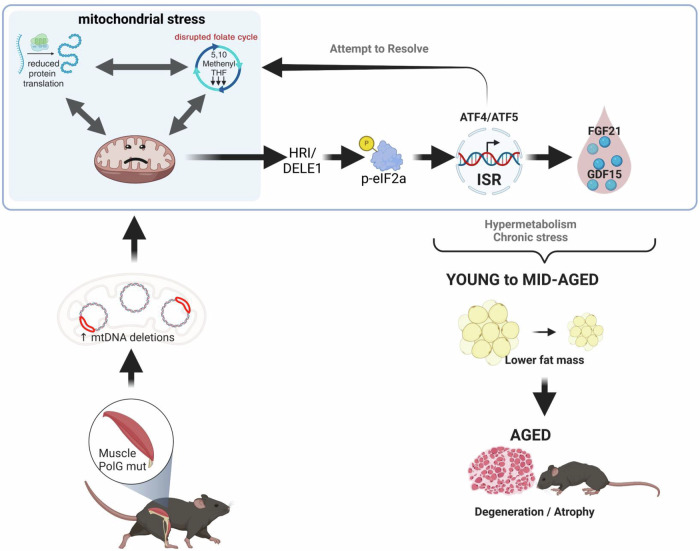
During mitochondrial damage, information is relayed between the mitochondria and nucleus to coordinate precise responses to preserve cellular health. One such pathway is the mitochondrial integrated stress response (mtISR), which is known to be activated by mitochondrial DNA (mtDNA) damage. However, the causal molecular signals responsible for activation of the mtISR remain mostly unknown. A gene often associated with mtDNA mutations/deletions is Polg1, which encodes the mitochondrial DNA Polymerase γ (PolG). Here, we describe an inducible, tissue specific model of PolG mutation, which in muscle specific animals leads to rapid development of mitochondrial dysfunction and muscular degeneration in male animals from ~5 months of age. Detailed molecular profiling demonstrated robust activation of the mtISR in muscles from these animals. This was accompanied by striking alterations to enzymes in the mitochondrial folate cycle that was likely driven by a specific depletion in the folate cycle metabolite 5,10 methenyl-THF, strongly implying imbalanced folate intermediates as a previously unrecognised pathology linking the mtISR and mitochondrial disease.


Conflict of interest statement

Competing interests: BGD, STB and DCH together with the Baker Heart & Diabetes Institute declare they are pursuing protection of intellectual property (IP) around the use of proprietary folate cycle metabolite derivatives as therapeutics for mitochondrial diseases, and other degenerative conditions in which 1C-metabolism and the ISR are perturbed. All other authors declare no conflict of interest.

Figures

Fig. 1
Fig. 1. Generation of a post-developmental muscle specific PolG exonuclease mutant mouse with detrimental effects on muscle function and whole-body parameters.
A Abundance of each exon across the Polg1 gene, as determined by RNAseq, in skeletal muscle in PolGmut (red bars) compared to control (PolGcont, black bars) mice, n = 6/group. B Mutation rate (fold change from control) in skeletal muscle mtDNA of PolGmut and D257A Mutator mice in short or long-term cohorts compared to their respective controls, (short-term/long-term/mutator: PolGcont n = 6/5/5 & PolGmut n = 11/6/6). C Amplification rate (fold change from control) of a control mtDNA region of skeletal muscle mtDNA in PolGmut and D257A Mutator in short or long-term cohorts compared to their respective controls, (short-term/long-term/mutator: PolGcont n = 9/4/5 & PolGmut n = 8/4/5). D Heatmap representing Log2 fold change of mitochondrial RNA transcript abundance in PolGmut compared with PolGcont, as determined by RNA-sequencing in skeletal muscle. E Abundance of mtDNA encoded proteins in PolGmut mice relative to PolGcont mice presented as percent from control, as determined by proteomics, n = 5/group. Phenotyping data in short and long-term cohorts of PolGcont and PolGmut mice (F) Weekly body weights in the short-term and (G) long-term cohorts. H Lean mass in the short-term and, (I) long-term cohorts. J Fat mass in the short-term and (K) long-term cohorts. Sections of TA muscle were analysed using H&E staining in the long-term cohort for (L) quantification of fibre diameter and (M) ratio of centralised nuclei in control PolGcont and PolGmut mice, (PolGcont n = 6, PolGmut n = 5). TA muscle expression of genes associated with muscle growth and regeneration in the (N) short-term (PolGcont n = 9, PolGmut n = 10) and (O) long-term cohorts (PolGcont n = 7, PolGmut n = 4). F, H, J, n = 10/group; G, I, K: PolGcont n = 9, PolGmut n = 5). Data are presented as mean ± SEM, with P-value between control and mutant biological replicates determined by repeated measures two-way ANOVA with correction for multiple comparisons (FK) or two-sided, unpaired two-tailed t-test (L) or Mann-Whitney test (AC, E, MO). Source data for these figures are provided in the Source Data file.
Fig. 2
Fig. 2. Molecular and functional specific changes in mitochondria induced by muscle specific loss of PolG exonuclease activity.
Protein abundance in mitochondria from skeletal muscle of PolGcont and PolGmut short term mice was analysed using proteomics. Computational analysis of the data was performed including (A) hierarchical clustering, (B) principal component analysis (PCA) and, (C) volcano plot depicting proteins that were significantly altered, (low=blue dots and high=red dots) in PolGmut mitochondria compared to PolGcont (grey dots=not significantly altered). D Enrichment analysis of proteins significantly regulated in mitochondria between the genotypes, depicting upregulated pathways in red, and downregulated pathways in blue. Size of the circle indicates the number of proteins that contribute to the cluster. E Volcano plot of differentially regulated proteins between the genotypes, with the individual proteins of the Electron Transport Chain (ETC Complex I-V) highlighted (CI = green, CII = Red, CII = pink, CIV = purple, CV = orange) and (F) Volcano plot highlighting proteins from the mitochondrial ribosome complex (blue dots). Analyses of proteomic data (AF) were corrected using Benjamini-Hochberg FDR, n = 8/group. Isolated mitochondria were also analysed for functional differences including (G) Blue Native PAGE gel with immunoblot for Complex I (NDUFA9) and Complex II (SDHA) formation and, (H) quantitation of BN-PAGE blots, n = 4/group. The Seahorse analyser was used on fresh mitochondria isolated from muscle to measure Oxygen Consumption Rate (OCR) for activity of Complex I (CI), Complex II (CII) and Complex IV (CIV) from (I, J) short-term cohort (PolGcont n = 6, PolGmut n = 9), and (K, L) long-term cohort (PolGcont n = 6, PolGmut n = 5). Lipidomics was performed in TAs of PolGcont and PolGmut from long-term cohorts demonstrating the (M) abundance of the cardiolipin pre-cursor lipid phosphatidylglycerol (PG), and (N)total cardiolipin (CL), PolGcont n = 6, PolGmut n = 5. I-N are presented as mean ± SEM, with P-value between control and mutant biological replicates determined by two-sided, unpaired two-tailed t-test (H) or Mann-Whitney test (IN). O Abundance of individual CL species (fold change from PolGcont) in TA and Liver from PolGcont and PolGmut long-term mice (purple = increased, green = decreased in PolGmut), PolGcont n = 6, PolGmut n = 5. Source data for these figures are provided in the Source Data file.
Fig. 3
Fig. 3. Transcriptional regulation and activation of the ISR in response to muscle specific loss of PolG exonuclease activity.
Unbiased assessment of RNA abundance was analysed from skeletal muscle of PolGcont and PolGmut short-term mice using bulk RNA-sequencing. Computational analysis of the data was performed including (A) hierarchical clustering of differentially expressed genes, (B) principal component analysis (PCA) between PolGcont and PolGmut and, (C) volcano plot depicting genes that were upregulated (red dots) and downregulated (blue dots) in PolGmut muscle compared to PolGcont—grey dots indicate non-significantly altered genes. (D) Specific identification of components driving global changes in principal component analysis. For each pathway, a one-sample t-test on each gene set GOBP was performed, with the adjusted P-values used to rank the pathways for each of the first 5 principal components. The pathways are labelled with FDR first, followed by the principal components (duplicated pathways are skipped) (red=increased, blue=decreased, white=no change). Enrichment analysis (KEGG) on genes demonstrates (E) pathways that were significantly upregulated between the genotypes and (F) pathways that were significantly downregulated between the genotypes. Analyses of transcriptomic data (AF) were corrected using Benjamini-Hochberg FDR, n = 6/group. Fgf21 and Gdf15 mRNA expression as determined by qPCR in muscles from (G) short-term (PolGcont n = 9, PolGmut n = 10) and (H) long-term (PolGcont n = 6, PolGmut n = 4) PolGcont and PolGmut mice. Gene expression analysis was validated by ELISA for protein abundance of FGF21 and GDF15 in plasma in (I) short-term (PolGcont n = 10, PolGmut n = 9) and (J) long-term (PolGcont n = 5, PolGmut n = 5) PolGcont and PolGmut mice. Gene expression and ELISA data are presented as mean ± SEM, with P-value between control and mutant biological replicates determined by two-sided, unpaired two-tailed Mann-Whitney test (GJ). Source data for these figures are provided in the Source Data file.
Fig. 4
Fig. 4. Metabolite alterations in muscle of PolGmut mice mediated by muscle specific loss of PolG exonuclease activity.
Unbiased assessment of metabolite abundance was performed in gastrocnemius muscle of PolGcont and PolGmut mice with (A) pathway enrichment analysis (MetaboAnalyst-KEGG) undertaken in short-term and (B) long-term cohorts, where metabolic pathways are listed in order of significance, red gradient indicating P-value, and the size of the circle denoting the enrichment ratio. C Metabolites in PolGmut short term (red) and long term (blue) skeletal muscle that had greater than 0.05-fold change (relative to PolGcont). D Integrated metabolic pathway analysis (MetaboAnalyst) of short-term skeletal muscle bulk RNA-sequencing and metabolomics data sets, with red gradient indicating P-value and circle size indicating pathway impact. Metabolomics data (AD) was normalised by median and log transformed using MetaboAnalyst 5.0, (short-term: n = 8/group & long-term: PolGcont n = 8, PolGmut n = 7). E relevant folate cycle genes detected by RNA-sequencing (n = 6/group) and (F) proteins detected by mitochondrial proteomics, n = 5/group. Analyses of transcriptomic data (E) and proteomic data (F) were corrected using Benjamini-Hochberg FDR. G Schematic of the mammalian cytosolic/mitochondrial folate cycle (red text denotes upregulated proteins and blue indicating reduced folate intermediates) in short-term cohort. Targeted metabolomics was performed to determine folate cycle metabolic intermediates in (H) short (PolGcont n = 10, PolGmut n = 9) and (I) long-term (PolGcont n = 8, PolGmut n = 7) cohorts (reduced 5,10-Methenyl-THF highlighted in short term folate cycle schematic in blue). E, F, H, I data are presented as mean ± SEM, with P-value between control and mutant biological replicates determined by two-sided, unpaired two-tailed t-test (E, F) or Mann-Whitney test (H, I). THF = Tetrahydrofolate; TMP = Thymidine monophosphate; ζm5U = 5-taurinomethyluridine. Source data for these figures are provided in the Source Data file. Fig. 4G Created in BioRender. Drew, B. (2025) https://BioRender.com/t82k138.
Fig. 5
Fig. 5. Schematic summarising the tissue-specific and whole body impacts of muscle specific loss of PolG exonuclease activity.
PolG Exonuclease deletion in skeletal muscle leads to an increased mtDNA deletion rate that with age promotes a degenerative phenotype specifically in the mutated tissue (skeletal muscle). This degeneration is preceded by a robust activation of the mitochondrial integrated stress response (ISR), driven in part by reduced protein translation and perturbed folate cycle activity characterised by a reduced abundance of 5,10-methenyl-THF. The activated ISR leads to an increased release of the peptide hormones FGF21 and GDF15 into the circulation. These series of events alter systemic metabolism that profoundly impact the accretion of fat mass. This figure was Created in BioRender. Drew, B. (2022) BioRender.com/s20n885.

References

    1. Lee, R. G. et al. Deleterious variants in CRLS1 lead to cardiolipin deficiency and cause an autosomal recessive multi-system mitochondrial disease. Hum. Mol. Genet.31, 3597–3612 (2022). - PMC - PubMed
    1. Johns, D. R. Mitochondrial, D. N. A. and disease. N. Engl. J. Med.333, 638–644 (1995). - PubMed
    1. Fontana, G. A. & Gahlon, H. L. Mechanisms of replication and repair in mitochondrial DNA deletion formation. Nucleic acids Res.48, 11244–11258 (2020). - PMC - PubMed
    1. Falkenberg, M., Larsson, N. G. & Gustafsson, C. M. DNA replication and transcription in mammalian mitochondria. Annu. Rev. Biochem.76, 679–699 (2007). - PubMed
    1. Anderson, S. et al. Sequence and organization of the human mitochondrial genome. Nature290, 457–465 (1981). - PubMed

MeSH terms

LinkOut - more resources