. 2025 Mar 8;11(1):24.
doi: 10.1038/s41523-025-00740-z.

Prognostic and molecular multi-platform analysis of CALGB 40603 (Alliance) and public triple-negative breast cancer datasets

Affiliations

Prognostic and molecular multi-platform analysis of CALGB 40603 (Alliance) and public triple-negative breast cancer datasets

Brooke M Felsheim et al. NPJ Breast Cancer. .

Abstract

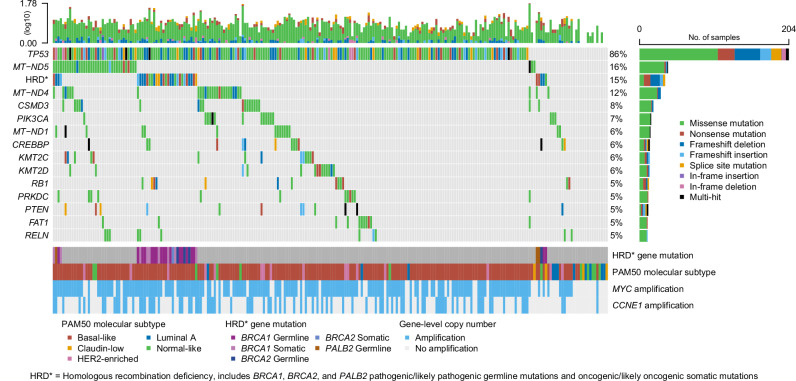
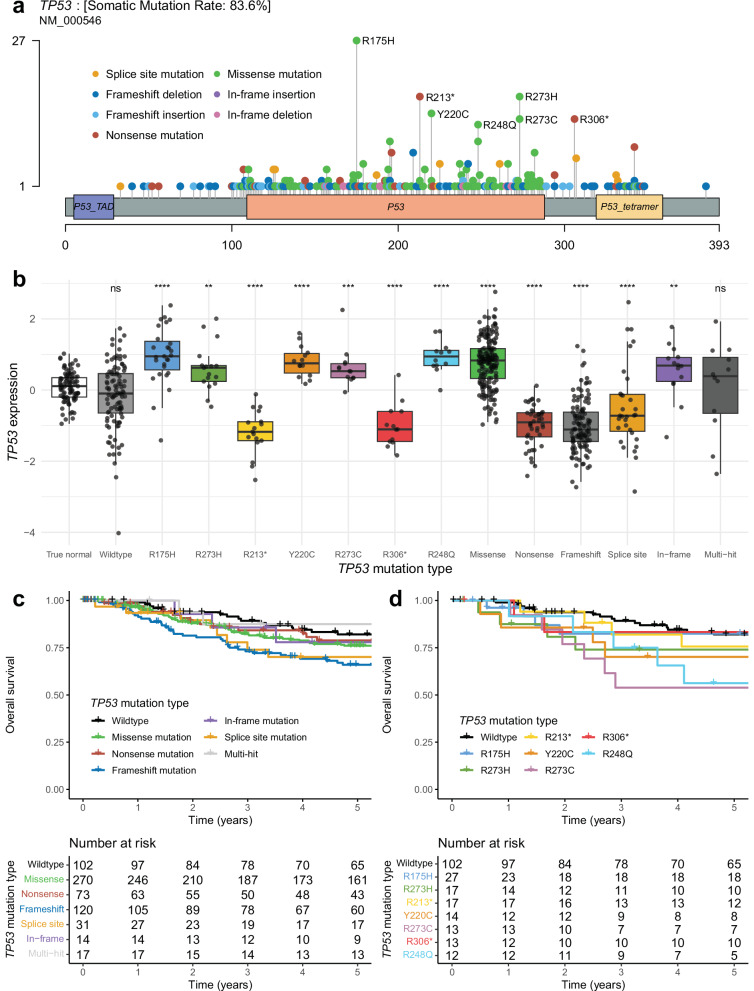
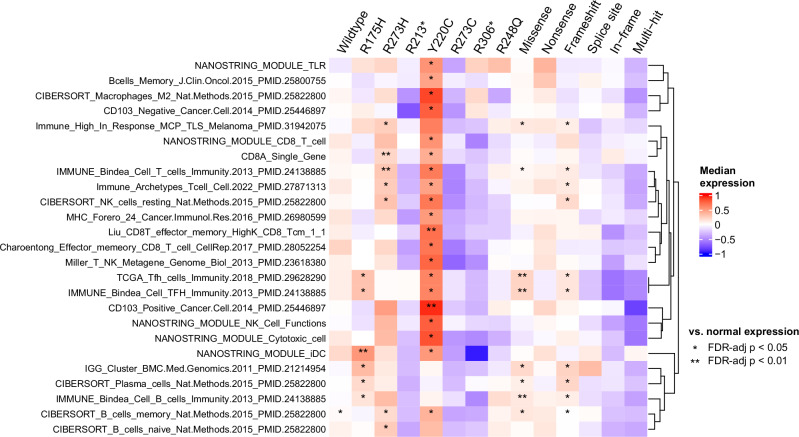
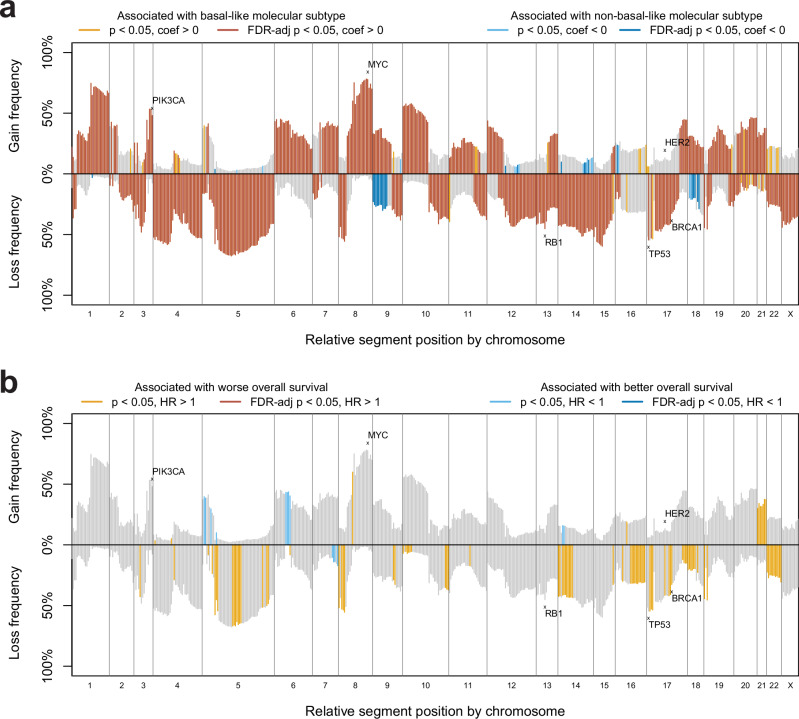
Triple-negative breast cancer (TNBC) is an aggressive and heterogeneous disease that remains challenging to target with traditional therapies and to predict risk. We provide a comprehensive characterization of 238 stage II-III TNBC tumors with paired RNA and DNA sequencing data from the CALGB 40603 (Alliance) clinical trial, along with 448 stage II-III TNBC tumors with paired RNA and DNA data from three additional datasets. We identify DNA mutations associated with RNA-based subtypes, specific TP53 missense mutations compatible with potential neoantigen activity, and a consistently highly altered copy number landscape. We train exploratory multi-modal elastic net models of TNBC patient overall survival to determine the added impact of DNA-based features to RNA and clinical features. We find that mutations and copy number show little to no prognostic value, while RNA expression features, including signatures of T cell and B cell activity, along with stage, improve stratification of TNBC survival risk.


Conflict of interest statement

Competing interests: C.M.P. is an equity stockholder and consultant of BioClassifier LLC; C.M.P. is also listed as an inventor on patent applications for the Breast PAM50 Subtyping assay. S.M.T. reports: Consulting or Advisory Role: Novartis, Pfizer/SeaGen, Merck, Eli Lilly, AstraZeneca, Genentech/Roche, Eisai, Sanofi, Bristol Myers Squibb/Systimmune, Daiichi Sankyo, Gilead, Zymeworks, Zentalis, Blueprint Medicines, Reveal Genomics, Sumitovant Biopharma, Artios Pharma, Menarini/Stemline, Aadi Bio, Bayer, Incyte Corp, Jazz Pharmaceuticals, Natera, Tango Therapeutics, eFFECTOR, Hengrui USA, Cullinan Oncology, Circle Pharma, Arvinas, BioNTech, Launch Therapeutics, Zuellig Pharma, Johnson&Johnson/Ambrx. Research Funding: Genentech/Roche, Merck, Exelixis, Pfizer, Lilly, Novartis, Bristol Myers Squibb, AstraZeneca, NanoString Technologies, Gilead, SeaGen, OncoPep, Daiichi Sankyo, Menarini/Stemline. Travel: Lilly, Sanofi, Gilead, Jazz, Pfizer, Arvinas. W.M.S. is an unpaid member of the steering committee for AbbVie.

Figures

Fig. 1
Fig. 1. The mutational landscape of the CALGB 40603 dataset.
The columns correspond to individual patients (n = 238) and the rows correspond to mutations of the 14 genes with the highest somatic mutation frequencies and a homologous recombination deficiency (HRD) feature, representing any BRCA1, BRCA2, or PALB2 pathogenic/likely pathogenic germline mutation or oncogenic/likely oncogenic somatic mutation. Color-coded labels correspond to mutation type, with light gray representing wildtype. Patient-level and gene-level mutation frequency distributions are shown at the top and right, respectively. RNA-based (PAM50 subtype) and DNA-based (MYC and CCNE1 amplification) annotations for each patient, including annotations for the HRD gene mutations, are included at the bottom with corresponding legends.
Fig. 2
Fig. 2. Somatic TP53 mutations among samples from four combined datasets (CALGB 40603, FUSCC, METABRIC, and TCGA).
a Lollipop plot showing the distribution of TP53 mutations among patients. The x-axis depicts TP53 amino acid location, and amino acid mutations are depicted as lollipops at the location where they occur, with the color corresponding to the mutation type and height corresponding to the number of patients with that specific mutation. b TP53 normalized RNA expression by TP53 mutation type, including cancer-adjacent normal samples from TCGA. Asterisks represent significant Wilcoxon rank sum tests comparing the expression of samples with each TP53 mutation type to the TP53 expression of the normal samples, adjusted for multiple tests (*FDR-adj p ≤ 0.05, **FDR-adj p ≤ 0.01, ***FDR-adj p ≤ 0.001, ****p ≤ 0.0001). c Kaplan–Meier plot depicting the overall survival proportion of patients over time by their TP53 mutation type. d Kaplan–Meier plot depicting the overall survival proportion of patients over time by the status of recurrent TP53 mutations and TP53 wildtype.
Fig. 3
Fig. 3. Immune gene signatures (rows) by TP53 mutation type (columns), with each cell representing the expression of the corresponding signature in samples with the corresponding TP53 mutation type.
Annotations represent the significance of a one-sided Wilcoxon rank-sum test comparing the immune signature expression of samples with the corresponding TP53 mutation type vs. the immune signature expression of normal samples, adjusted for multiple tests (*FDR-adj p ≤ 0.05, **FDR-adj p ≤ 0.01). The immune signatures shown in the heatmap represent those with FDR-adj p < 0.05 for at least one recurrent TP53 missense mutation and FDR-adj p ≥ 0.05 for TP53 nonsense mutations. Rows are hierarchically clustered.
Fig. 4
Fig. 4. Segment-level copy number landscape plots of the combined TNBC samples.
On the x-axis, each of the 534 copy number segments is plotted in relative order, with height above the x-axis corresponding to the gain frequency of the segment within the sample set and height below the x-axis corresponding to the loss frequency of the segment within the sample set. a segment gain/loss frequencies are colored by statistical significance and direction of association of binomial generalized linear models using segment gain/loss status to predict basal-like subtype. Orange-colored segment gains/losses are statistically more significant in basal-like samples vs. non-basal-like samples with (dark orange) and without (light orange) multiple test corrections. Blue-colored segment gains/losses are statistically more significant in non-basal-like samples vs. basal-like samples with (dark blue) and without (light blue) multiple test corrections. b segment gain/loss frequencies are colored by statistical significance and direction of association of Cox proportional hazards models using segment gain/loss status to predict overall survival. Orange-colored segment gains/losses are associated with worse survival, with (dark orange) and without (light orange) multiple test corrections. Blue-colored segment gains/losses are associated with better survival, with (dark blue) and without (light blue) multiple test corrections.
Fig. 5
Fig. 5. Multi-platform models of overall survival in patients with stage II-III TNBC.
a Schematic overview of the workflow used to train and evaluate the Cox proportional hazards models with elastic net regularization. This workflow was used to train a model for each combination of input feature type (clinical, RNA, and DNA). Note that the clinical-only model only has one input feature (tumor stage), so this workflow was not used and instead a Cox proportional hazards model was fit to the training set without bootstrapping or regularization. b Each model by the coefficients in the final model, colored by positive (red) or negative (blue) coefficient value. c The C-index values of each model in the three individual test sets and in the combined test set.
Fig. 6
Fig. 6. RNA-only and clinical + RNA models of overall survival in patients with stage II-III TNBC.
ac corresponds to the RNA-only elastic net model, and df corresponds to the clinical + RNA elastic net model. a, d The features selected by the elastic net model and their corresponding scaled coefficient values. Features with negative values (blue) are associated with better overall survival and features with positive values (red) are associated with worse overall survival. b, e Kaplan–Meier plots of overall survival by predicted survival risk from the corresponding elastic net model. Continuous risk scores predicted for each sample were categorized into low-risk (blue), medium-risk (black), and high-risk (red) cutoffs based on the median risk score of each test set. Samples and associated risk scores from the three test sets were combined. c, f The likelihood-ratio (LR) statistic was estimated as we added the continuous elastic net risk score and/or tumor stage to a Cox proportional hazards model using the samples from the combined test set. The change in LR statistic when tumor stage, then risk score is added is shown (order 1) alongside the change in LR statistic when RNA model risk, then tumor stage is added is shown (order 2). The p-values displayed represent the statistical significance of the corresponding coefficient in the univariate/multivariate model on test set data.

References

    1. Waks, A. G. & Winer, E. P. Breast Cancer Treatment: A Review. JAMA321, 288–300 (2019). - PubMed
    1. Schmid, P. et al. Event-free Survival with Pembrolizumab in Early Triple-Negative Breast Cancer. N. Engl. J. Med.386, 556–567 (2022). - PubMed
    1. Masuda, N. et al. Adjuvant Capecitabine for Breast Cancer after Preoperative Chemotherapy. N. Engl. J. Med.376, 2147–2159 (2017). - PubMed
    1. Tutt, A. N. J. et al. Adjuvant Olaparib for Patients with BRCA1- or BRCA2-Mutated Breast Cancer. N. Engl. J. Med.384, 2394–2405 (2021). - PMC - PubMed
    1. Paik, S. et al. A multigene assay to predict recurrence of tamoxifen-treated, node-negative breast cancer. N. Engl. J. Med.351, 2817–2826 (2004). - PubMed

LinkOut - more resources