. 2025 Mar 8;8(1):398.
doi: 10.1038/s42003-025-07709-5.

Transcriptional dynamics in type 2 diabetes progression is linked with circadian, thermogenic, and cellular stress in human adipose tissue

Affiliations

Transcriptional dynamics in type 2 diabetes progression is linked with circadian, thermogenic, and cellular stress in human adipose tissue

Irais Rivera-Alvarez et al. Commun Biol. .

Erratum in

Abstract

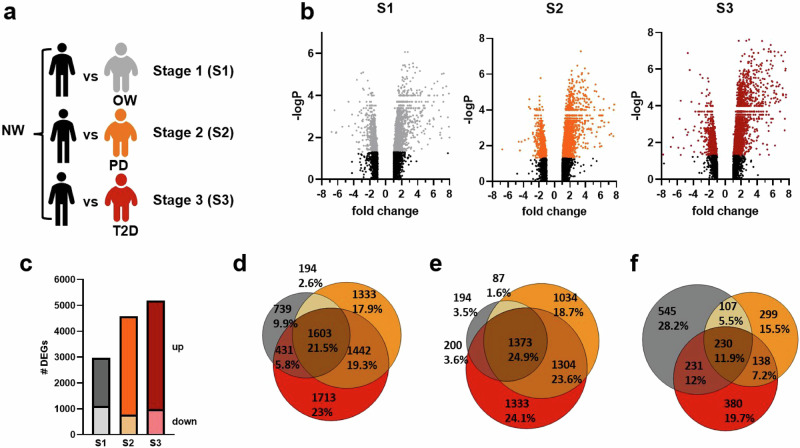
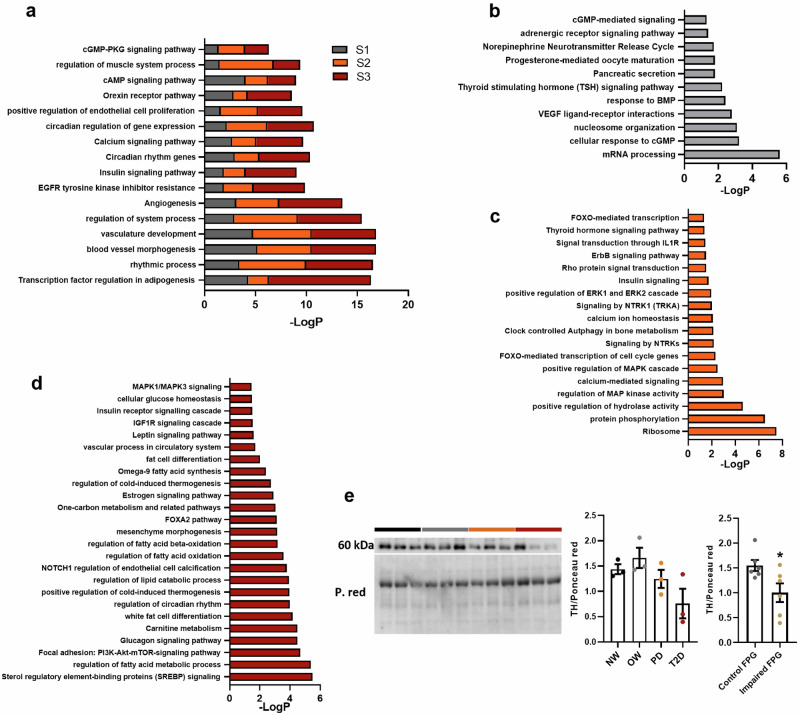
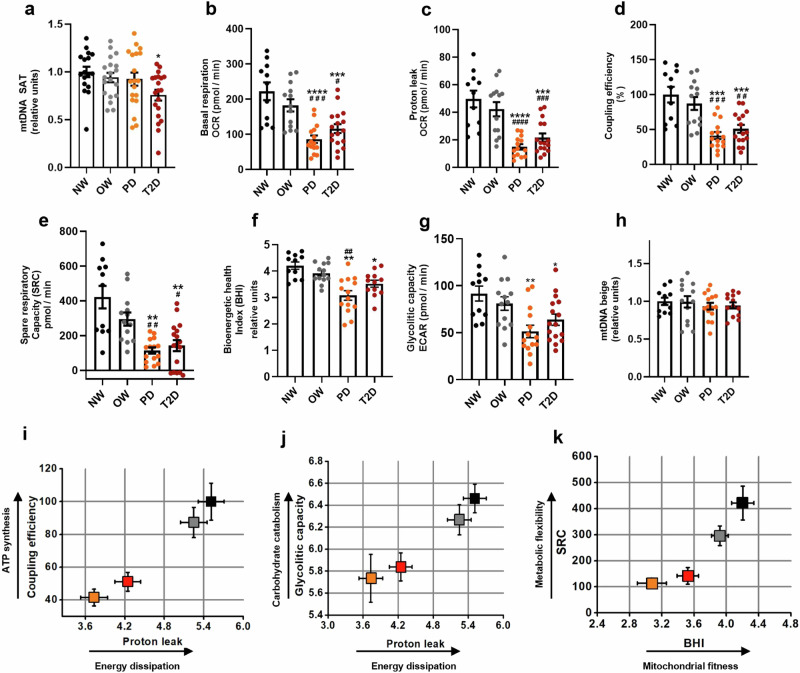
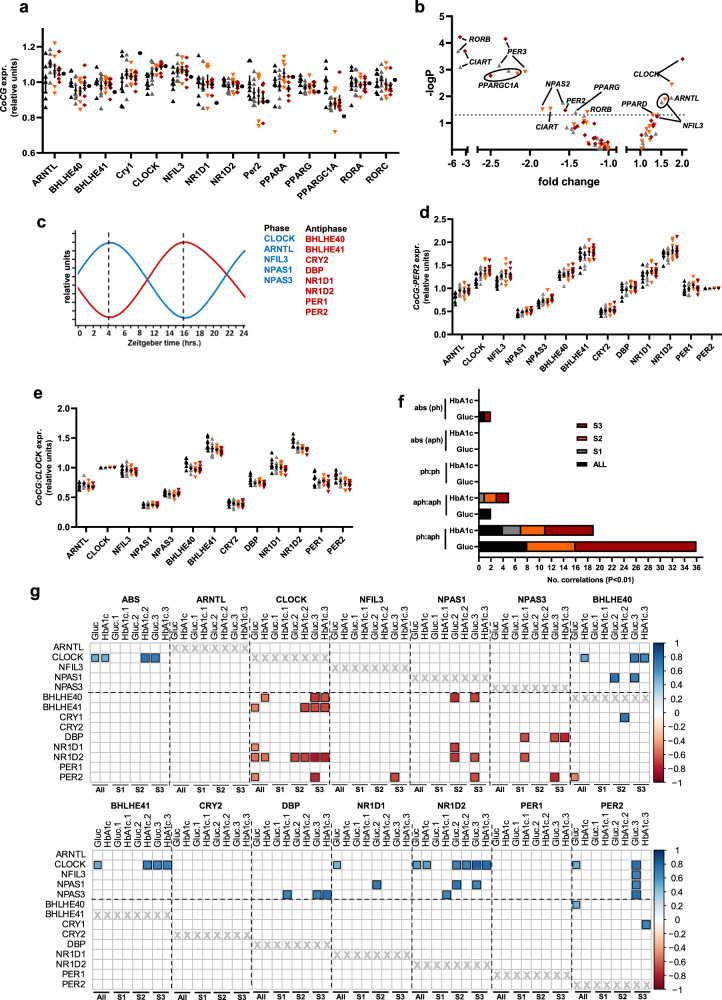
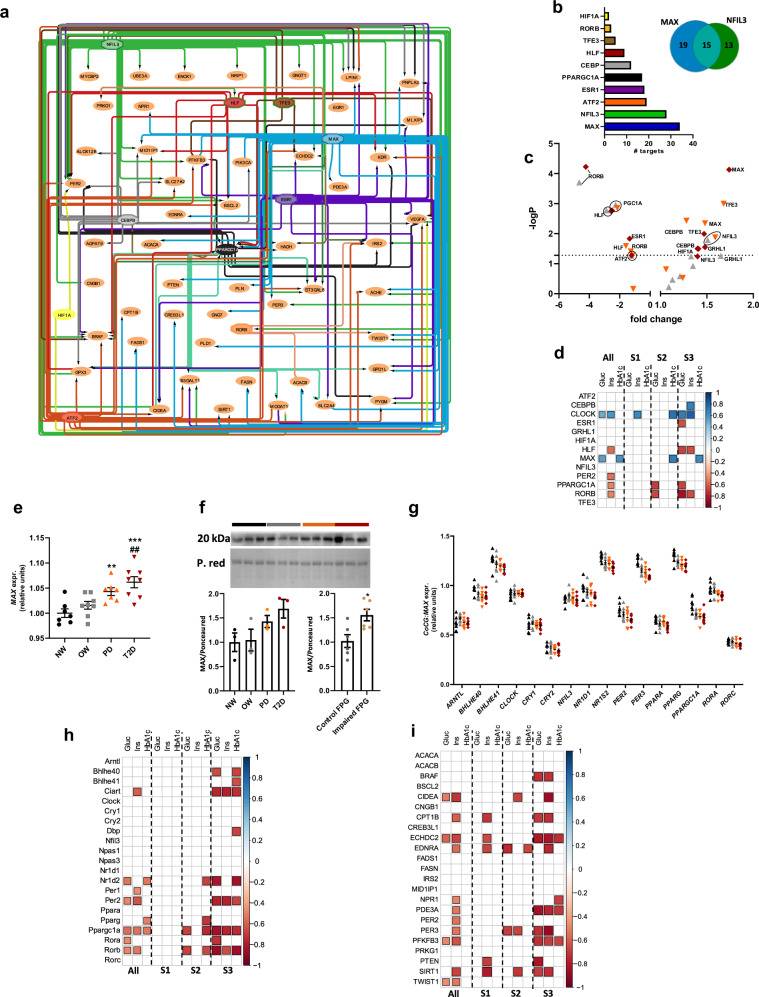
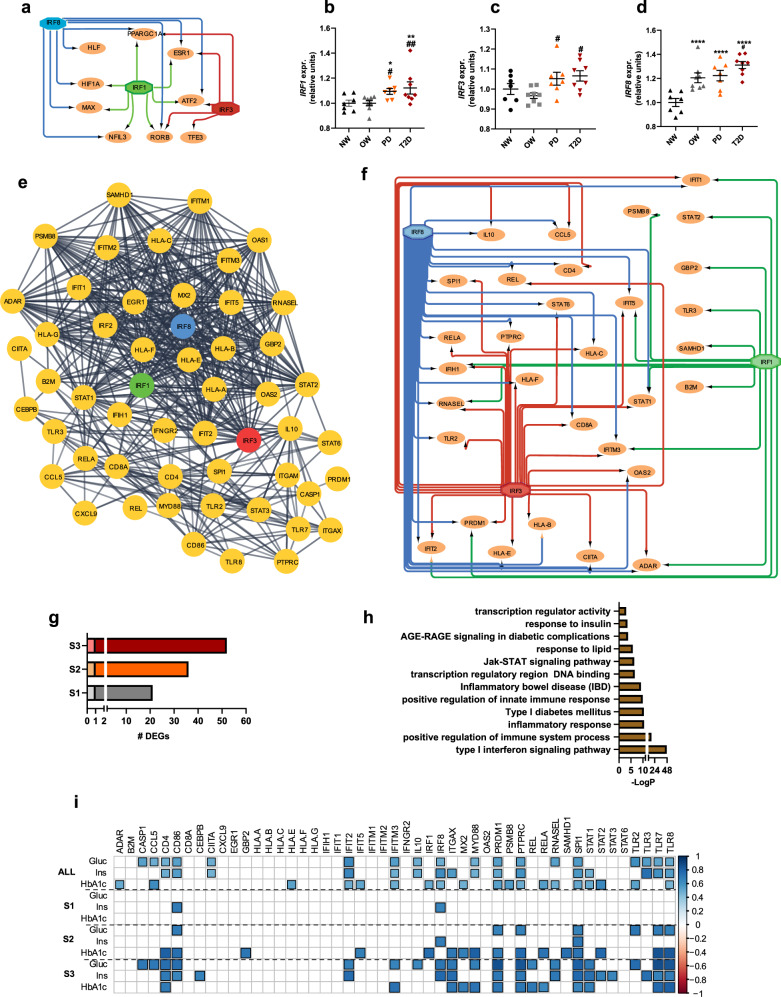
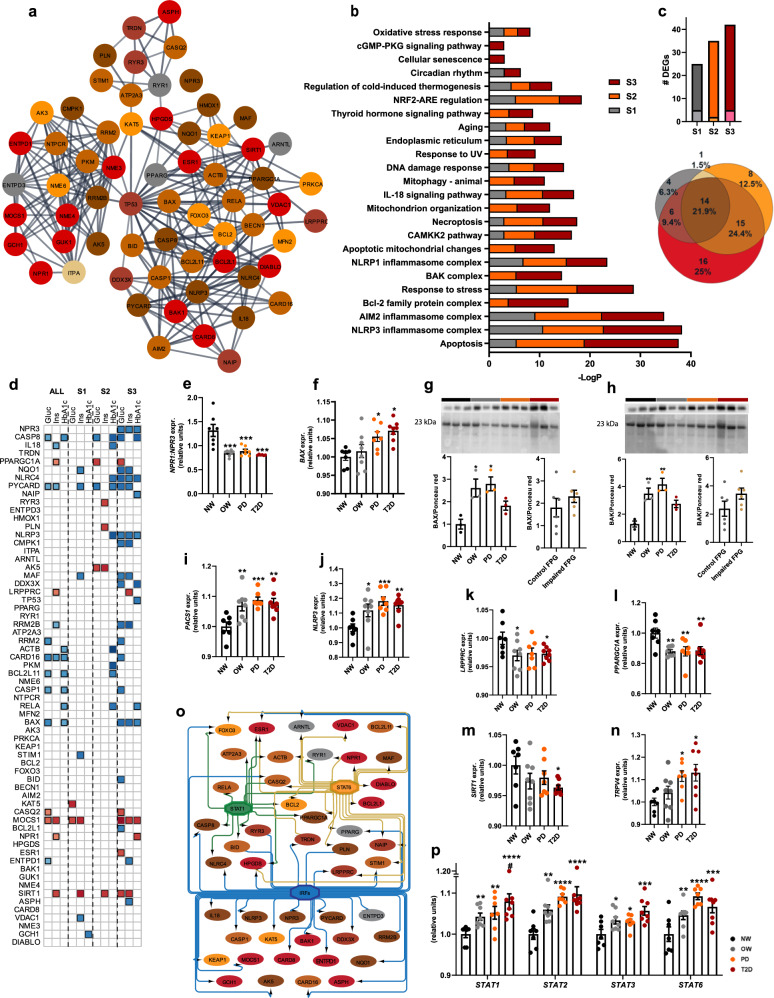
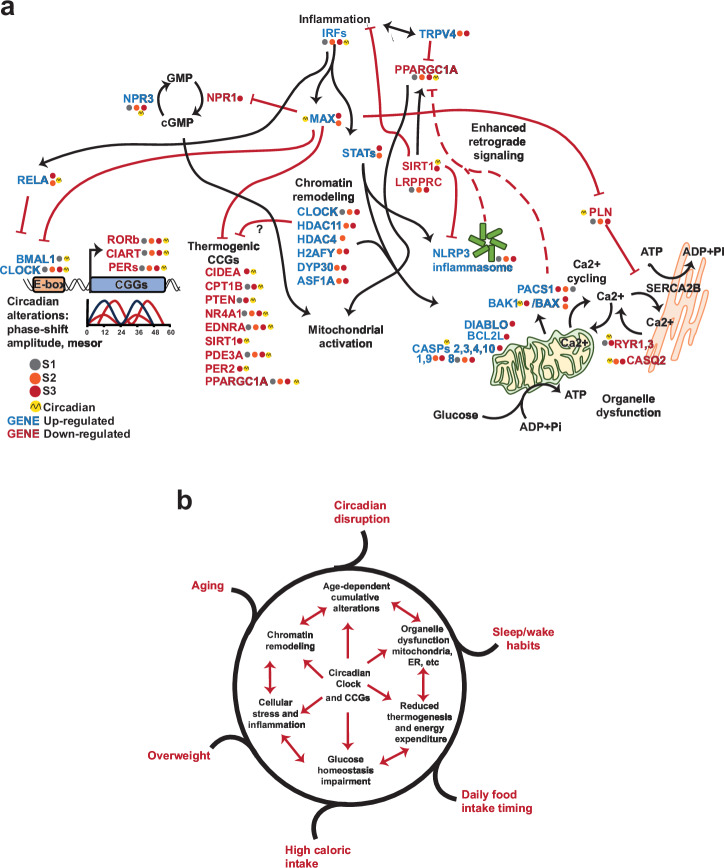
The prevalence of type 2 diabetes (T2D) has increased significantly over the past three decades, with an estimated 30-40% of cases remaining undiagnosed. Brown and beige adipose tissues are known for their remarkable catabolic capacity, and their ability to diminish blood glucose plasma concentration. Beige adipose tissue can be differentiated from adipose-derived stem cells or through transdifferentiation from white adipocytes. However, the impact of T2D progression on beige adipocytes' functional capacity remains unclear. Transcriptomic profiling of subcutaneous adipose tissue biopsies from healthy normal-weight, obese, prediabetic obese, and obese subjects diagnosed with T2D, reveals a progressive alteration in cellular processes associated with catabolic metabolism, circadian rhythms, thermogenesis-related signaling pathways, cellular stress, and inflammation. MAX is a potential transcription factor that links inflammation with the circadian clock and thermogenesis during the progression of T2D. This study unveils an unrecognized transcriptional circuit that increasingly disrupts subcutaneous adipose tissue oxidative capacity during the progression of T2D. These findings could open new research venues for developing chrono-pharmaceutical strategies to treat and prevent T2D.


Conflict of interest statement

Competing interests: The authors declare no competing interest. Ethics statement: This study was conducted in accordance with the principles of the Declaration of Helsinki. The research protocol was reviewed and approved by the Ethics Committees of the Instituto Nacional de Medicina Genómica and the Instituto Nacional de Ciencias Médicas y Nutrición Salvador Zubirán. All subjects were informed about the purpose and procedures of the study and signed an informed consent to participate. All ethical regulations relevant to human research participants were followed.

Figures

Fig. 1
Fig. 1. Transcriptional alterations occur during the progression of T2D.
a Normal-weight individuals (NW) (n = 7) were compared with overweight/obese (OW) individuals (S1) (n = 8), OW with prediabetes (PD) (S2) (n = 7), and OW with type 2 diabetes (T2D) (S3) (n = 8). b-c Volcano plots depict the identified DEGs in each stage and the number of up- or down-regulated DEGs in OW (S1), PD (S2), and T2D (S3), (P < 0.05, |log2(Fold Change)|>1.1). d–f Venn diagrams illustrate shared and exclusive DEGs in each stage.
Fig. 2
Fig. 2. Catabolic and thermogenic genes are downregulated during the progression of T2D.
a-d Significantly enriched biological functions in each stage, from the down-regulated DEGs (P < 0.05, |log2(Fold Change)|>1.1) in S1 (OW), S2 (PD), and S3 (T2D). e Tyrosine hydroxylase (TH) protein levels on SAT from NW (black), OW (gray), PD (orange), and T2D (red) individuals; TH protein levels bar graph, one-way ANOVA followed by Tukey´s post-hoc test (n = 3). TH protein levels on SAT from control (dark gray) and Impaired Fasting Plasma Glucose (FPG) (dark gold) individuals, t-test (*P < 0.05) (n = 6). Error bars as mean ± SEM.
Fig. 3
Fig. 3. Respiratory capacity is impaired in beige adipocytes during the progression of T2D.
a Relative mitochondrial DNA content in SAT, NW (n = 17), OW (n = 19), PD (n = 19), T2D (n = 22), independent samples. b Basal respiration, c Proton leak, d Coupling efficiency, e Spare respiratory capacity (SRC), f Bioenergetic health index (BHI), g Glycolytic capacity. NW (n = 11), OW (n = 13), PD (n = 16), T2D (n = 17), h Relative mitochondrial DNA content in differentiated beige adipocyte NW (n = 12), OW (n = 14), PD (n = 16), T2D (n = 16), independent samples. One-way ANOVA followed by Tukey’s post-hoc test (a-d, h), Kruskal-Wallis with Dunn´s (g), One way ANOVA with Welch´s correction followed by Dunnett´s T3 (f) and Welch ANOVA with Dunnett’s T3 (e). Significant difference vs. NW group *P < 0.05, **P < 0.01, ***P < 0.001, ****P < 0.0001. Significant difference vs. OW group #P < 0.05, ##P < 0.01, ###P < 0.001, ####P < 0.0001. i-k Bioenergetic phenotype, NW (n = 11), OW (n = 13), PD (n = 16), T2D (n = 17). Error bars as mean ± SEM.
Fig. 4
Fig. 4. Increasing alterations of the circadian clock genes during the progression of T2D.
a Gene expression of the main core-clock genes (CoCGs) on each group. b Differential expression of CoCGs known to be expressed in antiphase. c Representative plot of the phase and antiphase CoCGs. d Ratio of CoCG:PER2 gene expression, and e CoCG:CLOCK. f Significant correlations (P < 0.01) for absolute (abs) values (ph or aph), or ratio between phase (ph) or antiphase (aph) CoCG, and glucose (Glu) or HbA1c. g Correlation heatmap from absolute (ABS) or ratio values of CoCGs, significant Spearman’s correlation coefficients (rho) were colored blue (positive) and red (negative), (P < 0.01), NW (n = 7), OW (n = 8), PD (n = 7), T2D (n = 8), independent samples. Error bars as mean ± SEM.
Fig. 5
Fig. 5. Dysregulation of circadian-expressed transcription factors involved in thermogenesis and T2D.
a Predicted transcription factors (TF) targeting interacting genes involved in thermogenesis and catabolism. b Bar graph of targets per TF, and Venn diagram depicting shared and exclusive targets for MAX and NFIL3. c Differential expression of TF per stage. d Correlation heatmap between gene expression and metabolism-related parameters (glucose, insulin, and HbA1c) per stage, significant Spearman’s correlation coefficients (rho) were colored blue (positive) and red (negative), (P < 0.01). e MAX relative expression, ANOVA with eBayes, significant difference vs. NW group **P < 0.01, ***P < 0.001, significant difference vs. OW group ##P < 0.01. f MAX protein levels on SAT from NW (black), OW (gray), PD (orange), and T2D (red) individuals; MAX protein levels bar graph, one-way ANOVA followed by Tukey´s post-hoc test (n = 3). MAX protein levels on SAT from control (dark gray) and Impaired Fasting Plasma Glucose (FPG) (dark gold) individuals, t-test (*P < 0.05) (n = 6). g Ratio of CoCG:MAX gene expression. Correlation heatmap between metabolism-related parameters (glucose, insulin, and HbA1c) h CoCG:MAX ratios, and i MAX target genes, per stage. Significant Spearman’s correlation coefficients (rho) were colored blue (positive) and red (negative), P < 0.01. NW (n = 7), OW (n = 8), PD (n = 7), T2D (n = 8), independent samples. Error bars as mean ± SEM.
Fig. 6
Fig. 6. Inflammation is linked to an impairment in the thermogenic program during the progression of T2D.
a Transcriptional network showing IRF1, IRF3, and IRF8 as regulators of the identified TFs targeting thermogenic genes. b-d IRF1, IRF3, and IRF8 relative expression, ANOVA with eBayes, significant difference vs. NW group *P < 0.05, **P < 0.01, ****P < 0.0001, significant difference vs. OW group #P < 0.05, ##P < 0.01. e Protein-protein interactome network depicting known proteins interacting with IRF1, IRF3, and IRF8. f Transcriptional network from interacting proteins illustrating the role of IRF1, IRF3, and IRF8 in their regulation. g Interactome DEGs per stage. h Significantly enriched pathways from the interactome. i Correlation heatmap between metabolism-related parameters (glucose, insulin, and HbA1c) and interactome genes per stage. Significant Spearman’s correlation coefficients (rho) were colored blue (positive) and red (negative), P < 0.01. NW (n = 7), OW (n = 8), PD (n = 7), T2D (n = 8), independent samples. Error bars as mean ± SEM.
Fig. 7
Fig. 7. Transcriptional response to organelle dysfunction during the progression of T2D.
a Protein-protein interaction network of cellular stress-related genes is dysregulated during the progression of T2D. b Significantly enriched pathways from the interactome per stage. c Bar graph of DEGs, from the interactome per stage, and Venn diagram depicting shared and exclusive DEGs. d Correlation heatmap between metabolism-related parameters (glucose, insulin, and HbA1c) and interactome genes per stage, significant Spearman’s correlation coefficients (rho) were colored blue (positive), P < 0.01. e NPR1/NPR3 expression ratio. One-way ANOVA, followed by Tukey’s post hoc test. Significant difference vs. NW group ***P < 0.001. g BAX and h BAK protein levels on SAT from NW, OW, PD, and T2D individuals. Bar graph protein levels on SAT from NW (black), OW (gray), PD (orange), and T2D (red) individuals, one-way ANOVA followed by Tukey´s post-hoc test (n = 3), *P < 0.05, **P < 0.01. Protein levels on SAT from control (dark gray) and Impaired Fasting Plasma Glucose (FPG) (dark gold) individuals, t-test (n = 6). f BAX, i PACS1, j NLRP3, k LRPPRC, l PPARGC1A, m SIRT1, n TRPV4, p STAT1, STAT2, STAT3 relative expression, ANOVA with eBayes, significant difference vs. NW group *P < 0.05, **P < 0.01, ****P < 0.0001, significant difference vs. OW group #P < 0.05. o Transcriptional network of the interacting proteins. NW (n = 7), OW (n = 8), PD (n = 7), T2D (n = 8), independent samples. Error bars as mean ± SEM.
Fig. 8
Fig. 8. Progressive accumulation of transcriptional alterations during the progression of T2D reduces adipocyte thermogenic capacity.
a Chronic inflammation under obese conditions, alters circadian gene expression through interferon-mediated responses of IRFs.In consequence, induces the expression of the NFKB p65 subunit RELA and the core clock transcription factor MAX at stages S2 and S3, disrupting the circadian translational transcriptional feedback loop (TTFL) mechanism, and affecting the expression of key CCGs. MAX, further exacerbates cellular dysfunction by repressing NPR1 and PLN, disrupting the pro-thermogenic cGMP signaling pathway, and impairing the Ca2+ cycling of the SERCA2-mediated futile cycle. The Ca2+ channel TRPV4 inhibits the expression of PPARGC1A and induces inflammation, which, in turn, activates the STATs transcription factors, inducing NLRP3-inflammasome and pro-apoptotic genes, leading to a mitochondrial-to-nucleus retrograde signaling (MTNRS), contributing to reduced mitochondrial oxidative capacity,. In later stages, MAX may negatively regulate SIRT1-mediated activation of PPARGC1A,– and the inhibition of the NLRP3-inflammasome,. Chromatin remodelers further regulate thermogenic and senescence-related genes,. b Environmental conditions induce a pro-inflammatory cascade, propelling a self-perpetuating vicious cycle that promotes cellular dysfunction, amplifies inflammation, and accumulates cellular and molecular defects, thereby exacerbating the progression of T2D.

References

    1. World Health Organization: Diabetes fact sheets, https://www.who.int/news-room/fact-sheets/detail/diabetes (2024).
    1. Cho, N. H. et al. IDF Diabetes Atlas: Global estimates of diabetes prevalence for 2017 and projections for 2045. Diab. Res. Clin. Pract.138, 271–281 (2018). - PubMed
    1. Vázquez-Lizarraga, R. et al. Hypothalamic circuits and aging: keeping the circadian clock updated. Neural Regenerat. Res. 10.4103 (2024). - PMC - PubMed
    1. Guilherme, A., Henriques, F., Bedard, A. H. & Czech, M. P. Molecular pathways linking adipose innervation to insulin action in obesity and diabetes mellitus. Nat. Rev. Endocrinol.15, 207–225 (2019). - PMC - PubMed
    1. Villarroya, F., Cereijo, R., Villarroya, J. & Giralt, M. Brown adipose tissue as a secretory organ. Nat. Rev. Endocrinol.13, 26–35 (2017). - PubMed