. 2025 Mar 8;32(1):34.
doi: 10.1186/s12929-025-01126-w.

IL-19 as a promising theranostic target to reprogram the glioblastoma immunosuppressive microenvironment

Affiliations

IL-19 as a promising theranostic target to reprogram the glioblastoma immunosuppressive microenvironment

Gilbert Aaron Lee et al. J Biomed Sci. .

Abstract

Background: Glioblastoma multiforme (GBM) is an aggressive brain tumor with chemoresistant, immunosuppressive, and invasive properties. Despite standard therapies, including surgery, radiotherapy, and temozolomide (TMZ) chemotherapy, tumors inevitably recur in the peritumoral region. Targeting GBM-mediated immunosuppressive and invasive properties is a promising strategy to improve clinical outcomes.

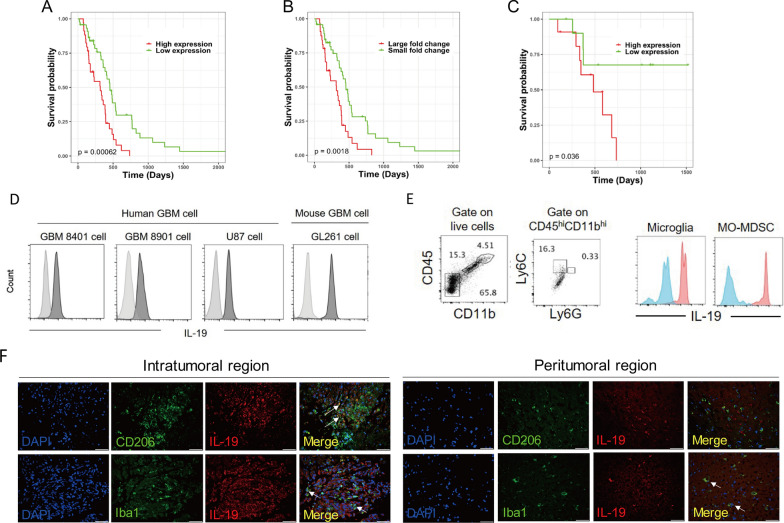
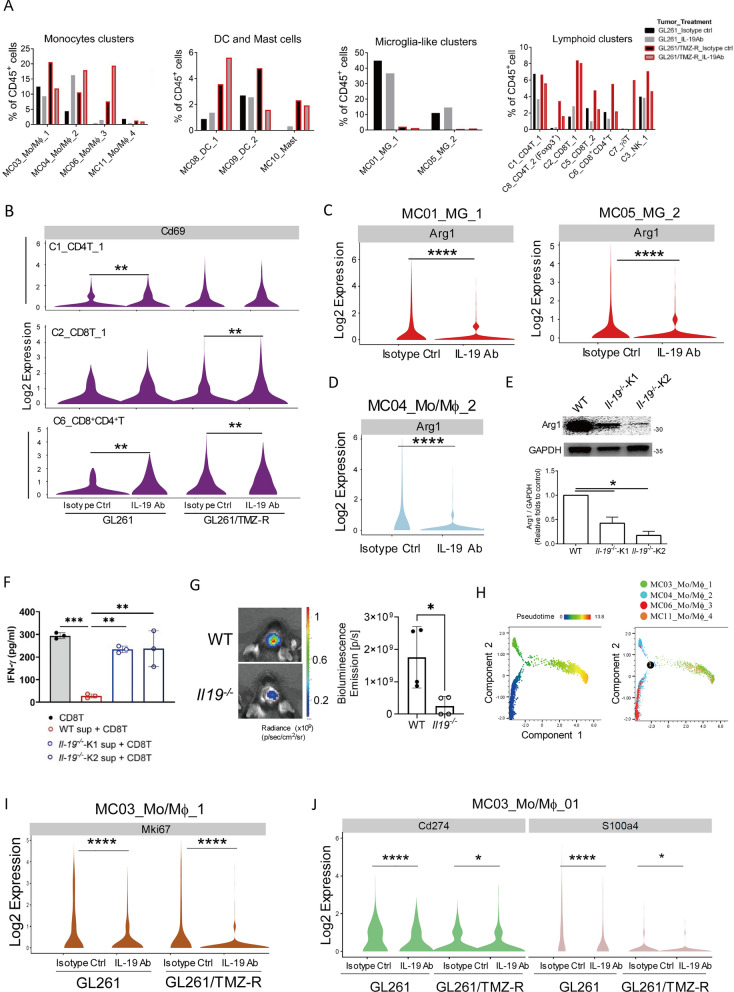
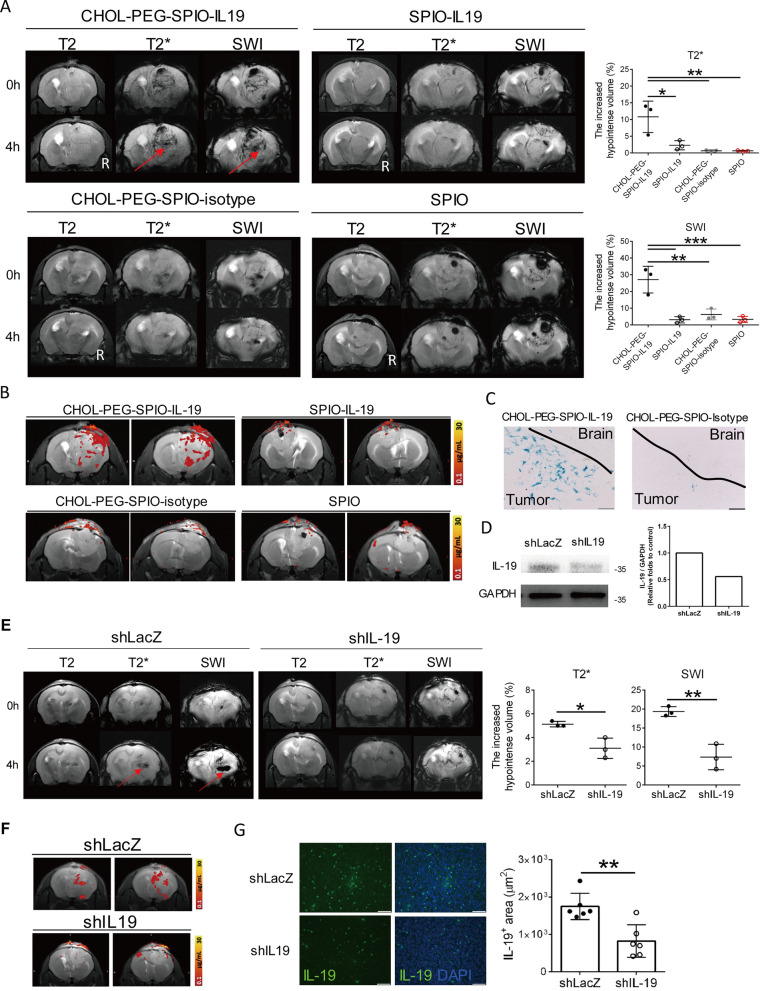
Methods: We utilized clinical and genomic data from the Taiwan GBM cohort and The Cancer Genome Atlas (TCGA) to analyze RNA sequencing data from patient tumor samples, determining the association of interleukin-19 (Il-19) expression with survival and immunosuppressive activity. Gene set enrichment analysis (GSEA) was performed to assess the relationship between the enrichment levels of immune subsets and Il-19 expression level, and Ingenuity Pathway Analysis (IPA) was used to predict immune responses. Cytokine array and single-cell RNA sequencing were used to examine the effects of IL-19 blockade on tumor immune microenvironment, including tumor-infiltrating leukocyte profiles, differentiation and immunosuppressive genes expression in tumor associated macrophages (TAM). CRISPR Il-19-/- cell lines and Il-19-/- mice were used to examine the role of IL-19 in tumor invasion and M2-like macrophage-mediated immunosuppression. Additionally, we developed novel cholesterol-polyethylene glycol-superparamagnetic iron oxide-IL-19 antibody nanoparticles (CHOL-PEG-SPIO-IL-19), characterized them using dynamic light scattering and transmission electron microscopy, Fourier-Transform Infrared spectroscopy, prussian blue assay, and conducted in vivo magnetic resonance imaging (MRI) in a human glioblastoma stem cell-derived GBM animal model.

Result: Genomic screening and IPA analysis identified IL-19 as a predicted immunosuppressive cytokine in the peritumoral region, associated with poor survival in patients with GBM. Blocking IL-19 significantly inhibited tumor progression of both TMZ-sensitive (TMZ-S) and TMZ-resistant (TMZ-R) GBM-bearing mice, and modulated the immune response within the GBM microenvironment. Single-cell transcriptome analysis reveal that IL-19 antibody treatment led to a marked increase in dendritic cells and monocyte/macrophage subsets associated with interferon-gamma signaling pathways. IL-19 blockade promoted T cell activation and reprogrammed tumor-associated macrophages toward weakened pro-tumoral phenotypes with reduced Arginase 1 expression. Il19-/- M2-like bone marrow-derived macrophages with lower Arginase 1 level lost their ability to suppress CD8 T cell activation. These findings indicated that IL-19 suppression limits TAM-mediated immune suppression. Molecular studies revealed that IL-19 promotes TMZ-resistant GBM cell migration and invasion through a novel IL-19/WISP1 signaling pathway. For clinical translation, we developed a novel CHOL-PEG-SPIO-IL-19 nanoparticles to target IL-19 expression in glioblastoma tissue. MRI imaging demonstrated enhanced targeting efficiency in brain tumors, with in vivo studies showing prominent hypointense areas in T2*-weighted MRI scans of tumor-bearing mice injected with CHOL-PEG-SPIO-IL-19, highlighting nanoparticle presence in IL-19-expressing regions. Prussian blue staining further confirmed the localization of these nanoparticles in tumor tissues, verifying their potential as a diagnostic tool for detecting IL-19 expression in glioblastoma. This system offers a theranostic approach, integrating diagnostic imaging and targeted therapy for IL-19-expressing GBM.

Conclusion: IL-19 is a promising theranostic target for reversing immunosuppression and restricting the invasive activity of chemoresistant GBM cells.

Keywords: Glioblastoma; IL-19; Temozolomide.


Conflict of interest statement

Declarations. Ethics approval and consent to participate: This study was approved by the Institutional Review Board of Taipei Medical University (no. N201603086). All animal care and experimental procedures were approved by the Ethics Committee of Taipei Medical University and conducted in strict accordance with the ARRIVE Guidelines. Consent for publication: Not applicable. Competing interests: The authors declare no competing interests.

Figures

Fig. 1
Fig. 1
IL-19 expression in tumor associated with poor prognosis in patients with GBM. A Survival probability of patients with GBM in two groups with high (n = 34) and low IL-19 (n = 45) expression obtained from RNA-seq data in TCGA database. B Survival probability of patients with GBM in two groups with large (n = 32) and small (n = 47) log2 fold change in relative IL-19 expression to TATA-binding protein expression level observed from RNA microarray data in TCGA database and in C large fold change group (n = 11) and low fold change group (n = 11) in Taiwan GBM study cohort. The p values for the log-rank test are indicated in the survival probability graph. D IL-19 expression levels in human GBM cell lines (GBM8401, GBM8901, and U87 cells) and murine GBM cell line (GL261) were determined through flow cytometry. Light-gray histogram represents isotype control antibody staining. E Flow cytometric gating for tumor-infiltrating microglia (CD45dimCD11bdim) and MO-MDSCs (CD45hiCD11bhiLy6C+Ly6G) in GL261 tumor–bearing mice. Blue histogram represents isotype control antibody staining to examine IL-19 expression level in brain-infiltrating lymphocytes. F Immunofluorescent staining of the IL-19 (red), M2 TAM Marker CD206 (green) and the pan-macrophage/microglia marker Iba1 (green) in intratumoral and peritumoral region of human GBM tissue. White arrows indicate CD206+IL-19+ or Iba1+IL-19+ cells. Scale bar: 50 μM
Fig. 2
Fig. 2
IL-19 expression is associated with immunosuppressive response in patients with GBM. A Site-specific tissue samples, including intratumoral solid T1 contrast-enhanced tissue (T1 + C) and peritumoral region tissue, were collected from patients with GBM in Taiwan through image-guided stereotactic biopsy. Representative T1 + C and apparent diffusion coefficient map (ADC) images of GBM in human brain are presented. B Heat map of IL-19 expression and normalized enrichment level of TH responses in peritumoral region (n = 24). Value of correlation coefficient between IL-19 expression and TH response and p values are provided in the table. C High IL-19 expression in peritumoral region was associated with immunosuppressive responses in patients with GBM in Taiwan. Immune-related signaling pathway was predicted using IPA. D Bar graph of Z-score and p values of predicted immune-related pathways. E Heatmap of CTL- and MDSC-normalized enrichment scores in peritumoral region with high and low IL-19 expression. F Ratio of enrichment score of CTL to MDSC and G CYT score in peritumoral tissue with high (n = 11) and low (n = 3) IL-19 expression. Statistical analysis comprised the Mann–Whitney U test; **p < 0.01. H Gene expression value (Z-score transformed) of WISP1 in the tumor tissue with high (n = 47) and low IL-19 (n = 48) expression from microarray data of TCGA database are shown in the bar graph
Fig. 3
Fig. 3
Effects of blocking IL-19 on TMZ-sensitive and TMZ-resistant GBM progression and cytokine profile in tumor microenvironment. A Survival differences in glioma-bearing mice between isotype control groups and IL-19 antibody treatment groups were determined using the Kaplan–Meier method; n = 8 in each group. B Tumor size in GL261 and C GL261/TMZ-R tumor-bearing mice treated with isotype control or IL-19 antibody was determined through IVIS assay; n = 8 in each group. D GL261 tumor-bearing mice received isotype control antibody or IL-19 antibody treatment. Tumor tissue lysates were harvested on post–tumor inoculation day 28, and cytokine array analysis was performed. Significant differences in TH1 and TH2 cytokine expression levels between the isotype control antibody and IL-19 antibody treatment groups are indicated by red rectangles. Reference spots indicate that array was incubated with streptavidin–horseradish peroxidase during assay procedure. Quantification of TH1-related cytokine (TNF-α, IFN-γ, and IL-12) and TH2 cytokine (IL-4, IL-5, and IL-13) expression levels and tumor invasion (WISP1 and IL-33) presented in bar graphs; *p < 0.05
Fig. 4
Fig. 4
Single-cell transcriptome analysis of tumor-infiltrating immune cells in TMZ-sensitive and TMZ-resistant GBM. A UMAP plots of lymphoid and myeloid cells from tumor-infiltrating leukocytes and microglia. A total of 26,039 tumor-infiltrating CD45+ cells were harvested on post–tumor inoculation day 28, and scRNA-seq analysis was performed. A total of 6,150 cells from four lymphoid clusters were divided into nine lymphoid clusters (C1–C9). A total of 19,889 tumor-infiltrating CD45+ cells from 10 myeloid clusters were divided into 12 clusters (10 myeloid clusters and two B cell clusters). B Bubble plot map of expression patterns of selected marker genes across indicated lymphoid clusters and C myeloid clusters. Color scale depicts expression level. D UMAP plots of lymphoid and E myeloid cells from GL261 and GL261/TMZ-R GBM-bearing mice treated with isotype control antibody or IL-19 antibody. F Proportions of B cells (BCs), TCs, NK cells, microglia (MG), monocytes/macrophages (Mo/Mϕ), DCs, MCs in GL261 and GL261/TMZ-R treated with isotype control or IL-19 antibody
Fig. 5
Fig. 5
Blocking IL-19 reprogrammed GBM tumor-infiltrating monocyte/macrophage differentiation and disrupted Arg1-mediated CD8 T cell suppression. A Percentage of each cluster in tumor-infiltrating CD45+ cells from GL261 and GL261/TMZ-R GBM-bearing mice treated with isotype control antibody or IL-19 antibody. B Violin plot analysis of Cd69 expression levels in T cell clusters (C1, C2, and C6) in GL261 and GL261/TMZ-R tumor-bearing mice treated with isotype control or IL-19 antibody; Wilcoxon test; **p < 0.01. C Violin plot analysis of Arg1 expression in microglia (MC01_MG_1, MC05_MG_2). D Violin plot analysis of Arg1 expression in the TAM-like subset. Wilcoxon test; ****p < 0.0001. E Expression of Arg1 in BMDMs from WT and IL-19KO mice (Il-19−/− K1 and Il-19−/− K2) analyzed by Western blot. F Effect of Il-19−/− M2-like BMDM supernatant on CD8+ T cell activation. WT and Il-19−/− M2-like BMDM supernatants were used to culture CD8+ T cells for 72 h in the presence of antibiotin microbeads and biotinylated CD3 and CD28 antibodies. IFN-γ levels produced by CD8+ T cells were determined by ELISA. G GL261 tumor progression in WT and Il-19−/− mice, determined by IVIS imaging on post-tumor inoculation day 28; n = 4 in each group. *p < 0.05. H Differentiation trajectories of tumor-infiltrating macrophage/monocyte subpopulations. I Expression of the proliferation marker Ki67 and J Immunosuppressive genes (Cd274 and S100a4) in tumor-infiltrating macrophages/monocytes (MC03_Mo/Mϕ_1); Wilcoxon test; *p < 0.05, ****p < 0.0001
Fig. 6
Fig. 6
Effects of IL-19 on TMZ-resistant GBM migration and invasion. A Expression levels of IL-19, IL-20RA, and IL-20RB in DBTRG and DBTRG/TMZ-R cells were analyzed by Western blot. B Human GBM cell (U118) and TMZ-resistant cells (GL261/TMZ-R, DBTRG/TMZ-R) were treated with IL-19 (100 ng/mL) for various duration and WISP1 expression was analyzed through Western blotting. C Effect of blocking WISP1 on IL-19-induced GBM cell migration and invasion. U118 and DBTRG/TMZ-R cells were treated with IL-19 (100 ng/mL) in the presence of isotype ctrl. or WISP1 antibodies (1 μg/mL) for 24 h, and invasion was analyzed through a Matrigel-coated transwell migration assay; n = 8, one-way ANOVA; ****p < 0.0001. Scale bar: 50 μM. D The effect of AKT inhibitor IV (1 μM) on IL-19/WISP1 signaling pathway of U118 cells in the presence of absence of IL-19 (100 ng/mL) for 2 h. Expression level of pAKT, p-β-catenin, WISP1, and GAPDH were determined by Western blot. E Effects of Il-19 KO on migration and invasion of GL261/TMZ-R cells. Migration and invasion ability of Ctrl and two Il-19 KO clones (KO#1 and KO#2) were determined through Matrigel-coated transwell migration assay; n = 3, one-way ANOVA; **p < 0.01, ***p < 0.001. F IL-19, pAKT, WISP1, and GAPDH expression levels in Ctrl and IL-19 KO GL261/TMZ-R cells were determined by Western blot
Fig. 7
Fig. 7
CHOL-PEG-SPIO-IL19 Synthesis process and characterization in vitro. A Synthetic scheme of IL-19 antibodies and CHOL-PEG polymer conjugated with amino-coated SPIO nanoparticles. 1. Amino-coated SPIO nanoparticles were modified with maleimide through reaction with sulfo-SMCC. 2. IL-19 antibodies were thiolated with iminothiolane, and TCEP was added to reduce disulfide bonds. 3. The maleimide-functionalized SPIO nanoparticles were mixed with the thiolated antibody solution and CHOL-PEG polymer to form CHOL-PEG and antibody-conjugated SPIO nanoparticles. B The size distributions of CHOL-PEG-SPIO-IL19 and unconjugated SPIO nanoparticles were determined through DLS measurement, as shown on the volume distribution graph. C TEM images of unconjugated SPIO and CHOL-PEG-SPIO-IL19 (scale bar = 20 nm). Statistical analysis indicated a significant difference among the particle size of CHOL-PEG-SPIO-IL19 and SPIO nanoparticles (n = 10 per group). D FT-IR spectrum of CHOL-PEG, IL-19 antibody, CHOL-PEG-SPIO-IL19 and unconjugated SPIO nanoparticles. The IR spectrum of Cholesterol-PEG polymer is characterized by peak at approximately 2854 cm−1 due to C-H stretching. E Evaluation of CHOL-PEG-SPIO-IL19 nanoparticles targeting specificity through IF staining. DBTRG cells were incubated with IL-19 antibodies, isotype control antibodies (mouse IgG2b antibody), SPIO nanoparticles, and CHOL-PEG-SPIO-IL19 nanoparticles, and then stained with FITC goat anti-mouse IgG2b antibodies. Green, IL-19; blue, DAPI. F Flow cytometry analysis for intracellular IL-19 expression in human GBM cells by using CHOL-PEG-SPIO-IL19 nanoparticles. DBTRG cells were stained with SPIO nanoparticles, CHOL-PEG-SPIO-IL19 nanoparticles, IL-19 antibodies, or isotype control antibodies (mouse IgG2b antibody) and then stained with FITC goat anti-mouse IgG2b antibodies. G Detection of CHOL-PEG-SPIO-IL19 in T2-weighted MRI images. Echo time curve fitting of CHOL-PEG-SPIO-IL19 phantoms in various known concentrations was measured using 7 T MRI. T2 relaxation time of CHOL-PEG-SPIO-IL19 in known Fe concentrations (n = 3 for each concentration). Corresponding signal intensity images of CHOL-PEG-SPIO-IL19 standards (0–15.7 μg/mL) measured using T2-weighted images
Fig. 8
Fig. 8
In vivo MRI detection of IL-19 expression in human GSC-derived tumor-bearing mice. A In vivo MRI detection of CHOL-PEG-SPIO-IL-19 nanoparticles in human GSC-derived tumor-bearing mice on tumor inoculation day 13. T2-weighted, T2*-weighted, and SWI images of tumor-bearing mice before (0 h) and 4 h after intravenous injection with CHOL-PEG-SPIO-IL-19, SPIO-IL-19, CHOL-PEG-SPIO-isotype, and SPIO nanoparticles (50 μg/mouse) are shown. Red arrows indicate the increased hypointense areas in the tumor. The letter “R” indicates the right side of the brain. The increased percentage of the hypointense volume in the tumor after nanoparticle injection was quantified. n = 3. **p < 0.01, ***p < 0.005 B Representative two consecutive T2*-weighted MRI images from tumor-bearing mice after injection with CHOL-PEG-SPIO-IL-19, SPIO-IL-19, CHOL-PEG-SPIO-isotype, and SPIO nanoparticles (50 μg/mouse). n = 3. C Detection of iron in CHOL-PEG-SPIO-IL-19 and CHOL-PEG-SPIO-isotype-treated tumor-bearing mice using a Prussian blue assay. Blue staining indicates the presence of iron in the tissues. n = 3. Scale bar: 50 μM. D Immunoblot analysis of IL-19 expression in human GSCs following lentiviral transduction with LacZ shRNA (shLacZ) or IL-19-targeting shRNA. E In vivo MRI detection of CHOL-PEG-SPIO-IL-19 nanoparticles in human shLacZ and shIL-19 GSC-derived tumor-bearing mice on tumor inoculation day 13. T2-weighted, T2*-weighted, and SWI images of tumor-bearing mice before (0 h) and 4 h after intravenous injection with CHOL-PEG-SPIO-IL-19 (50 μg/mouse) are shown. Red arrows indicate the increased hypointense areas in the tumor. The increased percentage of the hypointense volume in the whole tumor after CHOL-PEG-SPIO-IL-19 nanoparticle injection was quantified. *p < 0.05, **p < 0.01. F Representative two T2*-weighted MRI consecutive images from shLacZ and shIL-19 GSC-derived tumor-bearing mice after injection with CHOL-PEG-SPIO-IL-19 nanoparticles (50 μg/mouse). n = 3. G Immunofluorescent staining of the IL-19 in shLacZ and shIL-19 GSC-derived tumor tissue. IL-19+ areas in shLacZ and shIL-19 tumor were quantified. **p < 0.01 Scale bar: 50 μM

References

    1. Abdelfattah N, Kumar P, Wang C, Leu JS, Flynn WF, Gao R, Baskin DS, Pichumani K, Ijare OB, Wood SL, Powell SZ, Haviland DL, Parker Kerrigan BC, Lang FF, Prabhu SS, Huntoon KM, Jiang W, Kim BYS, George J, Yun K. Single-cell analysis of human glioma and immune cells identifies S100A4 as an immunotherapy target. Nat Commun. 2022;13(1):767. - PMC - PubMed
    1. Abedalthagafi M, Barakeh D, Foshay KM. Immunogenetics of glioblastoma: the future of personalized patient management. NPJ Precis Oncol. 2018;2:27. - PMC - PubMed
    1. Azuma YT, Matsuo Y, Kuwamura M, Yancopoulos GD, Valenzuela DM, Murphy AJ, Nakajima H, Karow M, Takeuchi T. Interleukin-19 protects mice from innate-mediated colonic inflammation. Inflamm Bowel Dis. 2010;16(6):1017–28. - PubMed
    1. Bergmann N, Delbridge C, Gempt J, Feuchtinger A, Walch A, Schirmer L, Bunk W, Aschenbrenner T, Liesche-Starnecker F, Schlegel J. The intratumoral heterogeneity reflects the intertumoral subtypes of glioblastoma multiforme: a regional immunohistochemistry analysis. Front Oncol. 2020;10:494. - PMC - PubMed
    1. Cantini G, Pisati F, Mastropietro A, Frattini V, Iwakura Y, Finocchiaro G, Pellegatta S. A critical role for regulatory T cells in driving cytokine profiles of Th17 cells and their modulation of glioma microenvironment. Cancer Immunol Immunother. 2011;60(12):1739–50. - PMC - PubMed