. 2025 Mar 8;22(1):71.
doi: 10.1186/s12974-025-03388-5.

Neuroinflammation causes mitral cell dysfunction and olfactory impairment in a multiple sclerosis model

Affiliations

Neuroinflammation causes mitral cell dysfunction and olfactory impairment in a multiple sclerosis model

Charlotte Schubert et al. J Neuroinflammation. .

Abstract

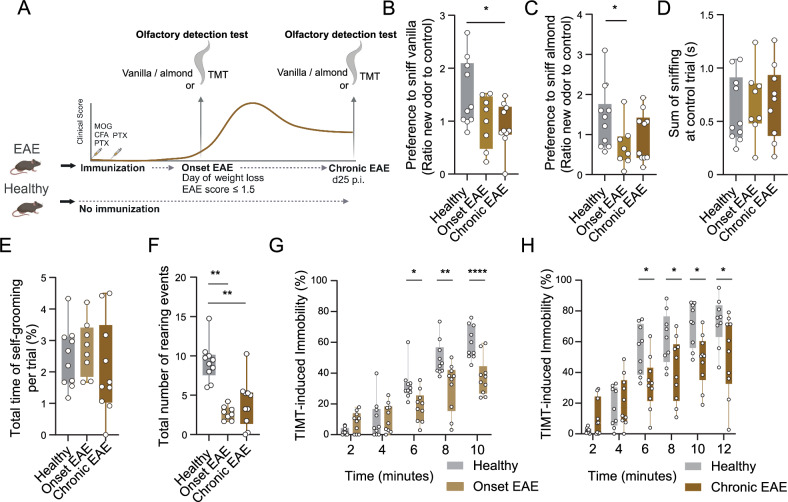
Background: Olfactory dysfunction is an underestimated symptom in multiple sclerosis (MS). Here, we examined the pathogenic mechanisms underlying inflammation-induced dysfunction of the olfactory bulb using the animal model of MS, experimental autoimmune encephalomyelitis (EAE).

Results: Reduced olfactory function in EAE was associated with the degeneration of short-axon neurons, immature neurons, and both mitral and tufted cells, along with their synaptic interactions and axonal repertoire. To dissect the mechanisms underlying the susceptibility of mitral cells, the main projection neurons of the olfactory bulb, we profiled their responses to neuroinflammation by single-nucleus RNA sequencing followed by functional validation. Neuroinflammation resulted in the induction of potassium channel transcripts in mitral cells, which was reflected in increased halothane-induced outward currents of these cells, likely contributing to the impaired olfaction in EAE animals.

Conclusion: This study reveals the crucial role of mitral cells and their potassium channel activity in the olfactory bulb during EAE, thereby enhancing our understanding of neuroinflammation-induced neurodegeneration in MS.

Keywords: Experimental autoimmune encephalomyelitis; Mitral cells; Monoatomic ion channel activity; Multiple sclerosis; Neuroinflammation; Olfactory bulb; Potassium channels; Single-nucleus RNA sequencing; TASK-2.


Conflict of interest statement

Declarations. Ethics approval and consent to participate: Not applicable. Consent for publication: Not applicable. Competing interests: The authors declare no competing interests.

Figures

Fig. 1
Fig. 1
EAE impairs olfaction during the early and chronic phases of the disease. A Study design of two different behavioral olfactory tests. Examinations were done at onset of EAE (n = 8) and during chronic EAE (n = 10) compared to the healthy group (n = 10). Visualization done with Biorender. B Preference to sniff the new odor vanilla during trial 2 of the odor discrimination test in healthy mice (n = 10), during onset of EAE (d9 p.i., n = 8) and chronic EAE (d25 p.i., n = 10). Unpaired, two-tailed Student's t-test was performed for statistical analysis. C Preference to sniff the new odor almond during trial 3 in percentage in comparison to a control odor exposed to healthy mice (n = 10) as well as at the onset of EAE (d9 p.i., n = 8) and during chronic EAE (d25 p.i., n = 10). Unpaired, two-tailed Student's t-test was performed for statistical analysis. D–F Total time sniffing D and self-grooming E and number of rearing events F in the first trial of the odor discrimination test in healthy mice (n = 10), EAE mice at disease onset (d9 p.i., n = 8) and during the chronic EAE phase (d25 p.i., n = 10). Unpaired, two-tailed Student's t-test was performed for statistical analysis. G, H Percentage of time the mice were immobile after exposure to 2,5-dihydro-2,4,5-trimethylthiazoline (TMT), measured in 2 min bins, in healthy mice (n = 10) and at the onset of EAE (n = 10) G, as well as in healthy mice (n = 9) and in mice during the chronic phase of EAE (n = 10) H. Graphs show the posthoc test after performance of REML mixed-effects model with Šídák multiple comparison. *P < 0.05, **P < 0.01, ***P < 0.001
Fig. 2
Fig. 2
Immune cell infiltration and glial cell activation in the olfactory bulb during EAE. A–C Representative image with zoom-in (enlarged section displayed by frame in overview image) and quantification of A CD3+ cells infiltrating, (B) CD45+ macrophages and (C) Iba1+ microglia in the main olfactory bulb (coronar orientation) in healthy mice and at the acute phase of EAE (d15 p.i.) (n = 5 per group). Scale bar = 50 µm. D Localization of microglial activation measured by the ratio of microglial cell number per mm2 in the lower caudal part of the olfactory bulb compared to the upper cranial part of the olfactory bulb in healthy mice and at the acute phase of EAE (n = 5 per group). E Representative images with zoom-in (enlarged section displayed by frame in overview image) and quantification per mm2 of GFAP+ astrocytes in the olfactory bulb of healthy mice and at the acute phase of EAE (n = 5 per group). Scale bar = 50 µm. F UMAP plot showing the distribution of different immune cells infiltrating the olfactory bulb during the acute phase of EAE measured by flow cytometry (n = 12). G–P Quantification of immune cells isolated from olfactory bulbs at the onset of EAE (d9 p.i., n = 5) and at the acute phase of EAE (d15 p.i., n = 7) measured by flow cytometry. Shown are CD4+ T cells (G) and CD8+ T cells (H), CD19+ B cells (I), NK cells (J), NK-T cells (K), macrophages (L), polymorphonuclear neutrophiles = PMN (M), CD11b+ (N) and CD11b (O) conventional dendritic cells = cDC, plasmacytoid dendritic cells = pDC (P). Bars show mean values ± s.e.m. Statistical analysis was performed by Mann–Whitney U-Test; *P < 0.05, **P < 0.01
Fig. 3
Fig. 3
Structural analyses show cell-type specific neuronal vulnerability during EAE. A Representation of the most prominent layers in the main olfactory bulb. Glomerular layer = GL, external plexiform layer = EPL, mitral cell layer = MCL, internal plexiform layer = IPL, granular cell layer = GCL. B–G Representative immunofluorescence images and quantitative measurement of different cell populations according to their main cell markers measured in the olfactory bulb per mm2 in healthy and EAE mice (n = 5–8 per group): B Tyrosine hydroxylase (TH), C Calbindin, D Calretinin, E Parvalbumin (PV), F NeuN and G Doublecortin (DCX). The analyzed layers are described and colored according to the representative image in A. Scale bars = 100 µm. Bars show mean values ± s.e.m. Statistical analysis was performed by unpaired, two-tailed Student's t-test; *P < 0.05
Fig. 4
Fig. 4
Mitral cells are susceptible to neuroinflammation in EAE. A Representative immunofluorescence image and quantification of reelin-positive mitral cells per mm mitral cell layer (MCL) and glomerular layer (GL) in healthy mice and mice at acute EAE (d15 p.i.) (MC: n = 8 per group; GL: n = 7 per group). Scale bars = 100 µm. B Representative images and quantification of phosphorylated (SMI31) and non- phosphorylated (SMI32) neurofilaments measured by mean fluorescence intensity (MFI) in the internal plexiform layer (IPL) of healthy (n = 10) and EAE animals (n = 9 per group). Scale bars = 100 µm. C Visualization and quantification of the synaptic density in the external plexiform layer measured by positive particles per area in mm2 of postsynaptic density protein PSD95 and presynaptic protein synapsin 1 (Syn1), as well as the colocalization of both, with latter corresponding to synapses between mitral cells and granular cells, in healthy animals, in onset EAE (d10 p.i.), acute EAE (d15 p.i.) and chronic EAE (d30 p.i.) (n = 5–7 per group). Scale bars = 20 µm. Bars show mean values ± s.e.m. Statistical analysis was performed one-way ANOVA followed by Tukey’s post hoc test; *P < 0.05, **P < 0.01, ***P < 0.001
Fig. 5
Fig. 5
SnRNA-Seq of the olfactory bulb reveals a heterogeneity of neuronal cell types. A Study design of single-nucleus RNA sequencing approach of neuronal nuclei in the olfactory bulb of healthy and acute EAE mice. Visualization done with Biorender. B UMAP plot with a total of 73,835 cells from six mice revealing 15 different clusters of mostly neuronal cells in the olfactory bulb. PGC = periglomerular cells, M/T = mitral/tufted cells, GC = granular cells, EPL-IN = interneurons of the external plexiform layer, MyOligos = myelinating oligodendrocytes, OEC = olfactory ensheathing cells. C Feature plots of prominent cell types including mature neurons, immature neurons, inhibitory neurons, excitatory neurons and two groups of prominent cell populations as defined by the depicted marker gene: Periglomerular cells with calretinin(Calb2)-positive, TH-positive and calbindin(Calb1)-positive cells as well as mitral/tufted cell clusters, which are further analyzed in Fig. 6. D Dot plot of the marker genes of the 15 distinct clusters
Fig. 6
Fig. 6
SnRNA-Seq analysis reveals expression changes related to monoatomic ion channel activity in inflamed mitral cells A UMAP plot of the three mitral/tufted cell clusters filtered from the main clusters as depicted in Fig. 5. A total of 7,252 cells grouped in six distinct clusters with three mitral cell clusters (MC-1, MC-2, MC-3), two external tufted cell clusters (ETC-1, ETC-2) and one middle tufted cell cluster (TC-1). B Feature plots of selected marker genes of mitral and tufted cells based on published data [15]. C Dot plot of the gene ontology enrichment analysis (GO term analysis) of the three mitral cell clusters. D Volcano plots of the differentially expressed genes of mitral cell clusters MC-1, MC-2 and MC-3 of healthy mice compared to acute EAE. Significantly regulated genes of the GO term “monoatomic ion channel activity” are labeled
Fig. 7
Fig. 7
Electrophysiological properties of mitral cells are perturbed during EAE. A Schematic presentation of whole-clamp in mitral cells of the main olfactory bulb. Olfactory receptor neuron = ORN; olfactory nerve layer = ONL; glomerular layer = GL; external plexiform layer = EPL; mitral cell layer = MCL; internal plexiform layer = IPL; granule cell layer = GCL; superficial short axon cell = sSA; periglomerular cell = PGC; external tufted cell = ETC; parvalbumin = PV-positive neuron; granule cell = GC. B Whole-cell currents recorded upon voltage-steps from –100 mV to 20 mV (step size 15 mV), were normalized by cell capacitance to compare current density of mitral cells in healthy (n = 39 cells, n = 25 animals) and acute EAE (d13–16 p.i., n = 43 cells, n = 20 animals). Inset shows increased inward current at negative potentials. Statistics were done by Mann–Whitney U-test; *P < 0.05, **P < 0.01, ***P < 0.001. C Difference in pA/pF throughout the I/V curve between healthy and inflamed mitral cells of the same cohort. D Power density spectrum (in pA2/Hz) in mitral cells of healthy (n = 38 cells, n = 30 animals) vs. acute EAE (d13–16 p.i., n = 23 cells, n = 12 animals). Statistical analysis was performed with two-sampled Kolmogorov–Smirnov test. E Power spectral density in pA2/Hz in healthy mitral cells with potassium-based intracellular solution (potassium glutamate = Kglu; n = 10 cells, n = 7 animals) or cesium-based intracellular solution (CsMeSO3; n = 10 cells, n = 2 animals). Statistical analysis was performed with two-sampled Kolmogorov–Smirnov test. F Representative traces and quantification of halothane-induced current (pA) in mitral cells of healthy (n = 38 cells, n = 30 animals) and EAE (n = 23 cells, n = 12 animals). Statistical analysis was performed by unpaired, Mann–Whitney U-test; *P < 0.05

References

    1. Reich DS, Lucchinetti CF, Calabresi PA. Multiple sclerosis. N Engl J Med. 2018;378:169–80. - PMC - PubMed
    1. Dendrou CA, Fugger L, Friese MA. Immunopathology of multiple sclerosis. Nat Rev Immunol. 2015;2015(15):545–58. - PubMed
    1. Goverover Y, Chen MH, Costa SL, Chiaravalloti ND, DeLuca J. Smell as a clinical-marker for functional limitations in multiple sclerosis: a pilot study. Mult Scler Relat Disord. 2020;46: 102508. - PubMed
    1. Croy I, Nordin S, Hummel T. Olfactory disorders and quality of life–an updated review. Chem Senses. 2014;39:185–94. - PubMed
    1. Yang L, Li LM, Yang LN, Zhang LJ, Fu Y, Li T, et al. Olfactory dysfunction in patients with multiple sclerosis. J Neurol Sci. 2016;365:34–9. - PubMed

MeSH terms

LinkOut - more resources