. 2025 Mar 8;13(1):54.
doi: 10.1186/s40478-025-01962-9.

Endogenous TDP-43 mislocalization in a novel knock-in mouse model reveals DNA repair impairment, inflammation, and neuronal senescence

Affiliations

Endogenous TDP-43 mislocalization in a novel knock-in mouse model reveals DNA repair impairment, inflammation, and neuronal senescence

Joy Mitra et al. Acta Neuropathol Commun. .

Abstract

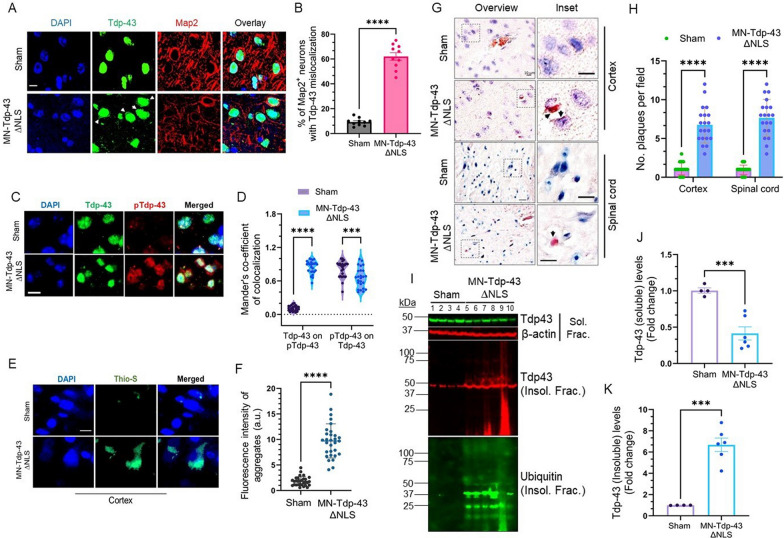
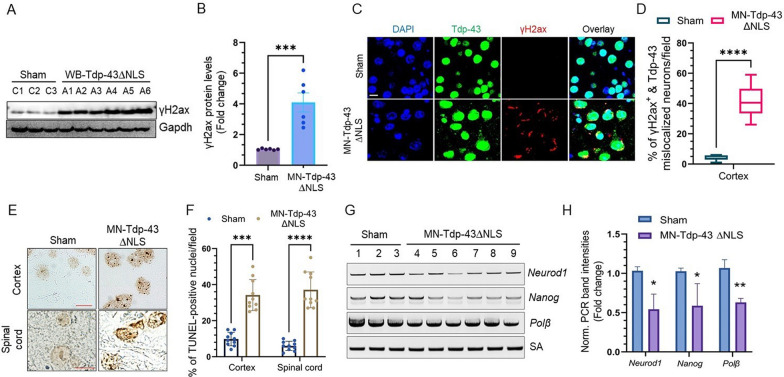
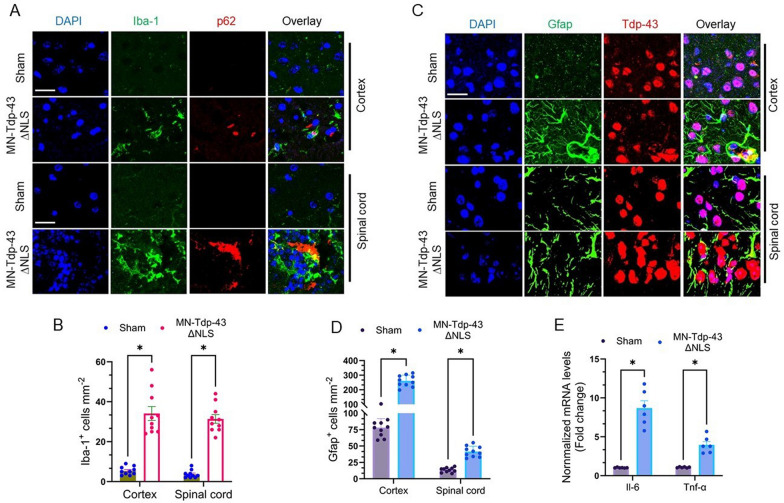
TDP-43 mislocalization and aggregation are key pathological features of amyotrophic lateral sclerosis (ALS)- and frontotemporal dementia (FTD). However, existing transgenic hTDP-43 WT or ∆NLS-overexpression animal models primarily focus on late-stage TDP-43 proteinopathy. To complement these models and to study the early-stage motor neuron-specific pathology during pre-symptomatic phases of disease progression, we generated a new endogenous knock-in (KI) mouse model using a combination of CRISPR/Cas9 and FLEX Cre-switch strategy for the conditional expression of a mislocalized Tdp-43∆NLS variant of mouse Tdp-43. This variant is expressed either in the whole body (WB) or specifically in the motor neurons (MNs) in two distinct models. These mice exhibit loss of nuclear Tdp-43, with concomitant cytosolic accumulation and aggregation in targeted cells, leading to increased DNA double-strand breaks (DSBs), signs of inflammation, and associated cellular senescence. Notably, unlike WT Tdp-43, which functionally interacts with Xrcc4 and DNA Ligase 4, the key DSB repair proteins in the non-homologous end-joining (NHEJ) pathway, the Tdp-43∆NLS mutant sequesters them into cytosolic aggregates, exacerbating neuronal damage in mouse brain. The mutant mice also exhibit myogenic degeneration in hindlimb soleus muscles and distinct motor deficits, consistent with the characteristics of motor neuron disease (MND). Our findings reveal progressive degenerative mechanisms in motor neurons expressing endogenous Tdp-43∆NLS mutant, independent of Tdp-43 overexpression or other confounding factors. Thus, this unique Tdp-43 KI mouse model, which displays key molecular and phenotypic features of Tdp-43 proteinopathy, offers a significant opportunity to characterize the early-stage progression of MND further and also opens avenues for developing DNA repair-targeted approaches for treating TDP-43 pathology-linked neurodegenerative diseases.

Keywords: Amyotrophic lateral sclerosis; DNA damage; Inflammation; Motor deficits; Motor neuron; Muscle atrophy; Neurodegeneration; Senescence; TDP-43.


Conflict of interest statement

Declarations. Ethics approval and consent to participate: Not applicable. Consent for publication: Not applicable. Competing interests: The authors declare no competing interests.

Figures

Fig. 1
Fig. 1
Inactivation of the TDP-43 nuclear localization signal (NLS) induces genomic instability. (A) Schematic presentation of NLS point mutations (K95A, K97A, and R98A) in TDP-43. (B-C) Immunofluorescence (IF) analysis of TDP-43 localization and DNA double-strand breaks (DSB) in doxycycline-inducible TDP-43 wild-type (WT) and NLS-inactivated (mNLS) neuronal cells using anti-TDP-43 (upper panel) and anti-γH2AX (S139) antibodies (lower panel). Nuclei were stained with DAPI and cytoskeleton with Alexa-Flour 568 Phalloidin. Scale bar = 10 µm (B). Quantitative analysis of γH2AX foci counts in the nucleus (n = 25 cells in each experiment) (C). Data were analyzed using a t-test from two independent experiments (N = 2); mean ± SEM, ****, P < 0.0001. (D-E), Neutral comet assay showing TDP-43 mNLS expression-associated DSB accumulation in neuronal cells compared to TDP-43 WT cells. Scale bar = 20 µm (D). Quantitation of comet tail moments for each experimental group (n = 50 cells); one-way ANOVA; ****, P < 0.0001 (E). (F-G) Doxycycline (Dox)-induced WT or mNLS TDP-43 expressing neuronal cells were transfected with antisense RNA (siRNA) to the 3’UTR of TARDBP mRNA (siTDP-43) or control siRNA (siControl) and harvested at 72 h post-transfection for immunoblotting (IB) analysis using indicated antibodies (F). Quantitation of phosphorylated to total protein expression ratio from two independent experiments (N = 2) by one-way ANOVA (G). ns, non-significant; ***, P < 0.001; ****, P < 0.0001
Fig. 2
Fig. 2
Generation of Tdp-43 knock-in mouse model. (A) Illustration of the target allele design for the murine Tardbp gene. (B) Genotyping PCR identifies a wild-type and a heterozygous littermate where the band size of 351 bp indicates the presence of the floxed target allele. (C) Schematic of the double-heterozygous Cre±:Tdp-43∆NLS± strain generation. (D) Illustration of the Cre-mediated recombination of floxed WT and mutant Exon-3 deletion and re-orientation, respectively, resulting in the expression of mutant Tdp-43∆NLS variant in the desired cell type in the central nervous system (CNS)
Fig. 3
Fig. 3
Neuronal Tdp-43∆NLS expression induces Tdp-43 mislocalization and formation of pathological aggregates in the cytosol. (A-B) Immunohistochemistry (IHC)-immunofluorescence (IF) staining with anti-Tdp-43 (Alexa Fluor 488) and anti-Map2 (Alexa Fluor 647) antibodies in the cortical brain regions of MN-Tdp-43∆NLS and sham mice (N = 6 mice/group). Nuclei were counterstained with DAPI. Scale bar = 10 µm (A). (B) Quantitation of percentages of Map2+ motor neurons with Tdp-43 mislocalization in the cortex by student’s t-test. ****, P < 0.0001. (C) Representative colocalization IF images stained with anti-Tdp-43 and anti-phosphoTdp-43 (S409/410) antibodies in cortices of sham and MN-Tdp-43∆NLS mice brains. Nuclei were counterstained with DAPI. Scale bar = 10 µm; N = 25 microscopic fields from 6 mice/group. (D) Quantitation of Mander’s coefficient of colocalization of Tdp-43 (Green) on pTdp-43 (Red) signals and vice versa using two-way ANOVA. ***, P < 0.001; ****, P < 0.0001. (E–F) Thioflavin-S staining images of the cortical tissue from sham and MN-Tdp-43∆NLS mice brains. Nuclei were counterstained with DAPI. Scale bar = 10 µm (E). (F) Quantitation of fluorescence intensity (arbitrary unit, a.u.) of Thioflavin-S-positive aggregates (N = 30 cells; 6 mice/group) by t-test. ****, P < 0.0001. (G-H) Representative Congo red staining images of the cortex from sham and MN-Tdp-43∆NLS mice. Pink stain indicates amyloid plaques in the cytosol and inter-cellular spaces. Nuclei were counterstained with hematoxylin. Scale bars = 10 µm (overview—cortex), 20 µm (overview – spinal cord), and 10 µm (inset) (G). (H) Quantitation of the number of amyloid plaques per field. N = 20 different microscopic fields from 6 mice/group by two-way ANOVA. ****, P < 0.0001. (I-K) IB of sham and MN-Tdp-43∆NLS mice cortical brain lysates to assess levels of monomeric TDP-43 (soluble fraction – Green) and aggregated TDP-43 (insoluble fraction – Red). β-Actin served as the loading control for soluble fractions. The ubiquitination status of proteins was also measured in insoluble fractionates from sham and MN-Tdp-43∆NLS mice by probing with anti-ubiquitin antibody (I). (J-K) Quantitation of IB band intensities by t-test with Welch’s correction. ***, P < 0.001. Data are expressed as mean ± standard deviation (SD)
Fig. 4
Fig. 4
MN-Tdp-43∆NLS expression causes muscle atrophy and gait deficits in Tdp-43 mutant mice. (A) Representative live-mice images showing abnormal hindlimb reflexes in 12-month-old MN-Tdp-43ΔNLS mice (N = 6) but not sham mice (N = 5). (B-C) IB images exhibiting levels of high-molecular weight (MW) Tdp-43 and pTdp-43 (S409/410), and pathological 25 kDa fragment of Tdp-43. Gapdh served as the loading control (B). (C) Quantitation of normalized protein levels in fold changes by multiple paired t-tests. *, P < 0.05. (D) Hematoxylin–Eosin (H&E) staining of sham and MN-Tdp-43ΔNLS mice soleus (I-II) tissues. IHC staining with anti-phosphorylated Tdp-43 (S409/410) antibody in soleus muscle tissues (III-IV). Scale bar = 50 µm. The inset image displays cytosolic pTdp-43 staining in muscle cells. (E–F) IB analysis of Titin [full-length: FL; Fragment of 25 kDa: Frag. (25 kDa)] and Stmn2 levels in soleus muscle samples from sham (N = 5) and MN-Tdp-43ΔNLS (N = 6) mice. α-Tubulin served as the loading control (E). (F) Comparisons of normalized Titin (FL & Frag.) and Stmn2 levels between the two groups using multiple paired t-tests or Welch’s t-test. Data are expressed as mean ± SD. **, P < 0.01; ***, P < 0.001; ****, P < 0.0001. (G) Rotarod testing to assess the latency to fall (seconds) for MN-Tdp-43ΔNLS and sham mice (N = 6 mice/group) analyzed by multiple paired t-tests. ns, non-significant; *, P < 0.05. DigiGait analyses of MN-Tdp-43ΔNLS versus sham mice (H) gait symmetry; (I) hindlimb paw area (cm2); (J) stance-to-swing ratio; and (K) stride length (cm). N = 6 mice/group. Data are expressed as mean ± SEM and analyzed by multiple paired t-tests. *, P < 0.05; ***, P < 0.001
Fig. 5
Fig. 5
Tdp-43∆NLS induces genome damage in the central nervous system (CNS). (A-B) Representative IB images of cortical brain extracts from sham (N = 6) and WB-Tdp-43∆NLS mice (N = 6) using anti-γH2ax. Gapdh served as the loading control (A). (B) Quantitation of γH2ax protein levels (fold change) of the MN-Tdp-43∆NLS and sham mice groups. (C-D) Representative IF images of colocalization of Tdp-43 mislocalization with γH2ax foci using respective antibodies in the cortex of sham and MN-Tdp-43∆NLS mice (N = 6/group). Nuclei were counterstained with DAPI. Scale bar = 10 µm (C). (D) Quantitation of percent of γH2ax-positive and Tdp-43 mislocalized neurons by t-test. N = 12 different microscopic fields per group at 40 × optical magnification. ****, P < 0.0001. (E–F) TUNEL analysis to estimate the neuronal genome damage in the cortex and spinal cord of MN-Tdp-43∆NLS expressing mice. Scale bar = 20 µm (E). (F) Quantitation of the number of cells with TUNEL-positive nuclei by two-way ANOVA. ***, P < 0.001; ****, P < 0.0001. (G-H) Long-amplification PCR amplification (LA-PCR) of –6–8 kb of genomic length from the cortical genome of MN-Tdp-43∆NLS (N = 6) and sham mice (N = 3). A 200 bp short-amplification (SA) product was used as an internal control (G). (H) Quantitation of normalized PCR band intensities of each genomic target in the MN-Tdp-43∆NLS and sham groups. Data are expressed as mean ± SD and analyzed by multiple t-tests. *, P < 0.05, **, P < 0.01
Fig. 6
Fig. 6
Tdp-43∆NLS causes trapping of Xrcc4 and Ligase 4 in the cytosol of neurons. (A-B) Representative IF images of Tdp-43 and Xrcc4 colocalization in the cortex of sham and MN-Tdp-43∆NLS mice (A). (B) Analysis of the extent of colocalization of Tdp-43 and Xrcc4 IF signals using Mander’s colocalization coefficient. (C-E) Representative images of proximity ligation assay (PLA) between Tdp-43 and DNA Ligase 4 (Lig4) or Xrcc4 in the cortex of sham and MN-Tdp-43∆NLS mice. Cell bodies were counterstained with Alexa-Fluor 488-conjugated Nissl stain. PLA signals were visualized as red foci/puncta at 568 nm. Anti-Tdp-43 rabbit antibody was used against mouse normal IgG as negative control. Scale bar = 10 µm. (C). Quantitation of PLA signal intensity from 12 different microscopic fields per group for Tdp-43 vs Lig4 (D) and Tdp-43 vs Xrcc4 (E). Data are expressed as mean ± SEM and analyzed by multiple paired t-tests. *, P < 0.05; ****, P < 0.0001
Fig. 7
Fig. 7
Tdp-43∆NLS mice display Tdp-43 aggregation-induced neuro-inflammation in the CNS. (A-B) Representative IF colocalization images showing an increased population of Iba-1+ (Green) activated microglia surrounding p62+ cells (neurons; Red) in the brain cortex and spinal cord tissues in MN-Tdp-43∆NLS mice compared to sham mice (N = 10 different 1mm2 microscopic fields from 6 mice/group). Nuclei were counterstained with DAPI. Scale bar = 10 µm (A). (B) Quantitation of the number of Iba-1+ cells per mm2. (C-D) Representative IF colocalization images displaying activated Gfap+ astrocytes surrounding neurons with Tdp-43 pathology in the cortical region of MN-Tdp-43∆NLS mice but not in sham mice. Nuclei were counterstained with DAPI. Scale bar = 10 µm (C). (D) Quantitation of the number of Gfap+ cells per mm2 in the cortex and spinal cord. (E) Quantitation of relative mRNA levels (fold change) of neuro-inflammatory markers Il-6 and Tnf-α in the cortical tissues of MN-Tdp-43∆NLS and sham mice (N = 6/group). Gapdh served as the internal control. Data are expressed as mean ± SEM and analyzed by multiple paired t-tests. *, P < 0.05
Fig. 8
Fig. 8
Tdp-43∆NLS mice exhibit neuronal senescence phenotype in the CNS and hind-limb muscle. (A-B) Representative IF images with fluorescence-based (β-Gal) senescence staining in the cortex of sham and MN-Tdp-43∆NLS mice (N = 6/group). Nuclei were counterstained with DAPI. Scale bar = 10 µm (A). (B) Quantitation of percent of β-Gal positive senescent cells using paired t-test. ****, P < 0.0001. (C-D) IF images of hind-limb soleus muscle tissues stained with anti-Actin (Alexa-Fluor 647) and fluorescent β-Gal (488 nm) from sham and MN-Tdp-43∆NLS mice. The white arrow indicates defective actin polymerization in the soleus muscle of MN-Tdp-43∆NLS mice. Nuclei were counterstained with DAPI. Scale bars = 20 µm and 10 µm (inset images) (C). (D) Quantitation of percent of β-Gal positive senescent cells using paired t-test. ****, P < 0.0001. (E) Quantitation of relative mRNA levels (fold change) of senescence-associated markers Edn1, p21, and Ankrd1 in cortical tissues of sham and MN-Tdp-43∆NLS mice (N = 6/group). Gapdh served as the internal control. Data are expressed as mean ± SEM and analyzed by multiple paired t-tests. *, P < 0.05

Update of

References

    1. Mackenzie IR, Rademakers R, Neumann M (2010) TDP-43 and FUS in amyotrophic lateral sclerosis and frontotemporal dementia. Lancet Neurol 9:995–1007. 10.1016/s1474-4422(10)70195-2 - PubMed
    1. Neumann M, Sampathu DM, Kwong LK, Truax AC, Micsenyi MC, Chou TT, Bruce J, Schuck T, Grossman M, Clark CM et al (2006) Ubiquitinated TDP-43 in frontotemporal lobar degeneration and amyotrophic lateral sclerosis. Science 314:130–133. 10.1126/science.1134108 - PubMed
    1. Shih YH, Tu LH, Chang TY, Ganesan K, Chang WW, Chang PS, Fang YS, Lin YT, Jin LW, Chen YR (2020) TDP-43 interacts with amyloid-β, inhibits fibrillization, and worsens pathology in a model of Alzheimer’s disease. Nat Commun 11:5950. 10.1038/s41467-020-19786-7 - PMC - PubMed
    1. James BD, Wilson RS, Boyle PA, Trojanowski JQ, Bennett DA, Schneider JA (2016) TDP-43 stage, mixed pathologies, and clinical Alzheimer’s-type dementia. Brain 139:2983–2993. 10.1093/brain/aww224 - PMC - PubMed
    1. Josephs KA, Murray ME, Whitwell JL, Parisi JE, Petrucelli L, Jack CR, Petersen RC, Dickson DW (2014) Staging TDP-43 pathology in Alzheimer’s disease. Acta Neuropathol 127:441–450. 10.1007/s00401-013-1211-9 - PMC - PubMed

Publication types

MeSH terms

LinkOut - more resources