. 2025 Aug 4;15(8):1697-1716.
doi: 10.1158/2159-8290.CD-24-1475.

T-cell Dependency of Tumor Regressions and Complete Responses with RAS(ON) Multi-selective Inhibition in Preclinical Models of Pancreatic Ductal Adenocarcinoma

Affiliations

T-cell Dependency of Tumor Regressions and Complete Responses with RAS(ON) Multi-selective Inhibition in Preclinical Models of Pancreatic Ductal Adenocarcinoma

Margo Orlen et al. Cancer Discov. .

Abstract

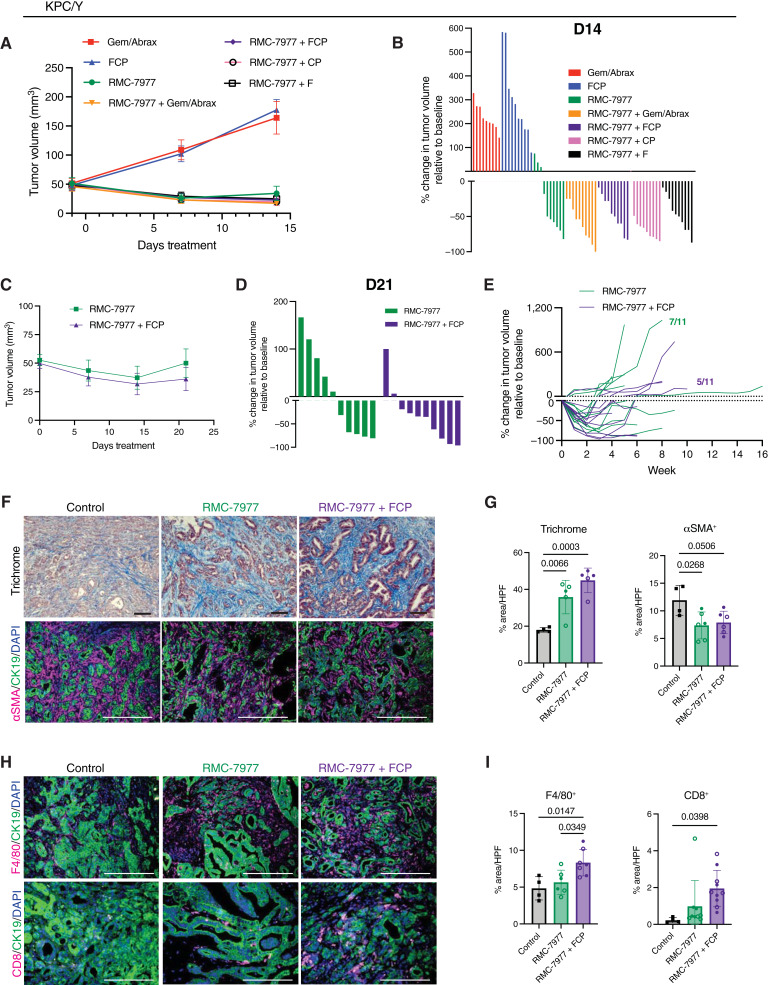
Activating mutations in KRAS drive tumorigenesis in pancreatic ductal adenocarcinoma (PDAC), promoting tumor cell proliferation and contributing to an immunosuppressive tumor microenvironment, rendering PDAC tumors insensitive to immunotherapy. RAS(ON) multi-selective inhibitors, such as daraxonrasib (RMC-6236) and RMC-7977, target the active state of RAS, with potent antitumor activity in PDAC murine models. In this study, we report that RAS(ON) multi-selective inhibition led to rapid and profound PDAC regressions in immunocompetent mice, decreasing myeloid cells and increasing T cells and macrophages in the tumor microenvironment. The depth and duration of tumor regression depended on T cells and conventional dendritic cells. Moreover, the combination of RAS(ON) multi-selective inhibitors with immunotherapy conferred deeper and more durable tumor regressions, including complete responses not seen with either treatment alone. In summary, concurrent inhibition of mutant and wild-type RAS is active in concert with T-cell immunotherapy, revealing RAS(ON) multi-selective inhibitors as a potential therapeutic immuno-sensitizing strategy in PDAC.

Significance: RAS(ON) multi-selective inhibitors enhance antitumor immunity in preclinical models of PDAC, resulting in deeper and more durable responses when combined with immunotherapy. These findings support the clinical evaluation of immune-based strategies that may prolong the response to RAS inhibitor therapies as well as overcome issues of therapeutic resistance to inhibitors alone. See related commentary by Lasse Opsahl and Pasca di Magliano, p. 1537.


Conflict of interest statement

N. Tovbis Shifrin reports a patent for WO 2024/229406 pending. M. Singh reports a patent for WO 2022/060836 pending and a patent for WO 2024/229406 pending. E. Quintana reports a patent for WO 2024/229406 pending. M. Menard reports a patent for WO 2024/229406 pending. R.H. Vonderheide reports other support from Revolution Medicines and grants from the NCI during the conduct of the study, as well as personal fees from Crossbow Therapeutics, Bristol Myers Squibb, EMD Sereno, and Grey Wolf Therapeutics outside the submitted work; in addition, R.H. Vonderheide has a patent for “Tumor antigens” issued, a patent for “Kras” epitopes issued, and a patent for “Cell therapy” issued, licensed, and with royalties paid from Therapeutics. B.Z. Stanger reports grants from Revolution Medicines during the conduct of the study and grants from Boehringer Ingelheim and personal fees from iTeos Therapeutics outside the submitted work. No disclosures were reported by the other authors.

Figures

Figure 1.
Figure 1.
Antitumor activity of RAS(ON) multi-selective inhibition correlates with baseline levels of T-cell infiltration across immunocompetent PDAC models. A–D, Growth curves showing tumor volumes (mm3) of subcutaneous tumors treated with vehicle or RMC-7977 for 7 days. Waterfall plots show change in tumor volume after 7 days of treatment compared with baseline at enrollment (day 0). Each symbol represents average tumor volume. Error bars, SEM. Statistics were determined using a two-way ANOVA with the Sidak multiple comparisons test with significance indicated (****, P < 0.0001). A, 6419c5 subcutaneous tumors, n = 8/group. B, 4662G12C subcutaneous tumors. n = 10/group. C, 4662G12D subcutaneous tumors. n = 10/group. D, 2838c3 subcutaneous tumors. n = 8–10/group. E, Representative IF images of 6419c5 subcutaneous tumors treated with vehicle or RMC-7977 for 7 days. Mice were sacrificed 4 hours after the last dose and stained for Ki-67 (proliferation marker, left) or CC3 (apoptosis marker, right), GFP (tumor cell marker), and DAPI. n = 7–8 tumors/group. Scale bars, 200 μm. F, Quantitation of proliferating tumor cells (Ki-67 of GFP+) or apoptotic tumor cells (CC3 of GFP+) from E as percent area per HPF in vehicle-treated or RMC-7977–treated tumors. P values were determined by an unpaired Student t test with significance indicated (****, P < 0.0001; ***, P < 0.001). Each symbol represents the average of at least three fields of view per tumor. Error bars represent the SD. G–I, Representative images of 6419c5 subcutaneous tumors treated with vehicle or RMC-7977 for 7 days. Mice were sacrificed 4 hours after the last dose. Scale bars for G and H indicate 100 μm. Scale bars for I indicate 200 μm. J, Quantitation of trichrome or αSMA staining from H and I. P values were determined by an unpaired Student t test with significance indicated (****, P < 0.0001; ***, P < 0.001). Each symbol represents the average of at least three fields of view per tumor. Error bars represent the SD. H&E, hematoxylin and eosin. CC3, cleaved caspase-3.
Figure 2.
Figure 2.
RAS(ON) multi-selective inhibition alters the PDAC tumor−immune microenvironment. A–D, Effects on tumor cells and immune cells taken from 6419c5 subcutaneous tumors treated with 3 doses over 72 hours with vehicle or RMC-7977. n = 5–7/group. A, Tumor weight, percentage of YFP+ tumor cells, and expression of MHC class I on YFP+ tumor cells; B, Myeloid cell subsets (CD11b+Ly6G+/Ly6Clo and Ly6G−/Ly6Chi). C, MHC-II+ DCs (CD11c+, MHC-II+) and CD103+ DCs (CD11c+, CD103+). cDC, conventional DC. D, Total macrophages (CD11b+, F4/80+, and Ly6G) and ratio of CD206lo MHC-IIhi to CD206hi MHC-IIlo macrophages. Each symbol represents an individual tumor. Error bars represent the SD. E, Representative IF staining of 6419c5 subcutaneous tumors treated with 3 doses over 72 with vehicle or RMC-7977 and stained for F4/80+ macrophages, GFP+ tumor cells, and DAPI. Scale bars, 200 μm. Quantitation of F4/80+ macrophages is presented as percent area per HPF. n = 7–8/group. Each symbol represents the average of at least 3 fields of view per tumor. Error bars represent the SD. F, Flow cytometry of T-cell subsets from 6419c5 subcutaneous tumors treated with 3 doses over 72 hours of vehicle or RMC-7977. n = 5–7/group. Data are representative of three independent experiments. Error bars represent the SD. G, Representative IF staining of 6419c5 subcutaneous tumors treated with 3 doses over 72 hours of vehicle or RMC-7977. Stained for CD8+ T cells, GFP+ tumor cells, and DAPI. Scale bars, 100 μm. Objective 40×. Quantitation of CD8+ T cells as percent area per HPF shown on right. n = 5/group. Each symbol represents the average of at least three fields of view per tumor. Error bars represent the SD. H and I, Flow cytometry of T-cell subsets from 6419c5 subcutaneous tumors treated with 3 doses over 72 hours with vehicle or RMC-7977. Stimulated for 4 hours with PMA/ionomycin. n = 6–7/group. MFI, mean fluorescence intensity. Tcm, central memory CD8+ T cells. Tem, effector memory CD8+ T cells. Error bars represent the SD. P values were determined by an unpaired Student t test with significance indicated (*, P < 0.05; **, P < 0.01). ns, not significant.
Figure 3.
Figure 3.
T cells contribute to the antitumor activity of RAS(ON) multi-selective inhibition. A and B, Growth curves and waterfall plots of 2838c3 subcutaneous tumors treated with vehicle or RMC-7977 for 12 days. Vehicle or RMC-7977 treatment was initiated on day 0 when tumors reached 20–100 mm3. CD8+ and CD4+ T-cell depletion with depleting antibodies or isotype control was initiated 1 day prior to enrollment (day −1) and continued twice per week until indicated takedown. Each symbol represents average tumor volume. Error bars, SEM. Statistics were determined using a two-way ANOVA with the Tukey HSD test with significance indicated (*, P < 0.05). n = 7/group. C and D, Individual tumor volume and waterfall plot of 2838c3 subcutaneous tumors treated with vehicle or RMC-7977. Mice were treated twice weekly continuously with CD4/CD8-depleting antibodies 1 day prior to enrollment (day −1) until day 63. RMC-7977 or vehicle was started on day 0 and dosed until day 24 (arrow indicates when RMC-7977 was stopped). The waterfall plot in D shows change in tumor volume after 24 days on of RMC-7977 or vehicle and 13 days off treatment compared with baseline at day 0. n = 7/group. E and F, Growth curves of 6419c5 subcutaneous tumors treated with vehicle or RMC-7977. Each symbol represents the average tumor volumes. Error bars, SEM. In F, mice were treated twice weekly with CD4/CD8-depleting antibodies from 1 day prior to enrollment (day −1) until day 24. RMC-7977 or vehicle was started on day 0 and dosed until day 14 (arrow indicates when RMC-7977 was stopped). n = 7–8/group. G–I, Mice bearing subcutaneous 2838c3 PDAC tumors treated with daraxonrasib or vehicle with simultaneous T-cell depletion. CD8+ and CD4+, or CD8+ alone, T-cell depletion with depleting antibodies or isotype control was initiated on day −2, continued on day −1, and then continued weekly until indicated takedown. Treatment with vehicle or daraxonrasib 25 mg/kg once daily orally started on day 1. G, Each symbol on growth curve represents average tumor volume. Error bars, SEM. n = 7–8 mice/group. H, Waterfall plot showing percentage change in tumor volume from baseline at day 19 of treatment with daraxonrasib. I, Plot of progression-free survival in mice treated with indicated combinations. Progression is defined as tumor doubling from baseline.
Figure 4.
Figure 4.
RAS(ON) multi-selective inhibition exhibits combination benefit with anti–PD-1 therapy in T cell–high PDAC tumors. A–C, TME analysis of 2838c3 subcutaneous tumors treated with vehicle or daraxonrasib for 8 days. Tumors were taken down 24 hours after the last dose. Each symbol represents an individual tumor. Error bars represent the SD. A, Flow cytometry analysis of H2Db+ (MHC-I), MHC-II, and PD-L1 expression on YFP+ tumor cells. n = 5/group. B, Flow cytometry analysis of CD11b+ total myeloid cells and gMDSCs (CD11b+ Ly6G+/Ly6Clo) as a percentage of CD45+ cells. n = 5/group. C, NanoString analysis of tumors shows normalized expression of Pdcd1 (PD-1), Tigit, and Ctla4. n = 3–4/group. P values in A–C determined by an unpaired Student t test (****, P < 0.0001; ***, P < 0.001; **, P < 0.01; *, P < 0.05). D–I, Tumor growth in mice treated with the combination of daraxonrasib and anti–PD-1. Mice with subcutaneous 2838c3 tumors began treatment on day 17 after implantation and continued for 6 weeks. Individual tumor volume curves of mice treated with vehicle (D), anti–PD-1 (E), daraxonrasib (F), or the combination (G). The dashed line indicates cessation of therapy at day 59; number of mice exhibiting CRs is shown. Mice treated with daraxonrasib had 2/10 CRs on therapy. After therapy was discontinued at day 59 (dashed line), 1/10 mice had CRs. Daraxonrasib was dosed at 25 mg/kg once daily orally until the end of treatment indicated. Anti–PD-1 was dosed at 10 mg/kg intraperitoneally twice weekly for 3 weeks. H, Waterfall plot shows percentage change in tumor volume from baseline at first day of treatment to day 29 of treatment (day 45 after tumor implantation). I, Progression-free survival defined as tumor doubling from baseline. The dotted line indicates cessation of therapy at day 59.
Figure 5.
Figure 5.
RAS(ON) multi-selective inhibition with RMC-7977 sensitizes pancreatic tumors to immunotherapy. A, Growth curves of 2838c3 subcutaneous tumors treated with indicated agents starting when tumors reached an average volume of 20–100 mm3. Treatment groups included RMC-7977, gemcitabine/nab-paclitaxel chemotherapy (Gem/Abrax), and/or the combination of CD40 agonist (F), anti–CTLA4 (C), and anti–PD-1 (P) antibodies (FCP in combination). F was given on day 3, C was given days 0, 3, and 6, and P was given every 3 days beginning day 0. Gemcitabine is given once weekly starting on day 0 and nab-paclitaxel was given once on day 0. B and C, Waterfall plots showing changes in tumor volume of 2838c3 subcutaneous tumors from A after 10 days (B) or 48 days (C) of treatment compared with baseline at day 0. n = 9–10/group. D, Growth curves of large 2838c3 subcutaneous tumors treated with indicated combinations. Enrollment started when tumors reached an average volume of 200 mm3. E and F, Waterfall plots showing changes in tumor volume of 2838c3 subcutaneous tumors from D after 12 days (E) or 27 days (F) of treatment compared with baseline at day 0. n = 8–10/group. G, Growth curves of 6419c5 subcutaneous tumors treated with indicated combinations. Enrollment started when tumors reached an average volume of 100–150 mm3. H and I, Waterfall plots showing changes in tumor volume of 6419c5 subcutaneous tumors from G after 7 days (H) or 25 days (I) of treatment compared with baseline at day 0. n = 7–10/group. J, Growth curves of 6419c5 subcutaneous tumors treated with indicated combinations. Enrollment started when tumors reached an average volume of 100 mm3. K and L, Waterfall plots showing changes in tumor volume of 6419c5 subcutaneous tumors from J after 12 days (K) and 24 days (L) of treatment compared with baseline at day 0. n = 8–10/group. P values in D and J determined using a two-way ANOVA with the Tukey HSD test with significance indicated (****, P < 0.0001; *, P < 0.05). Points on tumor volume curves represent average tumor volume. Error bars represent the SEM.
Figure 6.
Figure 6.
Chemotherapy and immunotherapy enhance the antitumor activity of RMC-7977 in autochthonous PDAC tumors. A, Growth curves of KPC/Y tumors treated for 14 days as indicated (therapy abbreviations listed in Fig. 4 legend). Treatments were started when tumors reached an average volume of 20–100 mm3, and tumor volume was measured weekly by ultrasound. Points on tumor volume curves represent average tumor volume. n = 10/group. Error bars represent the SEM. B, Waterfall plot showing change in volume of KPC/Y tumors in A, comparing day 14 to day 0. C, Growth curves of KPC/Y tumors treated for 21 days as indicated. Points on tumor volume curves represent average tumor volume. n = 10/group. Error bars represent the SEM. D, Waterfall plot showing change in volume of KPC/Y tumors in (C) treated with RMC-7977 alone or RMC-7977 plus FCP, comparing day 21 to day 0. E, Plot showing changes in the volume of individual tumors over time. 7/11 mice treated with RMC-7977 alone (green lines) had progression on therapy compared with 5/11 mice treated with RMC-7977 + FCP (purple lines). F–I, Representative images of KPC/Y tumors untreated (control) or treated with the indicated agents. KPC/Y mice were treated with RMC-7977 or RMC-7977 + FCP continuously and taken down at survival endpoint. Control tumors were obtained from untreated KPC/Y mice at survival endpoint. F, Tumors were stained by trichrome or for αSMA. Scale bars indicate 100 μm for trichrome staining and 200 μm for αSMA staining. G, Quantitation of trichrome or αSMA staining from F. H, Tumors were stained for F4/80 and CD8. Scale bars indicate 200 μm for F4/80 and CD8 staining. I, Quantitation of F4/80+ and CD8+ staining from H. Statistics were determined using a one-way ANOVA with the Tukey HSD test with P values indicated. Open circles represent tumors from mice with progressive disease. Closed circles represent tumors from mice with stable disease or partial response. Squares indicate endpoint tumors. Each symbol represents the average of 4–6 fields of view per tumor. Error bars represent the SD.
Figure 7.
Figure 7.
RMC-7977 does not impede signaling or function of activated T cells. A, In vitro dose–response curves of murine PDAC tumor cells (6419c5 and 2838c3) or naïve murine CD8+ T cells treated with RMC-7977 for 72 hours. Cell luminescence was measured with a CellTiter-Glo assay and normalized to untreated controls. B and C, Representative Western blot of naïve murine CD8+ T cells (B) or murine PDAC cells (C) treated with RMC-7977 at indicated doses for 2 hours. D, Pooled CD8+ T cells isolated from naïve C57BL/6 mice activated with anti-CD3 and anti-CD28 while concurrently treated with RMC-7977 at indicated doses for 72 hours and analyzed by flow cytometry. Cell division was measured using CellTrace Violet (divided %). * represents a 0 value. Error bars represent the SD. Representative of three independent experiments. E, Pooled CD8+ T cells isolated from 3 to 4 naïve C57BL/6 mice activated with anti-CD3 and anti-CD28 (3 replicates per condition). After 3 days of activation, cells were treated with RMC-7977 at indicated doses for 72 hours and analyzed by flow cytometry. Error bars represent the SD. Representative of three independent experiments. F, Flow cytometry analysis of antigen-specific CD8+ T-cell expansion in response to vaccination challenge. Vaccinated animals (“Vax”) were immunized with OVA/CpG on day 0 and dosed with vehicle or RMC-7977 for 72 hours at 25 mg/kg once daily starting at day 0. Antigen-specific splenic CD8+ T cells were identified using a H-2Kb:SIINFEKL tetramer and were compared with nonvaccinated (“No Vax”) C57BL/6 and OT-I controls. Error bars represent the SD. Data were compiled from three independent experiments.

References

    1. Waters AM, Der CJ. KRAS: the critical driver and therapeutic target for pancreatic cancer. Csh Perspect Med 2018;8:a031435. - PMC - PubMed
    1. Carvalho PD, Guimarães CF, Cardoso AP, Mendonça S, Costa ÂM, Oliveira MJ, et al. KRAS oncogenic signaling extends beyond cancer cells to orchestrate the microenvironment. Cancer Res 2017;78:7–14. - PubMed
    1. Bear AS, Vonderheide RH, O’Hara MH. Challenges and opportunities for pancreatic cancer immunotherapy. Cancer Cell 2020;38:788–802. - PMC - PubMed
    1. Collins MA, Bednar F, Zhang Y, Brisset J-C, Galbán S, Galbán CJ, et al. Oncogenic Kras is required for both the initiation and maintenance of pancreatic cancer in mice. J Clin Invest 2012;122:639–53. - PMC - PubMed
    1. Pylayeva-Gupta Y, Lee KE, Hajdu CH, Miller G, Bar-Sagi D. Oncogenic kras-induced GM-CSF production promotes the development of pancreatic neoplasia. Cancer Cell 2012;21:836–47. - PMC - PubMed

MeSH terms