. 2025 Apr;24(4):100934.
doi: 10.1016/j.mcpro.2025.100934. Epub 2025 Mar 7.

Analysis of Limited Proteolysis-Coupled Mass Spectrometry Data

Affiliations

Analysis of Limited Proteolysis-Coupled Mass Spectrometry Data

Luise Nagel et al. Mol Cell Proteomics. 2025 Apr.

Abstract

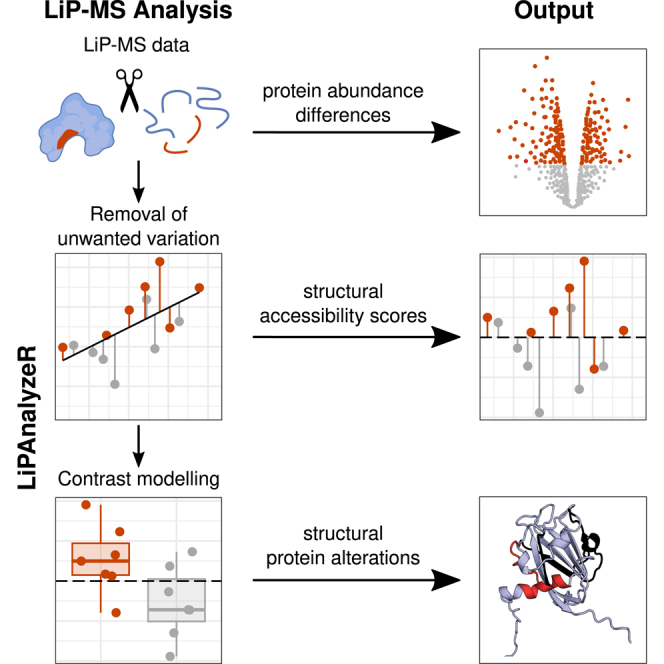
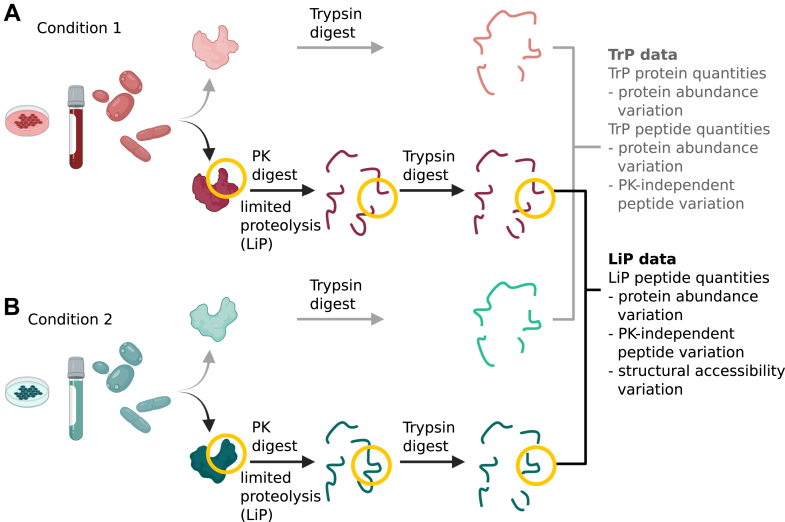
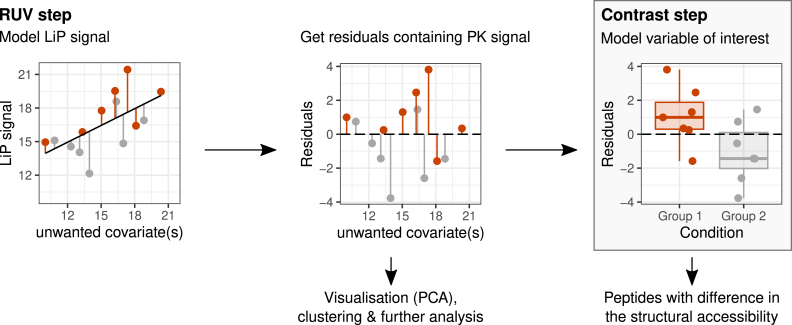
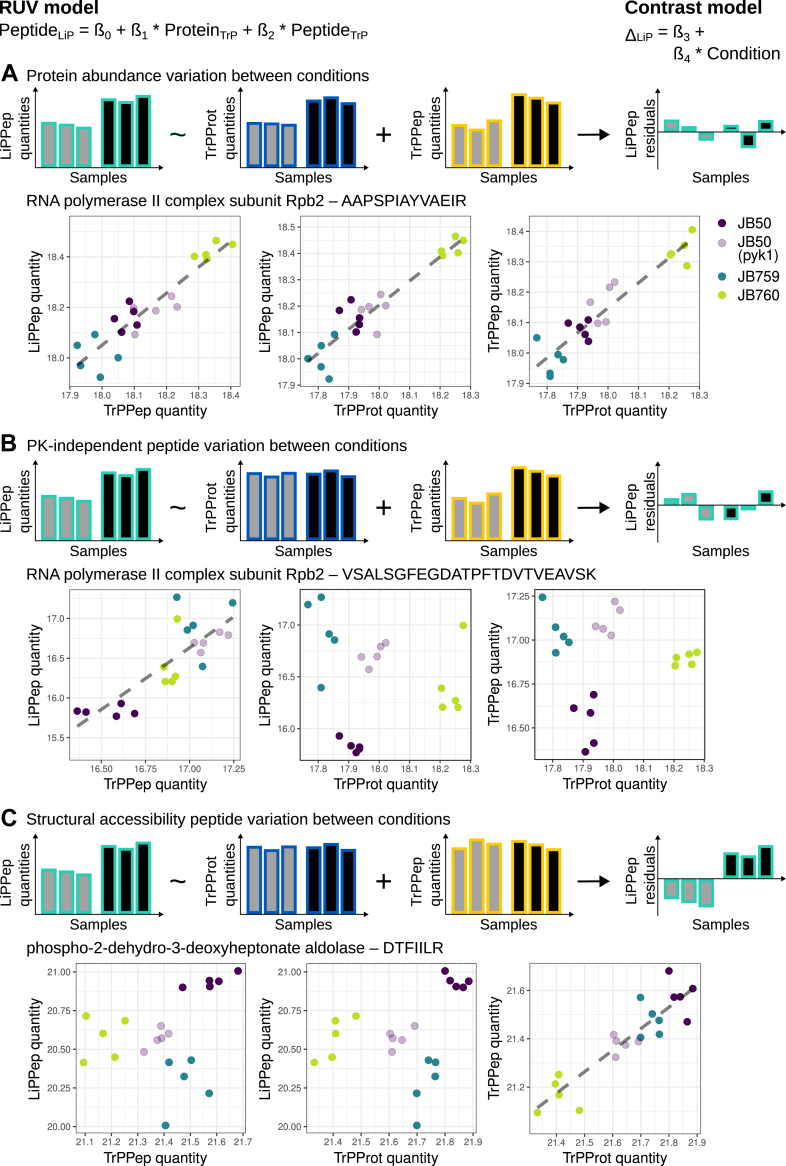
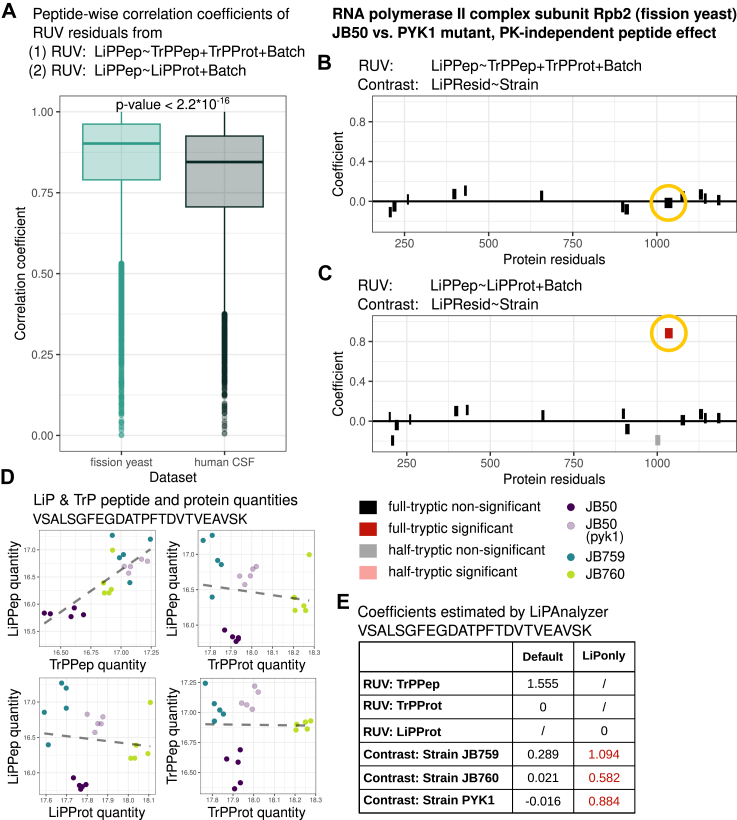
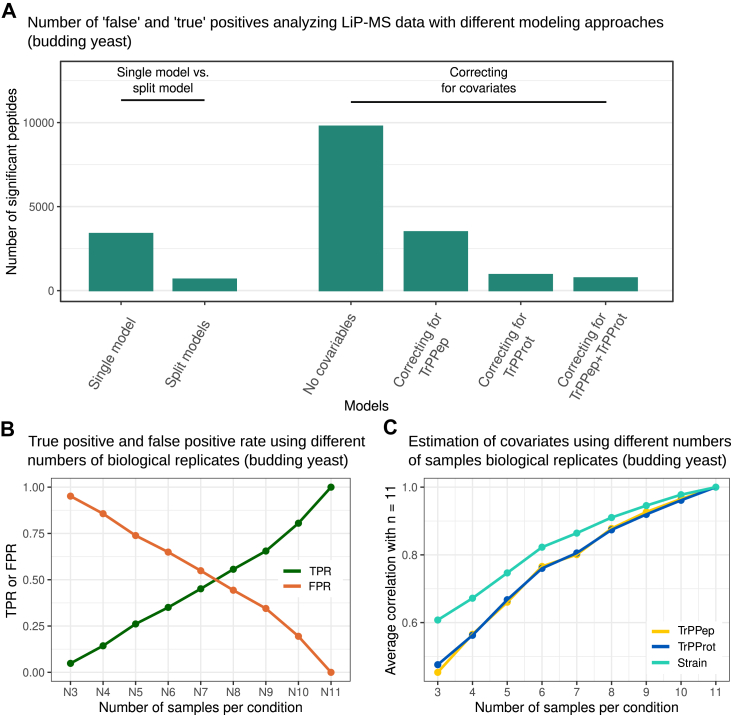
Limited proteolysis combined with mass spectrometry (LiP-MS) facilitates probing structural changes on a proteome-wide scale. This method leverages differences in the proteinase K accessibility of native protein structures to concurrently assess structural alterations for thousands of proteins in situ. Distinguishing different contributions to the LiP-MS signal, such as changes in protein abundance or chemical modifications, from structural protein alterations remains challenging. Here, we present the first comprehensive computational pipeline to infer structural alterations for LiP-MS data using a two-step approach. 1) We remove unwanted variations from the LiP signal that are not caused by protein structural effects and 2) infer the effects of variables of interest on the remaining signal. Using LiP-MS data from three species, we demonstrate that this approach outperforms previously employed approaches. Our framework provides a uniquely powerful approach for deconvolving LiP-MS signals and separating protein structural changes from changes in protein abundance, posttranslational modifications, and alternative splicing. Our approach may also be applied to analyze other types of peptide-centric structural proteomics data, such as FPOP or molecular painting data.

Keywords: MS data analysis; R package; limited proteolysis-coupled mass spectrometry (LiP-MS); protein structure; proteomics data analysis; statistical modelling.


Conflict of interest statement

Conflict of interest P. P. is a scientific advisor for the company Biognosys AG (Zurich, Switzerland) and an inventor of a patent licensed by Biognosys AG that covers the LiP-MS method used in this protocol. The remaining authors declare no competing interests.

Figures

None
Graphical abstract
Fig. 1
Fig. 1
Experimental LiP-MS workflow. The proteome from samples under different conditions are extracted in nondenaturing, native conditions and digested with (A) trypsin-only, (B) PK (short time, limited proteolysis) followed by trypsin. Regions with a difference in the three-dimensional conformation (yellow) show a different digestion pattern in the limited proteolysis step. Subsequently, LiP and TrP intensities are quantified via mass spectrometry. (Created with BioRender.com).
Fig. 2
Fig. 2
Overview LiPAnalyzeR pipeline. Covariates, which are considered a source of unwanted variation (unwanted covariates), such as protein abundances, are regressed out from the LiP signal in an RUV step (left). Residuals containing the variation of interest are estimated from the RUV models. These residuals can be used for data visualization (PCA), clustering, and further downstream analysis (center). In the subsequent contrast step, the effects of the variable of interest are modeled on the residuals, identifying peptides with changes in the structural accessibility between conditions (left).
Fig. 3
Fig. 3
Computational approach for inferring accessibility changes between two or more conditions from LiP data. Different types of variation in LiP data are exemplified with four fission yeast strains (for details, see the following section and methods). A, protein abundance variation. Top: Schematic overview of LiPAnalyzeR applied to a peptide containing a protein abundance effect. The RUV model removes protein abundance variation from the LiP peptides, and no structural variation is inferred in the subsequent contrast model. Bottom: LiP peptide, TrP peptide, and TrP protein quantities of a peptide showing a protein abundance difference between the JB50 and JB759 strain in the fission yeast data (gray dashed line visualizes linear regression). Strains are plotted in different colors (JB50: purple, PYK1 mutant: light purple, JB759: blue, JB760: green). B, PK-independent peptide variation. Top: Schematic overview of LiPAnalyzeR applied to a peptide with a PK-independent peptide variation. The RUV model removes PK-independent peptide variation from the LiP peptides, and no structural variation is inferred in the subsequent contrast model. Bottom: LiP peptide, TrP peptide, and TrP protein of a peptide showing a PK-independent peptide variation between the JB50 and JB759 strain in the fission yeast data. All colors as in (A). C, structural accessibility variation. Top: Schematic overview of LiPAnalyzeR applied to a peptide with a structural accessibility variation reflected only in the LiP peptides. The RUV model does not account for the structural accessibility variation, hence the signal is still reflected in the resulting residuals and detected by the contrast model. Bottom: LiP peptide, TrP peptide, and TrP protein of a peptide showing variation in the structural accessibility between the JB50 and JB759 strain in the fission yeast data. All colors as in (A).
Fig. 4
Fig. 4
Investigation of PK-independent effects in LiP peptides, TrP peptides, and TrP protein quantities.A, peptide-wise Pearson correlation coefficients of LiPPep quantities with the TrPPep (yellow: median = 0.466, p-value <0.0001) or TrPProt (blue: median = 0.435, p-value <0.0001) quantities from the human CSF data. p-values were estimated with the Wilcoxon signed rank test (alternative hypothesis: true location is not equal to 0). B, correlation coefficients from (A) plotted against each other. A line going through the origin with a slope of 1 is added (light blue). C, alternatively spliced haptoglobin-related protein (P00739) visualized across LiP and TrP data. All peptides belonging to the main isoforms of P00739 and occurring in LiP and TrP data are visualized along the protein residues of isoforms of haptoglobin and the haptoglobin-related protein (top). Peptide-wise Pearson correlation coefficients between LiPPep & TrPProt (second from top), TrPPep & TrPProt (third from top), and LiPPep &TrPPep (bottom) are visualized along the protein residues. The protein is divided into five regions (R1-R5), where R1 is affected by alternative splicing. D, quantities of an example peptide from the haptoglobin-related protein affected by alternative splicing (R1). Samples with alternative splicing in R1 are red. E, quantities of an example peptide from the haptoglobin-related protein showing no effect by alternative splicing (R3). Samples with alternative splicing in R1 are red.
Fig. 5
Fig. 5
Removing unwanted PK-dependent variation from the LiP signal.p-values were estimated with the Wilcoxon signed rank test (alternative hypothesis: true location is not equal to 0). A and B, peptide-wise Pearson’s correlation coefficients between the ratio of LiP peptides to TrP peptides and TrP peptide quantities (yellow) as well as between the ratio of LiP peptides to TrP proteins and the TrP protein quantities (blue) in (A) fission yeast (blue: median = −0.090, p-value <0.0001; yellow: median = −0.388, p-value <0.0001) and (B) human CSF data (blue: median = −0.224, p-value <0.0001; yellow: median = −0.389, p-value <0.0001). C and D, peptide-wise Pearson’s correlation coefficients between the residuals of the RUV step run regressing out TrP peptide or TrP protein signals from LiP peptide quantities and TrP peptide or protein quantities. Residuals estimated from models using TrP peptides as a variable are correlated against TrP protein quantities (dark blue) and residuals of those models with TrP proteins are correlated against the TrP peptide quantities (dark yellow) in both (C) fission yeast (dark blue: median = 0.168, p-value <0.0001; dark yellow: median = 0.034, p-value <0.0001)) and (D) human CSF data (dark blue: median = 0.146, p-value <0.0001; dark yellow: median = 0.166, p-value <0.0001). E and F, residuals estimated from RUV models using both TrP peptides and proteins as variables correlated against TrP peptide (dark yellow) and TrP protein (dark blue) in (E) fission yeast (dark blue: median = 0, p-value <0.0001; dark yellow: median = 0, p-value <0.0001) and (F) human CSF data (dark blue: median = 0, p-value <0.0001; dark yellow: median = 0, p-value <0.0001).
Fig. 6
Fig. 6
Comparison of different regression approaches applied to remove TrP signal from LiP peptide quantities.A, peptide-specific coefficients for TrPPep and TrPProt from RUV models without constraints applied to fission yeast data. Peptides with at least one negative coefficient are displayed in orange. Number of peptides per quadrant: top left = 4320, top right = 5679, bottom left = 224, bottom right = 1525. B, peptide-specific coefficients for TrPPep and TrPProt from RUV models with constraints (coefficients of TrPPep and TrPProt ≥ 0) in fission yeast data. C, LiP peptide quantities plotted against TrP peptide (left) and TrP protein (middle) quantities for the peptide RALIDSPCSEFPR from 60s ribosomal protein L14. Different fission yeast strains are displayed in different colors (JB50: purple, PYK1 mutant: light purple, JB759: blue, JB760: green). Coefficients from the RUV step without constraints (n.c.) and with constraints (w.c., coefficients of TrPPep and TrPProt ≥ 0) are displayed (right), all of them have a corresponding p-value >0.05. D, LiP peptide quantities plotted against TrP peptide (left) and TrP protein (middle) quantities for the peptide GLPLEAVTTIAK from dihydroxyacetone kinase Dak1 (Colors as in c)). Coefficients from a combined modeling (c.m) approach including the RUV and contrast in one step and from a split modeling (s.m.) approach where RUV and contrast modeling is applied separately are displayed (right). Coefficients with a p-value <0.05 are red. E, peptide-wise coefficients for strain effects estimated on the technical replicates of budding yeast data using different modeling approaches: (1) combining the RUV and contrast step into one model (Equation 5, no constraints to the model), (2) running RUV without constraints and subsequently the contrast model on the resulting residuals (Equations (1), (2), (3), (4), no constraints in model 1) and (3) running RUV with constraints and subsequently the contrast model on the resulting residuals (Equations (1), (2), (3), (4), constraints in model 1 as described in method section). A regression line (red) and a line going through the origin with a slope of one is added (light blue) is shown in each plot.
Fig. 7
Fig. 7
Inferring changes in the structural accessibility of half-tryptic peptides.A, full-tryptic (black) and half-tryptic (gray) peptides detected in the 60S ribosomal protein L11 in fission yeast plotted along the protein residues. B, peptide-specific TrPPep and TrPProt coefficients estimated by the RUV models with constraints (coefficients of TrPPep and TrPProt ≥ 0) in fission yeast. C, strain coefficients estimated by the contrast models for full-tryptic and half-tryptic peptides of the ATP synthase subunit alpha in the JB759 strain using JB50 as the reference level. RUV for the full-tryptic peptides (dark) was performed with the default LiPAnalyzeR pipeline, while half-tryptic peptides (light) were analyzed in the HT-only modus. Significant peptides (i.e., those with a protein-wise FDR-corrected p-value <0.05 estimated from the contrast models) are displayed in red. D, strain coefficients estimated by the contrast models for full-tryptic and half-tryptic peptides of the phospho-2-dehydro-3-deoxyheptonate aldolase in the JB759 (left) and JB760 strain using JB50 as the reference level. RUV for the full-tryptic peptides was performed with the default LiPAnalyzeR pipeline, while half-tryptic peptides were analyzed in the HT-only mode. Colors as in (c).
Fig. 8
Fig. 8
Inferring structural changes from LiP data without using the trypsin-control measurements.A, peptide-wise Pearson’s correlation coefficients between the residuals from the RUV step run with (1) TrP peptide and protein quantities and (2) LiP protein quantities in fission yeast and human CSF data (Student's t test: p-value <2.2∗10−16). (Median, center; first and third quartile, lower and upper hinges; largest/smallest value no further than 1.5 × interquartile range of the hinge, whiskers; data points beyond are defined as outliers and plotted individually). B, peptide-specific coefficients of the PYK1 mutant estimated in the RUV step using the default LiPAnalyzeR analysis using JB50 as the reference strain plotted along the protein residuals. Full-tryptic peptides (dark) and half-tryptic peptides (light) are depicted; peptides with a protein-wise FDR corrected p-value <0.05 are displayed in red. C, as (B), but the RUV models were run in the LiP only mode, only correction for LiPProt signal. D, LiP and TrP peptide and protein quantities of VSALSGFEGDATPFTDVTVEAVSK plotted against each other. Colors indicate different strains (JB50: purple, PYK1 mutant: light purple, JB759: blue, JB760: green). E, table with coefficients estimated by LiPAnalyzeR for the fission yeast peptide VSALSGFEGDATPFTDVTVEAVSK with the RUV step using (1) TrP peptide and protein quantities and (2) LiP protein quantities. Coefficients with a significant p-value are depicted in red.
Fig. 9
Fig. 9
Performance comparison of modeling approaches and effect of the number of replicates.A, number of significant peptides (p-value <0.05) when analyzing LiP-MS budding yeast data with different modeling approaches. The single versus split model comparison (two left models) were run without constraining coefficients to be non-negative. All other models set constraints to the covariates TrP peptide and/or TrP proteins ( ≥ 0). B, effect of varying the number of biological replicates per strain (i.e. sampling N = 3 to N = 11 replicates out of all 11 samples) were analyzed with LiPAnalyzeR using default settings. True positive rate (TPR) and false positive rate (FPR) are plotted, with TP and false positive (FN) peptides defined based on the effects inferred when using all samples (p-value <0.05, 11/11 per strain, 22/22 in total). C, models as in (B) but showing correlation of the coefficients for TrP peptides (yellow), TrP protein (blue), and strain (turquoise) to the coefficients obtained for the whole set of all replicates.

Similar articles

Cited by

References

    1. Henzler-Wildman K., Kern D. Dynamic personalities of proteins. Nature. 2007;450:964–972. - PubMed
    1. Nussinov R., Tsai C.-J., Jang H. Protein ensembles link genotype to phenotype. PLOS Comput. Biol. 2019;15 - PMC - PubMed
    1. Tzeng S.-R., Kalodimos C.G. Protein activity regulation by conformational entropy. Nature. 2012;488:236–240. - PubMed
    1. Feng Y., De Franceschi G., Kahraman A., Soste M., Melnik A., Boersema P.J., et al. Global analysis of protein structural changes in complex proteomes. Nat. Biotechnol. 2014;32:1036–1044. - PubMed
    1. Savitski M.M., Reinhard F.B.M., Franken H., Werner T., Savitski M.F., Eberhard D., et al. Tracking cancer drugs in living cells by thermal profiling of the proteome. Science. 2014;346 - PubMed

LinkOut - more resources