. 2025 Mar 10;44(1):90.
doi: 10.1186/s13046-025-03343-5.

NONO interacts with nuclear PKM2 and directs histone H3 phosphorylation to promote triple-negative breast cancer metastasis

Affiliations

NONO interacts with nuclear PKM2 and directs histone H3 phosphorylation to promote triple-negative breast cancer metastasis

Qixiang Li et al. J Exp Clin Cancer Res. .

Abstract

Background: Emerging evidence has revealed that PKM2 has oncogenic functions independent of its canonical pyruvate kinase activity, serving as a protein kinase that regulates gene expression. However, the mechanism by which PKM2, as a histone kinase, regulates the transcription of genes involved in triple-negative breast cancer (TNBC) metastasis remains poorly understood.

Methods: We integrated cellular analysis, including cell viability, proliferation, colony formation, and migration assays; biochemical assays, including protein interaction studies and ChIP; clinical sample analysis; RNA-Seq and CUT&Tag data; and xenograft or mammary-specific gene knockout mouse models, to investigate the epigenetic modulation of TNBC metastasis via NONO-dependent interactions with nuclear PKM2.

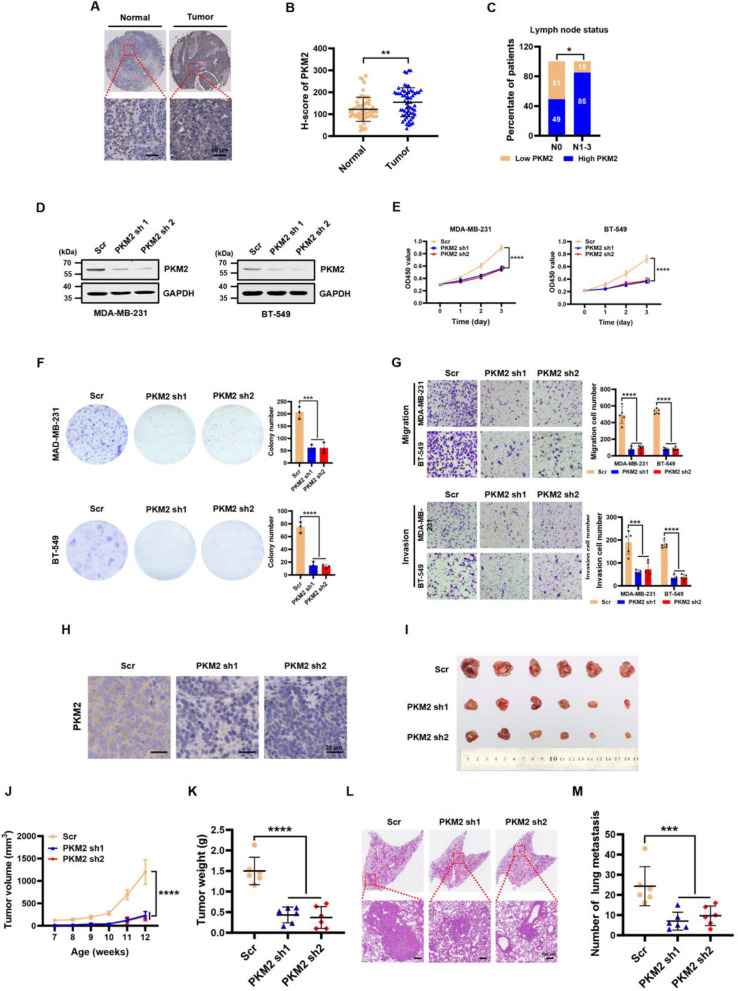
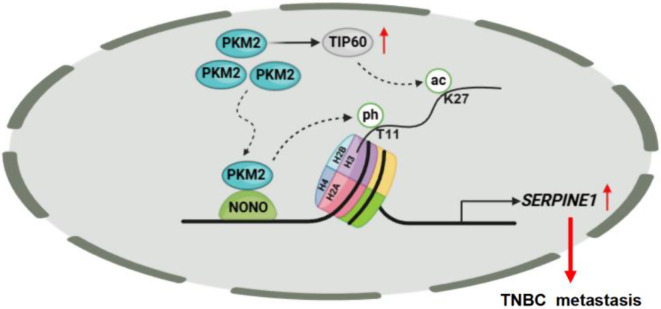
Results: We report that the transcription factor NONO directly interacts with nuclear PKM2 and directs PKM2-mediated phosphorylation of histone H3 at threonine 11 (H3T11ph) to promote TNBC metastasis. We show that H3T11ph cooperates with TIP60-mediated acetylation of histone H3 at lysine 27 (H3K27ac) to activate SERPINE1 expression and to increase the proliferative, migratory, and invasive abilities of TNBC cells in a NONO-dependent manner. Conditional mammary loss of NONO or PKM2 markedly suppressed SERPINE1 expression and attenuated the malignant progression of spontaneous mammary tumors in mice. Importantly, elevated expression of NONO or PKM2 in TNBC patients is positively correlated with SERPINE1 expression, enhanced invasiveness, and poor clinical outcomes.

Conclusion: These findings revealed that the NONO-dependent interaction with nuclear PKM2 is key for the epigenetic modulation of TNBC metastasis, suggesting a novel intervention strategy for treating TNBC.

Keywords: Epigenomics; H3T11ph; Metastasis; NONO; PKM2; Transcription; Triple-negative breast cancer.


Conflict of interest statement

Declarations. Ethics approval and consent to participate: All experiments involving animals were conducted according to the ethical policies and procedures approved by the Animal Ethical and Welfare Committee of Nanjing University (Nanjing, China) under protocol IACUC-2112006. Consent for publication: Not applicable. Competing interests: The authors declare no competing interests.

Figures

Fig. 1
Fig. 1
NONO directly interacts with nuclear PKM2. (A) Proteins biotinylated by BioID2 alone or NONO-BioID2 in MDA-MB-231 cells were examined via western blotting with HRP-conjugated streptavidin following SDS‒PAGE separation. PKM2 was identified via quantitative mass spectrometry and indicated based on its molecular weight. (B) Endogenous PKM2 was coimmunoprecipitated with anti-Flag M2 Sepharose beads in MDA-MB-231 and BT-549 cells overexpressing Flag-tagged NONO. IgG served as the negative control. (C) Coimmunoprecipitation of endogenous NONO with PKM2-Flag from MDA-MB-231 and BT-549 cells. (D) The cellular localization of NONO and PKM2 in MDA-MB-231 cells was examined by immunofluorescence with anti-NONO and anti-PKM2 antibodies and by nuclear counterstaining with DAPI. (E) A GST pull-down assay was used to detect the interaction between NONO and PKM2 in vitro (top). Purified GST and GST-NONO fusion proteins preabsorbed to glutathione-Sepharose beads were incubated with the prokaryotic His-PKM2 fusion protein. GST and GST-NONO fusion proteins were visualized by Coomassie blue staining (bottom). (F) Schematic diagram of NONO truncation mutants (top). The binding of His-PKM2 fusion proteins to purified GST, GST-NONO fragments F1 (1-143 aa), F2 (1-228 aa), F3 (144–471 aa), and F4 (229–471 aa) was assessed by a GST pull-down assay (middle). GST, GST-NONO F1, F2, F3, and F4 fusion proteins were visualized by Coomassie blue staining (bottom). (G) Schematic diagram of PKM2 in different truncated constructs (top). The binding of the His-NONO fusion protein to purified GST, GST-PKM2 fragments F1 (1-116 aa), F2 (117–218 aa), F3 (219–389 aa), and F4 (390–531 aa) was assessed by a GST pull-down assay (middle). GST, GST-PKM2 F1, F2, F3, and F4 fusion proteins were visualized by Coomassie blue staining (bottom)
Fig. 2
Fig. 2
Upregulation of NONO is associated with poor prognosis in TNBC patients and promotes TNBC cell proliferation and metastasis in vitro and in vivo. (A) Representative images of IHC staining of NONO in matched normal tissues (n = 60) and TNBC tissues (n = 60). Scale bar, 50 μm. (B) Quantitative analysis of NONO expression levels in matched normal tissue (Normal) and TNBC tissue (Tumor) samples. The data are presented as the mean ± SD. ***P < 0.001. (C) Percentage of TNBC patients with high expression or low expression of NONO stratified according to lymph node status (N0 or N1–3) (n = 60); two-sided Fisher’s exact test, *P < 0.05. (D) Kaplan‒Meier plot of the overall survival of TNBC patients with high expression (n = 31) or low expression (n = 29) of NONO. Long-rank test, P < 0.05. (E) NONO protein expression was detected by western blot in MDA-MB-231 and BT-549 cells infected with scramble control (Scr) or NONO shRNA lentivirus. GAPDH was used as a loading control. (F) Cell proliferation was examined by CCK-8 assays in MDA-MB-231 and BT-549 cells infected with Scr, NONO sh1, or NONO sh2 lentivirus. The data are presented as the mean ± SD. ****P < 0.0001 compared to the Scr control group. (G) Colony formation assay of MDA-MB-231 and BT-549 cells with Scr control or NONO knockdown. The number of colonies is shown in the bar graph (right panels). The data are presented as the mean ± SD (n = 3). ****P < 0.0001 compared to the Scr control group. (H) Representative images of the migration (top panels) and invasion ( bottom panels) of MDA-MB-231 and BT-549 cells in the Scr control and NONO knockdown groups. The data are presented as the mean ± SD (n = 5). ****P < 0.0001 compared to the Scr control group. (I) Representative IHC staining of NONO in mammary tumor tissues from MMTV-PyMT (FVB background) mice injected with Scr, NONO sh1, and NONO sh2 adeno-associated viruses (AAVs). Scale bar, 25 μm. J-L. Representative images of excised tumors (J), tumor growth curves (K), and tumor weights (L); representative H&E staining images of lungs (M); and images of the number of lung metastases (N) in MMTV-PyMT (FVB background) mice injected with Scr, NONO sh1, and NONO sh2 AAVs. Scale bar, 100 μm. All data are presented as the mean ± SD (n = 6). ****P < 0.0001 compared to the Scr control group
Fig. 3
Fig. 3
PKM2 expression is upregulated in TNBC, and knockdown of PKM2 diminishes TNBC cell proliferation and metastasis both in vitro and in vivo. (A) Representative images of IHC staining of PKM2 in matched normal tissues (n = 60) and TNBC tissues (n = 60). Scale bar, 50 μm. (B) Quantitative analysis of PKM2 expression levels in matched normal tissue (Normal) and TNBC tissue (Tumor) samples. The data are presented as the mean ± SD. **P < 0.01. (C) Percentage of TNBC patients with high expression or low expression of PKM2 stratified according to lymph node status (N0 or N1–3) (n = 60); two-sided Fisher’s exact test, *P < 0.05. (D) PKM2 protein expression was detected by western blot in MDA-MB-231 and BT-549 cells infected with the Scr, PKM2 sh1, or sh2 lentivirus. GAPDH served as a loading control. (E) Cell proliferation was examined by CCK-8 assays in MDA-MB-231 and BT-549 cells infected with the Scr, PKM2 sh1, or sh2 lentivirus. The data are presented as the mean ± SD. ****P < 0.0001 compared to the Scr control group. (F) Colony formation assay of MDA-MB-231 and BT-549 cells with Scr control or PKM2 knockdown. The number of colonies is shown in the bar graph (right panels). The data are presented as the mean ± SD (n = 3). ***P < 0.001, ****P < 0.0001 compared to the Scr control group. (G) Representative images of the migration (top panels) and invasion (bottom panels) of MDA-MB-231 and BT-549 cells after Scr control or PKM2 knockdown. The data are presented as the mean ± SD (n = 5). ***P < 0.001, ****P < 0.0001 compared to the Scr control group. (H) Representative IHC staining of PKM2 in mammary tumor tissues from MMTV-PyMT (FVB background) mice injected with Scr, PKM2 sh1, and PKM2 sh2 AAVs. Scale bar, 25 μm. I-K Representative images of excised tumors (I), tumor growth curves (J), and tumor weights (K); representative H&E staining images of lungs (L); and the number of lung metastases (M) from MMTV-PyMT (FVB background) mice injected with Scr, PKM2 sh1, or sh2 AAVs. Scale bar, 100 μm. All data are presented as the mean ± SD (n = 6). ***P < 0.001, ****P < 0.0001 compared to the Scr control group
Fig. 4
Fig. 4
SERPINE1 is a key transcriptional target of NONO and PKM2 in TNBC. (A) Venn diagram depicting the overlap of NONO- and PKM2-regulated differentially expressed genes (DEGs) in MDA-MB-231 cells obtained from RNA-seq analysis. (B) Gene ontology (GO) analysis to show the top 10 pathways with the smallest p.adjust values, pathway shown as the ordinate and gene ratio shown as the abscissa. The size indicated the number; the redder the color, the smaller the p.adjust value. (C) Heatmap showing the top 20 most differentially expressed genes whose expression was coupregulated or codownregulated by NONO or PKM2. NC: negative control; KD: knockdown. (D) Relative mRNA levels of SERPINE1, IL11, CCN2, RCN1, VDAC1, CDKN1A, ADAMTSL4, MATN2, FERMT2 and MCAM normalized to those of GAPDH were examined by RT‒qPCR in negative control (NC) or NONO-silenced MDA-MB-231 cells. The data are presented as the mean ± SD (n = 3). *P < 0.05, **P < 0.01, ***P < 0.001, ****P < 0.0001 compared to NC. (E) The protein expression of PAI-1 in NC and NONO-KD MDA-MB-231 cells was assessed by western blot analyses with the indicated antibodies. (F) Western blot analysis of the indicated proteins in MDA-MB-231 cells treated with NC, NONO-KD, or NONO-KD + PAI-1. GAPDH served as a loading control. (G) Cell proliferation was examined by a CCK-8 assay in MDA-MB-231 cells treated with NC, NONO-KD, or NONO-KD + PAI-1. The data are presented as the mean ± SD (n = 5). ****P < 0.0001 compared to the NONO-KD group. (H) Colony formation was determined in MDA-MB-231 cells treated with NC, NONO-KD, or NONO-KD + PAI-1. The data are presented as the mean ± SD (n = 3). **P < 0.01, ***P < 0.001 compared to the corresponding control. (I) Representative images of the migration (top panels) and invasion (bottom panels) of MDA-MB-231 cells treated with NC, NONO-KD, or NONO-KD + PAI-1. The data are presented as the mean ± SD (n = 5). ***P < 0.001, ****P < 0.0001 compared to the corresponding control. J-L. Photographs (J), tumor growth curves (K), and tumor weights (L) of MDA-MB-231 xenograft tumors from the scramble (Scr), NONO-KD, and NONO-KD + PAI-1 groups. The data are presented as the mean ± SD (n = 6). ***P < 0.001, ****P < 0.0001 compared to the corresponding control. M. Relative mRNA levels of SERPINE1, IL11, CCN2, RCN1, VDAC1, CDKN1A, ADAMTSL4, MATN2, FERMT2 and MCAM (normalized to GAPDH) were examined by RT‒qPCR in NC and PKM2-KD MDA-MB-231 cells. The data are presented as the mean ± SD (n = 3). **P < 0.01, ***P < 0.001, ****P < 0.0001 compared to NC. N. The protein expression of PAI-1 in NC and PKM2-KD MDA-MB-231 cells was assessed by western blot analyses with the indicated antibodies. O. Western blot analysis of the indicated proteins in MDA-MB-231 cells treated with NC, PKM2-KD, or PKM2-KD + PAI-1. GAPDH served as a loading control. P. Cell proliferation was examined by a CCK-8 assay in MDA-MB-231 cells treated with NC, PKM2-KD, or PKM2-KD + PAI-1. The data are presented as the mean ± SD (n = 5). ***P < 0.001 compared to the PKM2-KD group. Q. Colony formation was determined in MDA-MB-231 cells treated with NC, PKM2-KD, or PKM2-KD + PAI-1. The data are presented as the mean ± SD (n = 3). **P < 0.01, ***P < 0.001 compared with the PKM2-KD group. R. Representative images of the migration (top panels) and invasion (bottom panels) of MDA-MB-231 cells treated with NC, PKM2-KD, or PKM2-KD + PAI-1. The data are presented as the mean ± SD (n = 5). **P < 0.01, ****P < 0.0001 compared to the corresponding control. S. Pearson correlation scatter plot of H scores for NONO, PKM2, and PAI-1 in human TNBC tissues (n = 60)
Fig. 5
Fig. 5
NONO-dependent PKM2 and its nuclear protein kinase activity are critical for SERPINE1 transcription and TNBC progression. A and B. The protein and mRNA expression of PAI-1 was assessed by western blot (A) and RT‒qPCR (B) analyses in NC and NONO-KD MDA-MB-231 cells with or without PKM2 overexpression. GAPDH served as a loading control. The data are presented as the mean ± SD (n = 3). **P < 0.01, N.S. (not significant) compared to the corresponding control. C. ChIP‒qPCR was used to assess the enrichment of H3T11ph on SERPINE1 at the TSS in NC and NONO-KD MDA-MB-231 cells. IgG served as a negative control. The data are presented as the mean ± SD (n = 3). ***P < 0.001 compared to the NC group. D. Western blot analysis of the indicated protein levels in NC cells, PKM2-KD cells, PKM2-KD + PKM2-WT cells, PKM2-KD + PKM2-Y105F cells and PKM2-KD + PKM2-R399E cells. GAPDH served as a loading control. E. RT‒qPCR analysis of the mRNA levels of SERPINE1 (normalized to the level of GAPDH) in NC cells, PKM2-KD cells, PKM2-KD + PKM2-WT cells, PKM2-KD + PKM2-Y105F cells and PKM2-KD + PKM2-R399E cells. The data are presented as the mean ± SD (n = 3). **P < 0.01, ***P < 0.001, N.S. (not significant) compared to the corresponding control. F. A GST pull-down assay was utilized to examine the binding of prokaryotic GST, wild-type (WT) GST-PKM2 and GST-PKM2 point mutants with purified His-NONO fusion proteins (top). GST, GST-PKM2 WT, and diverse GST-PKM2 point mutants were visualized by Commassie staining (bottom). G. Endogenous NONO was coimmunoprecipitated in MDA-MB-231 cells overexpressing Flag-tagged PKM2-WT and PKM2-S406A. IgG served as the negative control. H. The distribution of endogenous PKM2 and exogenous PKM2-Flag proteins in the nucleus and cytoplasm in MDA-MB-231 cells overexpressing Flag-tagged PKM2-WT and PKM2-S406A was examined by western blot. GAPDH and Lamin B1 served as loading controls. I. Western blot analysis of the indicated proteins in PKM2-WT- and PKM2-S406A-overexpressing MDA-MB-231 cells. GAPDH and histone H3 served as loading controls. J. RT‒qPCR analysis of the mRNA levels of SERPINE1 (normalized to the level of GAPDH) in MDA-MB-231 cells overexpressing PKM2-WT or the PKM2-S406A mutant. The data are presented as the mean ± SD (n = 3). ***P < 0.001. K. Cell proliferation was examined by CCK-8 assays in MDA-MB-231 cells overexpressing PKM2-WT or the PKM2-S406A mutant. L. Colony formation assay of MDA-MB-231 cells overexpressing PKM2-WT and the PKM2-S406A mutant. The number of colonies is shown in the bar graph (right panels). The data are presented as the mean ± SD (n = 3). **P < 0.01 compared to the PKM2-WT group. M. Representative images of the migration (top panels) and invasion (bottom panels) of MDA-MB-231 cells overexpressing PKM2-WT or the PKM2-S406A mutant. The data are presented as the mean ± SD (n = 5). ***P < 0.001 compared to the corresponding control
Fig. 6
Fig. 6
NONO and PKM2-mediated H3T11ph coordinate with H3K27ac on SERPINE1 gene loci. (A) Western blot analysis of the indicated histone H3 modifications in NC and PKM2-silenced MDA-MB-231 cells. Histone H3 served as a loading control. (B) Heatmaps of CUT&Tag data showing that NONO, H3T11ph, and H3K27ac levels at the transcription start site (TSS) significantly decreased (Decreased) or unchanged (Others) in the NC, NONO-KD, or PKM2-KD MDA-MB-231 cells, respectively. (C) Integrative Genomics Viewer (IGV) tracks representing the signals of NONO, H3T11ph, and H3K27ac at SERPINE1 gene loci from CUT&Tag data in MDA-MB-231 cells. (D) ChIP‒qPCR analysis of the enrichment of NONO, H3T11ph, and H3K27ac at SERPINE1 gene loci at the indicated positions as in (C) in MDA-MB-231 cells. IgG served as a negative control. The data are presented as the mean ± SD (n = 3). *P < 0.05, **P < 0.01, ***P < 0.001, and ****P < 0.0001 compared to the corresponding control
Fig. 7
Fig. 7
NONO or PKM2 deficiency reduces PAI-1 expression and inhibits the malignant progression of spontaneous mammary tumors in mice. A. Breeding strategy for mammary-specific NONO-knockout (KO) transgenic mice. The genotype of the NONO-KO female mice was Cre+/−::PyMT+::NONOfl/fl, and Cre−/−::PyMT+::NONOfl/fl female mice were used as control mice. B-D. Representative images of excised tumors (B), tumor growth curves (C), representative H&E staining images of lungs (left panels) and the number of lung metastases (right panels) (D) from control (n = 6) and NONO-KO (n = 8) mice. Scale bar, 100 μm. All data are presented as the mean ± SD. **P < 0.01 compared to the control group. E. Western blot analysis of the indicated proteins in tumors extracted from control and NONO-KO mice. GAPDH served as a loading control. F. Representative H&E staining and IHC staining of NONO, PAI-1, and Ki-67 in mammary tumor tissues from MMTV-PyMT mice (C57BL/6 background) in the control and NONO-KO groups. Scale bar, 25 μm. G. Breeding strategy for mammary-specific PKM2-knockout (KO) transgenic mice. The genotype of the PKM2-KO female mice was Cre+/−::PyMT+::PKM2fl/fl, and Cre−/−::PyMT+::PKM2fl/fl female mice were used as control mice. H-J. Representative images of excised tumors (H), tumor growth curves (I), representative H&E staining images of lungs (left panels) and the number of lung metastases (right panels) (J) from control (n = 5) and PKM2-KO (n = 5) mice. Scale bar, 100 μm. All data are presented as the mean ± SD. **P < 0.01 compared to the control group. K. Western blot analysis of the indicated proteins in tumors extracted from control and PKM2-KO mice. GAPDH and histone H3 served as loading controls. L. Representative H&E staining and IHC staining of PKM2, PAI-1, H3T11ph and Ki-67 in mammary tumor tissues from MMTV-PyMT mice in the control and PKM2-KO groups. Scale bar, 25 μm
Fig. 8
Fig. 8
The schematic diagram illustrates the mechanism by which the interaction between NONO and nuclear PKM2 promotes TNBC metastasis. NONO interacts with nuclear PKM2, and PKM2-mediated H3T11ph cooperates with TIP60-mediated H3K27ac to activate SERPINE1 transcription, thereby promoting cell metastasis in TNBC

References

    1. Bray F, Laversanne M, Sung HYA, Ferlay J, Siegel RL, Soerjomataram I, Jemal A. Global cancer statistics 2022: GLOBOCAN estimates of incidence and mortality worldwide for 36 cancers in 185 countries. CA Cancer J Clin. 2024;74:229–63. - PubMed
    1. Gluz O, Liedtke C, Gottschalk N, Pusztai L, Nitz U, Harbeck N. Triple-negative breast cancer–current status and future directions. Ann Oncol. 2009;20:1913–27. - PubMed
    1. Dent R, Trudeau M, Pritchard KI, Hanna WM, Kahn HK, Sawka CA, Lickley LA, Rawlinson E, Sun P, Narod SA. Triple-negative breast cancer: clinical features and patterns of recurrence. Clin Cancer Res. 2007;13:4429–34. - PubMed
    1. Bradner JE, Hnisz D, Young RA. Transcriptional addiction in Cancer. Cell. 2017;168:629–43. - PMC - PubMed
    1. Bushweller JH. Targeting transcription factors in cancer - from undruggable to reality. Nat Rev Cancer. 2019;19:611–24. - PMC - PubMed

MeSH terms

LinkOut - more resources