. 2025 Mar 10;10(5):e187172.
doi: 10.1172/jci.insight.187172.

Involvement of lncRNA MIR205HG in idiopathic pulmonary fibrosis and IL-33 regulation via Alu elements

Affiliations

Involvement of lncRNA MIR205HG in idiopathic pulmonary fibrosis and IL-33 regulation via Alu elements

Tsuyoshi Takashima et al. JCI Insight. .

Abstract

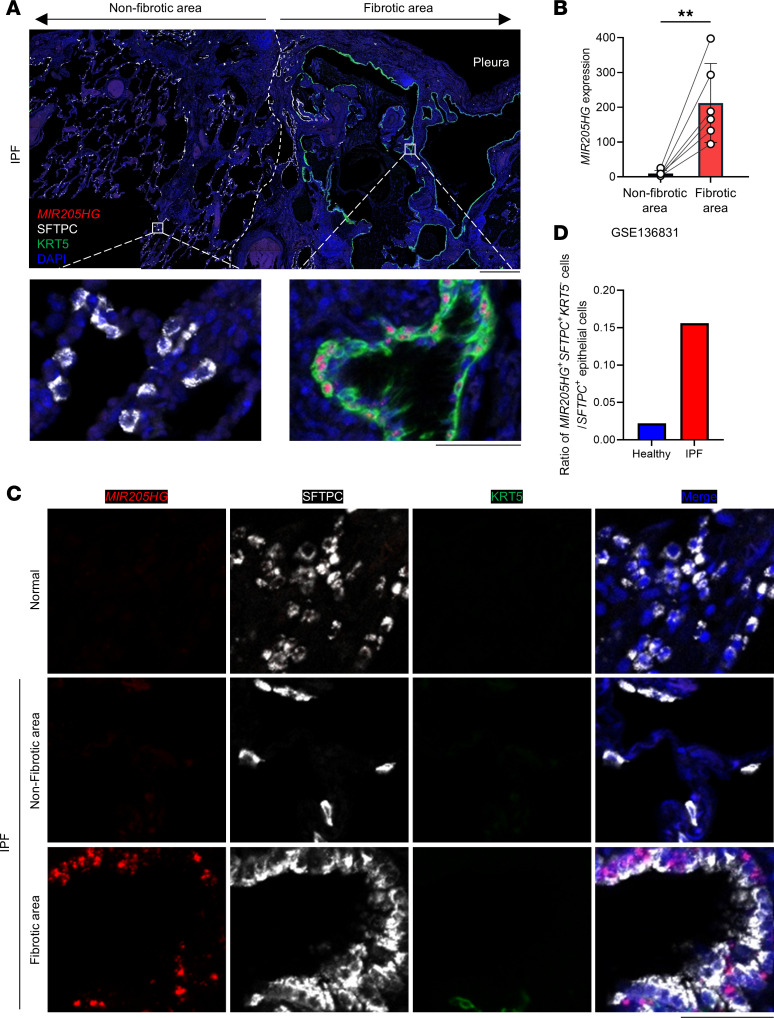
Idiopathic pulmonary fibrosis (IPF) causes remodeling of the distal lung. Pulmonary remodeling is histologically characterized by fibrosis, as well as appearance of basal cells; however, the involvement of basal cells in IPF remains unclear. Here, we focus on the long noncoding RNA MIR205HG, which is highly expressed in basal cells, using RNA sequencing. Through RNA sequencing of genetic manipulations using primary cells and organoids, we discovered that MIR205HG regulates IL-33 expression. Mechanistically, the AluJb element of MIR205HG plays a key role in IL-33 expression. Additionally, we identified a small molecule that targets the AluJb element, leading to decreased IL-33 expression. IL-33 is known to induce type 2 innate lymphoid cells (ILC2s), and we observed that MIR205HG expression was positively correlated with the number of ILC2s in patients with IPF. Collectively, these findings provide insights into the mechanisms by which basal cells contribute to IPF and suggest potential therapeutic targets.

Keywords: Inflammation; Innate immunity; Noncoding RNAs; Pulmonology; RNA processing.


Conflict of interest statement

Conflict of interest: The authors have declared that no conflict of interest exists.

Figures

Figure 1
Figure 1. lncRNA MIR205HG is upregulated in basal cells.
(A) Representative images of HE, SFTPC IHC, and KRT5 IHC staining in alveoli beneath the pleura of healthy and IPF lungs. Scale bar: 100 μm. HE, hematoxylin and eosin; SFTPC, surfactant protein C; KRT5, keratin 5. (B) Uniform manifold approximation and projection (UMAP) visualization of cell types in healthy and IPF lungs. (C) Proportion of epithelial cell type distribution in healthy and IPF lungs. (D) Volcano plot and bar graph (basal cell enriched lncRNA) of DEGs in AT2 cells and basal cells. The cutoff values were log2FC > 1, FDR < 0.05. (E) UMAP visualization of MIR205HG expression. (F) Expression of MIR205HG in healthy control and IPF patients. Public bulk RNA-Seq datasets (GSE92592, ref. , and GSE124685, ref. 20) were used. Data represent mean ± SD. **P < 0.01, ***P < 0.001; P values were determined by 2-tailed Mann-Whitney U test. (BE) Public scRNA-Seq data (GSE136831) (7) were used for analysis.
Figure 2
Figure 2. lncRNA MIR205HG is an independent poor prognostic factor in patients with IPF.
(A) Overview of clinical implication assessment based on MIR205HG expression in patients with IPF (n = 29). UIP, usual interstitial pneumonia. (B) Representative images of MIR205HG ISH staining in patients with IPF. Scale bar: 10 mm. Zoomed image and virtual composite image after HALO software analysis are shown. Scale bar: 50 μm. (C) Plots of MIR205HG expression in patients with IPF (n = 29). The median was used as a cutoff value. (D) Kaplan-Meier curves for OS rate (%) in patients with IPF (n = 29) divided into high-MIR205HG group (n = 15) and low-MIR205HG group (n = 14). HR, 5.23; 95% CI, 1.80–15.17; P = 0.0042. P values were determined by log-rank test. (E) Forest plots of univariate and multivariate Cox regression analysis in the correlation between MIR205HG expression and other clinical factors. P values were determined by Cox proportional hazards method. (F) Representative of whole image of HE and MIR205HG ISH staining. Bar graph of MIR205HG expression in patients with IPF of the favorable-prognosis group (survival ≥ 3 years, n = 16) and the unfavorable-prognosis group (survival < 3 years, n = 13, and lung transplant recipients [LTx recipients], n = 6). Scale bar: 10 mm. Data represent mean ± SD. **P < 0.01; P values were determined by 2-tailed Mann-Whitney U test.
Figure 3
Figure 3. A subset of MIR205HG+ abnormal AT2 cells is increased in patients with IPF.
(A) Representative confocal images of MIR205HG ISH, SFTPC IHC, and KRT5 IHC staining in nonfibrotic and fibrotic areas of patients with IPF (n = 6). Scale bars: 500 μm (upper) and 50 μm (lower). (B) Quantification of MIR205HG expression in nonfibrotic and fibrotic areas. Data represent mean ± SD. **P < 0.01; P values were determined by 2-tailed paired t test. (C) Representative confocal images of MIR205HG ISH, SFTPC IHC, and KRT5 IHC staining in healthy (n = 6) and nonfibrotic or fibrotic area of patients with IPF (n = 6). Scale bar: 50 μm. (D) Ratio of MIR205HG+SFTPC+KRT5 cells in SFTPC+ epithelial cell population in healthy and IPF lungs. Public scRNA-Seq data (GSE136831) were used for analysis.
Figure 4
Figure 4. A subset of MIR205HG+ abnormal AT2 cells express IL-33 and exist in close proximity to ILC2s in patients with IPF.
(A) GO analysis of biological processes upregulated in MIR205HG+SFTPC+KRT5 epithelial cells compared with MIR205HGSFTPC+KRT5 epithelial cells. Pie chart showing 39 processes with significant differences. The parentheses indicate the number of enrichment terms that belong to the process. Significant differences were determined using an enrichment score > 0.7, P < 0.005. Bar graph showing 6 inflammation-related processes among 39 processes. (B) Cell–cell communication network showing the ratio of receptor–ligand pairs between the MIR205HG+SFTPC+KRT5 cells (MIR205HG+ AT2 cells) and other meta cell types, classified as lymphoid, myeloid, stromal, and endothelial cell clusters (Figure 1B) compared with MIR205HGSFTPC+KRT5 cells (MIR205HG AT2 cells). P values were determined by the permutation test. (C) Volcano plot of DEGs in MIR205HGSFTPC+KRT5 cells and MIR205HG+SFTPC+KRT5 cells. The cutoff values were log2FC > 1, FDR < 0.05. (D) Representative confocal images of MIR205HG ISH, HTII-280 IHC, and IL-33 IHC staining in control (n = 3) and IPF patients (n = 3). Orange arrows indicate MIR205HG+HTII-280+IL-33+ AT2 cells. Scale bar: 50 μm. (E) Quantification of AT2 cells expressing MIR205HG and IL-33 in healthy and IPF patients in D. (F) Number of CD127+GATA3+CD45+ cells in healthy (n = 28) and IPF (n = 32) lungs. Bars represent the median and 95% CI. **P < 0.01; P values were determined by 2-tailed Mann-Whitney U test. (G) Representative images of MIR205HG ISH, CD127 IHC, and GATA3 IHC staining in control (n = 4) and IPF patients (n = 4). Scale bar: 50 μm. (A, B, E, and F) Public scRNA-Seq data (GSE136831) were used for analysis.
Figure 5
Figure 5. Overexpression of lncRNA MIR205HG upregulates IL33 mRNA in alveolar organoids.
(A) Schematic of experimental design for identification of MIR205HG-regulated genes in MIR205HG-OE alveolar organoids. (B) qRT-PCR showing MIR205HG expression in negative vector (NV) and MIR205HG-OE alveolar organoids. (C) Representative images of MIR205HG ISH staining in NV and MIR205HG-OE alveolar organoids. Orange arrows indicate MIR205HG signals, which are detected in nuclei (circled by orange dotted line). Scale bar: 20 μm. (D) Quantification of organoid number in NV and MIR205HG-OE alveolar organoids. Scale bar: 1 mm. (E) Volcano plot of DEGs in NV and MIR205HG-OE alveolar organoids. Top 40 DEGs are shown. The IL33 gene is indicated among upregulated genes in MIR205HG-OE alveolar organoids. The cutoff values were log2FC > 2, P < 0.05. (F) qRT-PCR showing IL33 expression in NV and MIR205HG-OE alveolar organoids. (B, D, and F) Data represent mean ± SD. *P < 0.05, **P < 0.01, ***P < 0.001; P values were determined by 2-tailed t test.
Figure 6
Figure 6. Overexpression of pre–miR-205 does not upregulate IL33 mRNA in alveolar organoids.
(A) Venn diagram showing DEGs of MIR205HG-OE alveolar organoids (upper) and target genes of miR-205 with miRDB (26) (lower left) and TargetMiner (27) (lower right) datasets. (B) Schematic of experimental design for identification of pre–mir-205 regulated genes in miR-205–OE alveolar organoids. (C) qRT-PCR showing miR-205-3p and miR-205-5p expression in NV and miR-205–OE alveolar organoids. Data represent mean ± SD. N.D., not detected. (D) qRT-PCR showing MIR205HG expression in NV and miR-205–OE alveolar organoids. (E) qRT-PCR showing IL33 expression in NV and miR-205–OE alveolar organoids. (D and E) Data represent mean ± SD. P values were determined by 2-tailed t test.
Figure 7
Figure 7. Downregulation of MIR205HG decreases IL33 mRNA and IL-33 protein expression in basal cells.
(A) Experimental procedure for the identification of genes positively regulated by MIR205HG in NHBE cells using the CRISPR interference/dCas9-KRAB (CRISPR/dCas9) system. (B) qRT-PCR showing MIR205HG expression in NV and MIR205HG-KD NHBE cells. NC, negative control. (C) Cell growth assay in NV and MIR205HG-KD NHBE cells. (D) Venn diagram showing downregulated genes in MIR205HG-KD NHBE cells (bulk RNA-Seq, left) and basal cell enriched genes in Figure 1D (scRNA-Seq, right). The cutoff values were log2FC > 1 (bulk RNA-Seq and scRNA-Seq). Two common mRNAs are listed below. (E) Heatmap showing common mRNAs that are downregulated genes in MIR205HG-KD NHBE cells and basal cell enriched genes shown in D. Fragments per kilobase of exon per million mapped fragment (FPKM) > 0.5 mRNAs were visualized. (F) qRT-PCR showing IL33 mRNA expression in NV and MIR205HG-KD NHBE cells. (G) Western blot showing IL-33 protein expression in NV and MIR205HG-KD NHBE cells. (H) Schematic of experimental design for identification of MIR205HG-regulated genes in IPF patient–derived airway organoids using the CRISPR/dCas9 system. (I) qRT-PCR showing MIR205HG expression in NV and MIR205HG-KD IPF patient–derived airway organoids. (J) qRT-PCR showing IL33 mRNA expression in NV and MIR205HG-KD of IPF patient–derived airway organoids. (K) Volcano plot of DEGs in MIR205HG basal cell and MIR205HG+ basal cell in public scRNA-Seq data (GSE136831). The cutoff values were log2FC > 1, FDR < 0.05. (L) Representative images of MIR205HG ISH and IL-33 IHC staining in patients with IPF. Scale bar: 10 μm. (B, C, F, I, and J) Data represent mean ± SD. *P < 0.05, **P < 0.01, ***P < 0.001; P values were determined by 1-way ANOVA with Holm-Šídák post hoc test.
Figure 8
Figure 8. MIR205HG and IL33 mRNA binds to fused in sarcoma RBP in NHBE cells and IPF patient–derived airway organoids.
(A) Schematic illustration for the identification of RBPs common to MIR205HG and IL33 using starBase v2.0 (32). (B) Integrative Genomics Viewer (IGV) showing MIR205HG and IL33 loci in NV and MIR205HG-KD NHBE cells. The motif sequences of the respective MIR205HG and IL33 recognized by the FUS protein are shown. Motif sequences were obtained from public HITS-CLIP dataset (GSE43308) (33). (C) RIP workflow to examine the binding of the respective MIR205HG and IL33 to the FUS protein. Immunoprecipitation (IP) was performed using an FUS antibody and an IgG antibody as control. RNA enrichment in the FUS antibody was calculated using the IgG antibody as control. (D) Western blot showing FUS protein expression in FUS IP using NHBE cells and IPF patient–derived airway organoids. (E) qRT-PCR showing MIR205HG and IL33 in FUS RIP using NHBE cells and IPF patient–derived airway organoids. N.D., not detected. Data represent mean ± SD. ***P < 0.001; P values were determined by 2-tailed t test. (F) Representative images of MIR205HG and IL33 double ISH staining in alveolar organoids and IPF patient–derived airway organoids. Scale bar: 10 μm. (G) Representative images of MIR205HG and IL33 double ISH staining in IPF tissue samples. Scale bar: 10 μm.
Figure 9
Figure 9. Knockdown of FUS protein reduces expression of MIR205HG and IL33 mRNA.
(A) qRT-PCR showing FUS, MIR205HG, and IL33 expression of FUS-KD NHBE cells and IPF patient–derived airway organoids using shRNA. Data represent mean ± SD. *P < 0.05, **P < 0.01, ***P < 0.001; P values were determined by 1-way ANOVA with Holm-Šídák post hoc test. (B) Representative images of FUS IHC staining in alveolar organoids and IPF patient–derived airway organoids. Scale bar: 100 μm. (C) Representative images of FUS IHC staining in healthy and IPF tissue samples. Scale bar: 100 μm. (D) Schematic illustration showing predictions from the experimental results.
Figure 10
Figure 10. AluJb element of MIR205HG regulates IL33 expression.
(A) Workflow of ChIRP for binding of IL33 using the MIR205HG probe. (B) qRT-PCR of MIR205HG and IL33 in ChIRP for MIR205HG enrichment in NHBE cells and IPF patient–derived airway organoids. ChIRP was performed using MIR205HG probe and LacZ probe as control. Data represent mean ± SD. N.D., not detected. (C) Predicted binding sites of the AluJb element of MIR205HG and the Alu elements (intron) of IL33. A total of 9 sites with similarity to AluJb or Alu elements were found in the Alu element of IL33. Blue and red indicate sequence similarity between the AluJb element of MIR205HG and the sense/antisense strand of the Alu elements of IL33, respectively. (D) Vector design for functional analysis of the AluJb element of MIR205HG. (E) RT-PCR products obtained by transfection of NHBE cells with primers shown in D. Deletion of the AluJb element (ΔAluJb) of MIR205HG was confirmed. (F) qRT-PCR showing IL33 mRNA and IL33 pre-mRNA expression under E conditions. Data represent mean ± SD. **P < 0.01, ***P < 0.001; P values were determined by 1-way ANOVA with Holm-Šídák post hoc test. (G) Schematic illustration of the experimental results.
Figure 11
Figure 11. Screening of small molecules that reduce IL-33 expression by targeting the AluJb element.
(A) Overview of the screening scheme for the identification of small molecules that reduce IL33 expression. surface plasmon resonance (SPR) experiments were carried out on 7 motifs from the MIR205HG predicted secondary structure containing the AluJb element. The SPR experiments identified 3 small molecules (ANP77, DQzG, and TO239) from a library of 1,273 small molecules. These 3 small molecules were assessed for IL33 expression in NHBE cells. (B) IGV plot showing the target sequence region for small molecule screening. The target sequence was selected as the yellow background region containing the AluJb element. (C) Predicted secondary structure containing AluJb element of MIR205HG. RNA secondary structure was predicted with RNAfold and visualized with forna. (D) The structure of the small molecule DQzG.
Figure 12
Figure 12. Small molecule DQzG targets the AluJb element of MIR205HG and reduces IL-33 expression.
(A and B) qRT-PCR showing MIR205HG, IL33 mRNA, and IL33 pre-mRNA expression in NHBE cells (24 hours and 48 hours) and IPF patient–derived airway organoids (48 hours and 72 hours) after 3 μM and 5 μM DQzG treatment. Data represent mean ± SD. *P < 0.05, **P < 0.01, ***P < 0.001; P values were determined by 1-way ANOVA with Holm-Šídák post hoc test. (C and D) Western blot showing IL-33 protein expression in NHBE cells (24 hours and 48 hours) and IPF patient–derived airway organoids (48 hours and 72 hours) after 3 μM and 5 μM DQzG treatment. IL-33 expression levels in the western blot were quantified using ImageJ software (NIH). (E) Schematic illustration of the experimental results.
Figure 13
Figure 13. The high-MIR205HG group exhibits high IL-33 expression and increased number of ILC2s compared with the low-MIR205HG group in patients with IPF.
(A) Plot of IL33 expression for healthy lungs (n = 28) and patients with IPF (n = 32) in epithelial cell cluster. (B) Representative images of EpCAM IHC and IL-33 IHC staining in healthy lungs (n = 15) and patients with IPF (n = 29) in the cohort from Supplemental Figure 15A. Scale bar: 100 μm. (C) Plot of EpCAM+ and IL-33+ expression in B. (D) Plot of EpCAM+ and IL-33+ expression in high-MIR205HG group (n = 15) and low-MIR205HG group (n = 14). The 2 groups based on expression of MIR205HG in Figure 1I were used. (E) Plots of EpCAM+ and IL-33+ expression in patients with IPF (n = 29). The median was used as the cutoff value of EpCAM+ and IL-33+ expression. (F) Kaplan-Meier curves for OS rate (%) in patients with IPF (n = 29) divided into high-EpCAM+ and IL-33+ group (n = 15) and low-EpCAM+ and IL-33+ group (n = 14). HR, 4.49; 95% CI, 1.57–12.86; P = 0.0011; P values determined by log-rank test. (G) Representative images of CD127 IHC and GATA3 IHC staining in high-MIR205HG group (n = 15) and low-MIR205HG group (n = 14). Scale bar: 100 μm. (H) Plot of number of ILC2s (CD127+ and GATA3+) in G. *P < 0.05; P values determined by 2-tailed Student’s t test. (I) Correlation analysis of MIR205HG+ and IL33+ epithelial cells using patients with IPF (n = 32). Pearson’s r = 0.799 and P < 0.0001; P values are 2 sided. (J) Plot of IL33+ epithelial cells in high-MIR205HG group (n = 16) and low-MIR205HG group (n = 16). (K) Number of ILC2s (CD127+GATA3+CD45+ cells) in high-MIR205HG group (n = 16) and low-MIR205HG group (n = 16). (L) Schematic illustration of the experimental results. (A, C, D, J, and K) *P < 0.05, ***P < 0.001; P values were determined by 2-tailed Mann-Whitney U test. (J and K) Bars represent the median and 95% CI. (A and IK) Public scRNA-Seq data (GSE136831) were used for analysis.

References

    1. Lederer DJ, Martinez FJ. Idiopathic pulmonary fibrosis. N Engl J Med. 2018;378(19):1811–1823. doi: 10.1056/NEJMra1705751. - DOI - PubMed
    1. Richeldi L, et al. Idiopathic pulmonary fibrosis. Lancet. 2017;389(10082):1941–1952. doi: 10.1016/S0140-6736(17)30866-8. - DOI - PubMed
    1. Katzen J, Beers MF. Contributions of alveolar epithelial cell quality control to pulmonary fibrosis. J Clin Invest. 2020;130(10):5088–5099. doi: 10.1172/JCI139519. - DOI - PMC - PubMed
    1. Richeldi L, et al. Efficacy and safety of nintedanib in idiopathic pulmonary fibrosis. N Engl J Med. 2014;370(22):2071–2082. doi: 10.1056/NEJMoa1402584. - DOI - PubMed
    1. King TE, et al. A phase 3 trial of pirfenidone in patients with idiopathic pulmonary fibrosis. N Engl J Med. 2014;370(22):2083–2092. doi: 10.1056/NEJMoa1402582. - DOI - PubMed

MeSH terms

LinkOut - more resources