. 2025 Mar 10;10(5):e171783.
doi: 10.1172/jci.insight.171783.

Altered inflammatory mucosal signatures within their spatial and cellular context during active ileal Crohn's disease

Affiliations

Altered inflammatory mucosal signatures within their spatial and cellular context during active ileal Crohn's disease

Vasantha L Kolachala et al. JCI Insight. .

Abstract

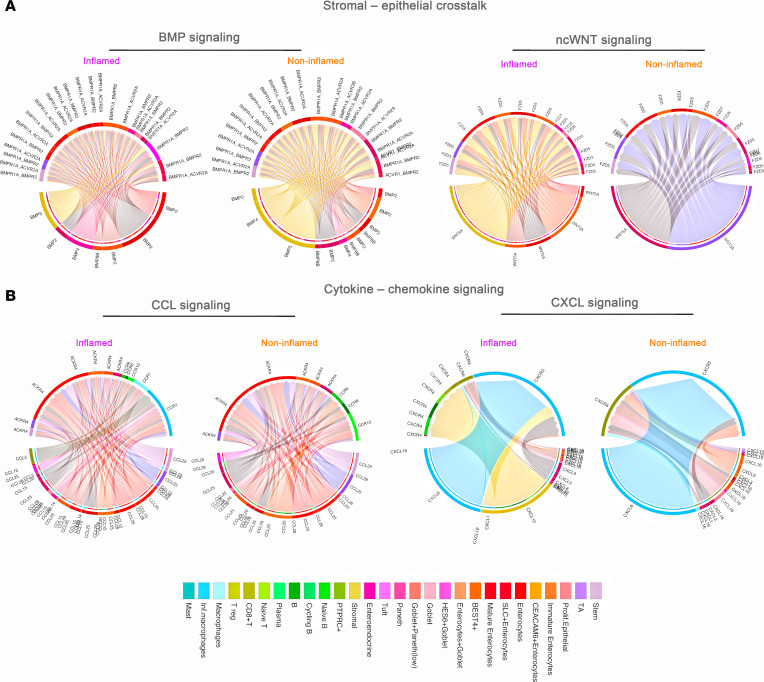
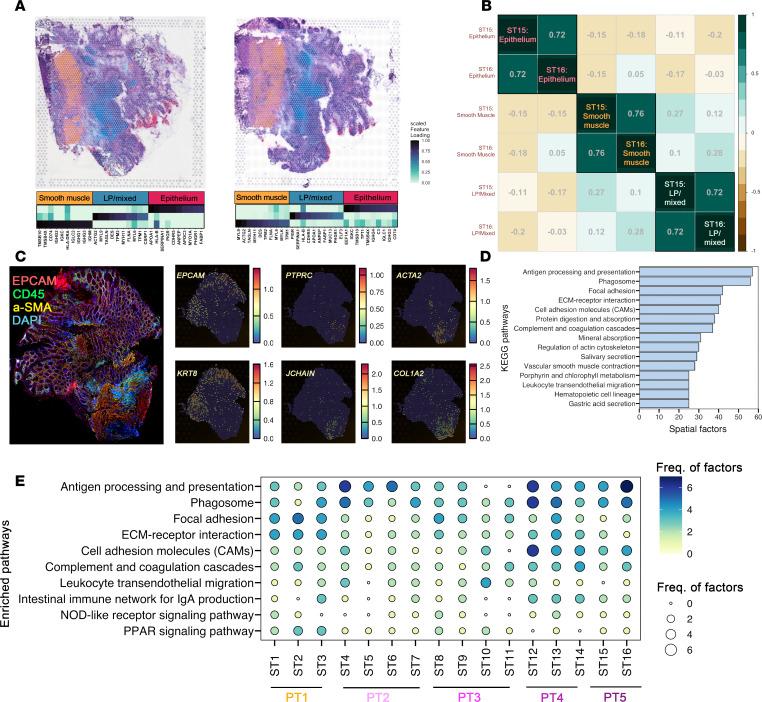
Crohn's disease (CD) involves a complex intestinal microenvironment driven by chronic inflammation. While single-cell RNA sequencing has provided valuable insights into this biology, the spatial context is lost during single-cell preparation of mucosal biopsies. To deepen our understanding of the distinct inflammatory signatures of CD and overcome the limitations of single-cell RNA sequencing, we combined spatial transcriptomics of frozen CD surgical tissue sections with single-cell transcriptomics of ileal CD mucosa. Coexpressed genes and cell-cell communication from single-cell analyses and factorized genes from spatial transcriptomics revealed overlapping pathways affected in inflamed CD, like antigen presentation, phagosome activity, cell adhesion, and extracellular matrix. Within the pathways, early epithelial cells showed evidence of significant changes in gene expression and subtype composition, while spatial mapping revealed the location of the events, particularly antigen presentation from epithelial cells in the base of the crypt. Furthermore, we identified early epithelial cells as a potential mediator of the MHC class II pathway during inflammation, which we validated by spatial transcriptomics cell subtype deconvolution. Therefore, the inflammation from CD appears to change the types of interactions detectable between epithelial cells with immune and mesenchymal cells, likely promoting the conditions for more macrophage infiltration into these inflammatory microdomains.

Keywords: Antigen; Cell migration/adhesion; Gastroenterology; Inflammation; Inflammatory bowel disease.


Figures

Figure 1
Figure 1. Experimental setup and single-cell transcriptomic analysis.
(A) Schematic of ileal biopsy collection and single-cell and spatial transcriptomic analysis. (B) Uniform manifold approximation and projection (UMAP) of integrated and annotated single-cell transcriptomic data (n = 15), with 28 annotated cell types. (C) Heatmap showing the expression of cell type–specific marker genes. (D) Inferred trajectory of epithelial and immune differentiation.
Figure 2
Figure 2. Cellular and transcriptional changes associated with mucosal inflammation in CD.
(A) UMAP overlay colored by inflammation status. (B) Inflammation score density for inflamed and noninflamed separately in overall mucosa (leftmost plot) and box plots of selected cell types showing significant difference in inflammation score between the 2 groups (Wilcoxon’s rank sum test, P value < 0.05). (C) Bar plot showing cell lineage proportions between inflamed and noninflamed groups in overall mucosa. (D) Box plots of the selected cell types with significance (Student’s t test, P value < 0.05).Box plots show the interquartile range, median (line), and minimum and maximum (whiskers).
Figure 3
Figure 3. Antigen presentation and cell adhesion molecules are promoted during mucosal inflammation.
(A) Bar plot of the number of significantly (adj. P value < 0.05) differentially expressed genes (DEGs) in inflamed (purple) versus noninflamed (orange) cells per cell type using the MAST algorithm. (B) Bar plots of the frequency of Kyoto Encyclopedia of Genes and Genomes (KEGG) pathways significantly (P value < 0.05) enriched in epithelial (pink) and immune (blue) cell type modules of the DEGs. (C) Heatmaps of key epithelial module scores across the cell types in inflamed and noninflamed groups. Dots represent enrichment. (D) Heatmaps of key immune module scores across the cell types in inflamed and noninflamed groups. Dots represent enrichment.
Figure 4
Figure 4. Altered putative cell signaling networks in inflamed compared with noninflamed CD.
(A) Bar plot of total number of possible RL interactions. (B) Number of RL interactions between the 3 major compartments. (C) Heatmap illustrating the selected signaling patterns in inflamed and noninflamed CD. (D) Chord diagrams depicting the MHC class II (MHC-II) signaling network (left 2 plots) and dot plot showing RL signaling toward naive T cells uniquely in inflamed (right). Edge color in the chord plot represents the signaling source, and segments with arrows are the signaling targets.
Figure 5
Figure 5. Dynamic alterations in signaling pathways in the inflamed Crohn’s ileal mucosa.
(A) Inferred BMP and ncWNT RL communications between stromal and epithelial cell types. BMP, bone morphogenetic protein; nc, noncanonical. (B) Inferred CCL and CXCL RL pairs across multiple cell types.
Figure 6
Figure 6. Non-negative matrix factorization delineates compartmentalization and regionalization of disease-implicated pathways.
(A) Mapping of non-negative matrix factorization (NNMF) (n = 3 factors) genes onto representative spatial tissues ST15 and ST16 from patient 5. LP, lamina propria. (B) Correlation of factors across spatial tissue sections from patient 5. (C) Immunofluorescence (left) and RNA expression (right) of markers corresponding to compartments. a-SMA, α–smooth muscle actin. (D) Top pathways enriched across all patients using NNMF (n = 10 factors per slide). (E) Dot plot representing enriched pathways corresponding to factors per patient tissue.
Figure 7
Figure 7. Combinatorial single-cell and spatial transcriptomics depict heterogeneous mucosal microdomains of inflammatory activity.
(A) Venn diagram of numbers of intersecting and unique enriched pathways between ST factors (top blue circle, “Spatial Factor Pathways”) and single-cell transcriptomic modules (bottom yellow circle, “SC Module Pathways”). (B) Frequencies of top KEGG pathways enriched in both spatial factors and single-cell modules. (C) Mapping cumulative expression of pathway genes from combined methods onto noninflamed ST2 from patient 1 (top) and inflamed ST7 from patient 2 (bottom) spatial tissue sections.
Figure 8
Figure 8. CARD on ST tissues within regions highly enriched in antigen presentation.
(A) For spatial tissues ST1 (patient 1, noninflamed) on top and ST14 (patient 4, inflamed) on bottom. Plots from left to right represent hematoxylin and eosin staining (leftmost panel), overlay of antigen processing and presentation genes onto spatial tissues (second to leftmost, color coded with yellow representing low score and blue as high score), cell type deconvolution of spatial tissues with expanded view of regions containing high enrichment of antigen processing and presentation genes as pies (second to rightmost), and stacked bar plot of 20 representative spots’ cell type proportions (rightmost). (B) Cell type colocalization corresponding to 20 representative highly enriched antigen processing and presentation spots in ST1 (patient 1, noninflamed) on left and ST14 (patient 4, inflamed) on right. (C) Proportional changes in highly enriched antigen processing and presentation spots per slide per cell type (y axis) compared across patients (x axis). (D) Immunofluorescence staining of CD74 (red) with DAPI (blue) in the ileal mucosal epithelium in noninflamed (left) and inflamed (right) CD (n = 4). (E) Western blot of CD74 using β-actin as loading control (left) in nontreated (NT) and IFNG/TNFA-treated ileal organoids and immunofluorescence (right) of CD74 (red) and E-cadherin (Ecad) (green) with DAPI (blue) of ileal organoids without and with IFNG/TNFA treatment (n = 3).

References

    1. Ng SC, et al. Worldwide incidence and prevalence of inflammatory bowel disease in the 21st century: a systematic review of population-based studies. Lancet. 2017;390(10114):2769–2778. doi: 10.1016/S0140-6736(17)32448-0. - DOI - PubMed
    1. Benchimol EI, et al. Incidence, outcomes, and health services burden of very early onset inflammatory bowel disease. Gastroenterology. 2014;147(4):803–813. doi: 10.1053/j.gastro.2014.06.023. - DOI - PubMed
    1. Cosnes J, et al. Epidemiology and natural history of inflammatory bowel diseases. Gastroenterology. 2011;140(6):1785–1794. doi: 10.1053/j.gastro.2011.01.055. - DOI - PubMed
    1. Lewis JD, et al. Incidence, prevalence, and racial and ethnic distribution of inflammatory bowel disease in the United States. Gastroenterology. 2023;165(5):1197–1205. doi: 10.1053/j.gastro.2023.07.003. - DOI - PMC - PubMed
    1. Alfredsson J, Wick MJ. Mechanism of fibrosis and stricture formation in Crohn’s disease. Scand J Immunol. 2020;92(6):e12990. doi: 10.1111/sji.12990. - DOI - PMC - PubMed