[Preprint]. 2025 Sep 30:2025.02.25.639765.
doi: 10.1101/2025.02.25.639765.

A single-nucleus transcriptomic atlas of the adult Aedes aegypti mosquito

Affiliations

A single-nucleus transcriptomic atlas of the adult Aedes aegypti mosquito

Olivia V Goldman et al. bioRxiv. .

Update in

  • A single-nucleus transcriptomic atlas of the adult Aedes aegypti mosquito.
    Goldman OV, DeFoe AE, Qi Y, Jiao Y, Weng SC, Wick B, Houri-Zeevi L, Lakhiani P, Morita T, Razzauti J, Rosas-Villegas A, Tsitohay YN, Walker MM, Hopkins BR; Aedes aegypti Mosquito Cell Atlas Consortium; Haeussler M, Akbari OS, Duvall LB, White-Cooper H, Sorrells TR, Sharma R, Li H, Vosshall LB, Shai N. Goldman OV, et al. Cell. 2025 Oct 30:S0092-8674(25)01137-7. doi: 10.1016/j.cell.2025.10.008. Online ahead of print. Cell. 2025. PMID: 41172998

Abstract

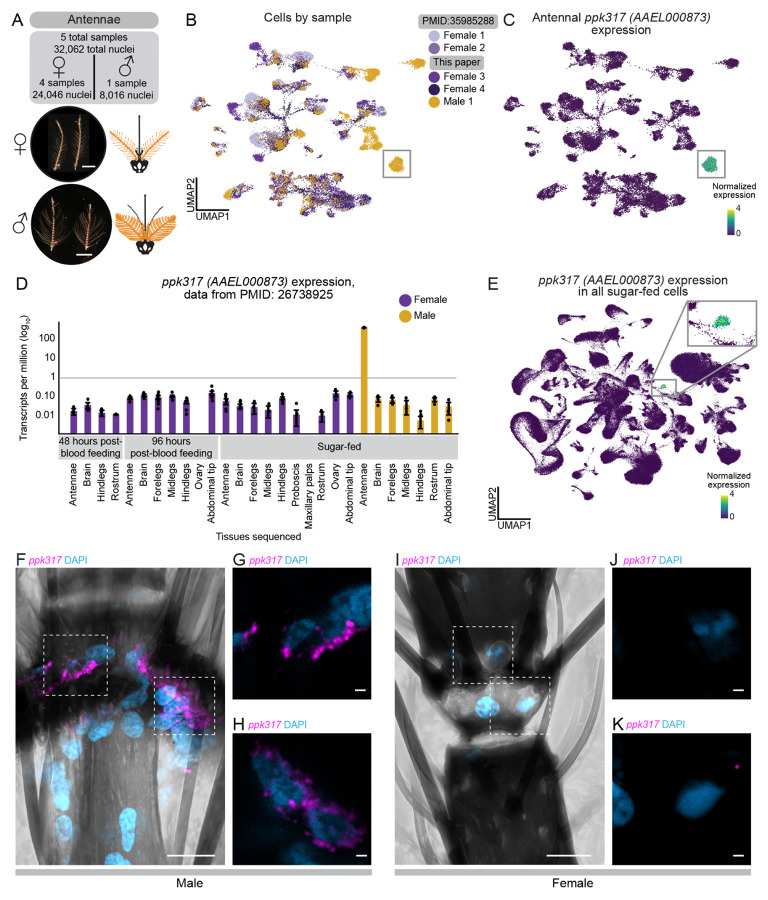
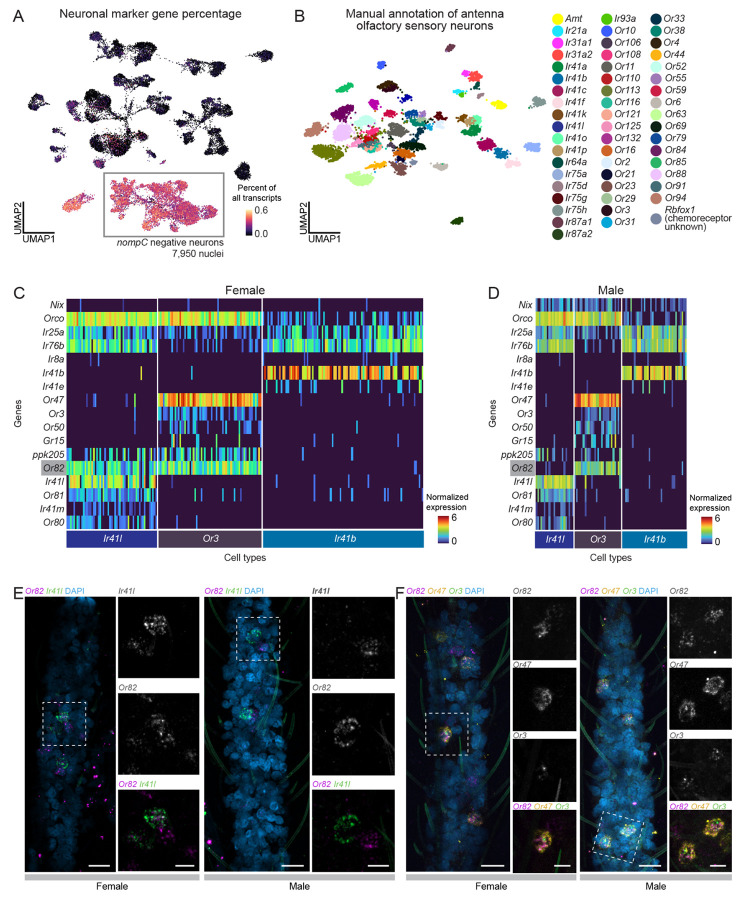
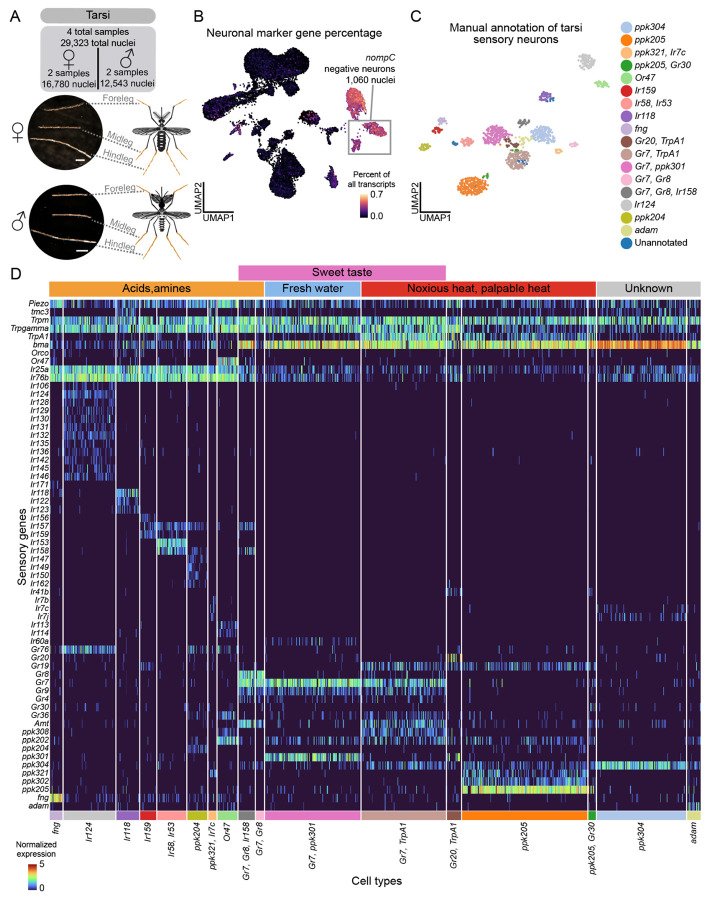
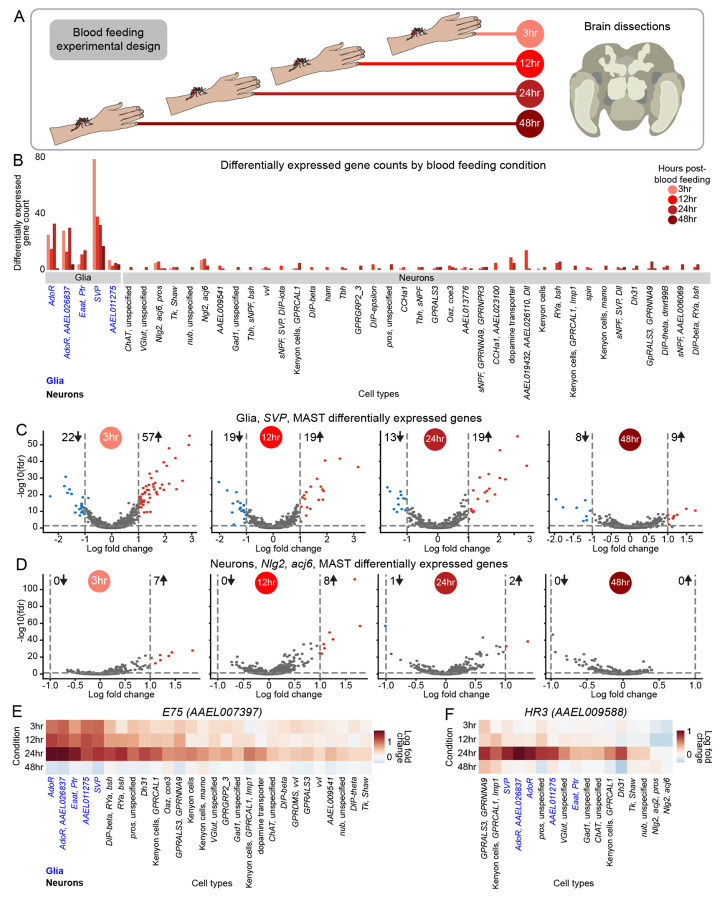
The female Aedes aegypti mosquito's remarkable ability to hunt humans and transmit pathogens relies on her unique biology. Here, we present the Aedes aegypti Mosquito Cell Atlas, a comprehensive single-nucleus RNA sequencing dataset of more than 367,000 nuclei from 19 dissected tissues of adult female and male Aedes aegypti, providing cellular-level resolution of mosquito biology. We identify novel cell types and expand our understanding of sensory neuron organization of chemoreceptors to all sensory tissues. Our analysis uncovers male-specific cells and sexually dimorphic gene expression in the antenna and brain. In female mosquitoes, we find that glial cells in the brain, rather than neurons, undergo the most extensive transcriptional changes following blood feeding. Our findings provide insights into the cellular basis of mosquito behavior and sexual dimorphism. The Aedes aegypti Mosquito Cell Atlas resource enables systematic investigation of cell type-specific expression across all mosquito tissues.

Keywords: Aedes aegypti; cell atlas; mosquito; sexual dimorphism; snRNA-seq.


Conflict of interest statement

Declaration of Interests O.S.A. is a founder of Agragene, Inc. and Synvect, Inc., with equity interest. The terms of this arrangement have been reviewed and approved by the University of California, San Diego in accordance with its conflict of interest policies.

Figures

Figure 1.
Figure 1.. Aedes aegypti Mosquito Cell Atlas tissues and data.
(A) Photos of Aedes aegypti female (left) and male (right). Numbers indicate location of collected tissues (listed in legend boxes). Photos by Alex Wild. (B) Schematic of Aedes aegypti Mosquito Cell Atlas workflow. A sample represents an individual library prepared with 10x Genomics commercial kits. Sample counts shown for each sex. Tissues underwent nuclei extraction followed by fluorescence-activated cell sorting (FACS), single-nucleus RNA libraries preparation with 10x Genomics commercial kits, then sequenced using the Illumina platform unless stated otherwise. Raw sequencing data was aligned with Cell Ranger. Cells were identified and ambient RNA removed using CellBender. Samples were individually processed for cell quality control filtering, yielding 367,096 high-quality nuclei (nuclei counts shown for each sex and for blood-feeding conditions). (C-D) Uniform manifold approximation and projection (UMAP) for dimension reduction of 330,364 nuclei from mated, sugar-fed samples colored by sex (C) and dissected tissue (D). Blood-fed samples excluded. For batch processing consistency, testes sample underwent ambient RNA removal and cell identification with CellBender (spermatids removed). (E) Nuclei counts from mated, sugar-fed (grey) and mated, blood-fed (red) samples for each major cell type, sorted by abundance. (F) UMAP of nuclei from all mated, sugar-fed samples, colored and numbered by manual annotation of 66 distinct cell types (“Level 2” annotations, legend) and major cell type categories (“Level 1”, grey headers) (Figure S2B). For more information on annotation, see Table S1.
Figure 2.
Figure 2.. Localization and validation of male testes and female salivary gland RNA transcripts.
(A) Dissected male testis with anatomical diagram of testes pair. One sample (10x Genomics library) yielded 12,074 nuclei from 212 animals (male, mated, sugar-fed). Scale bar: 500 μm. (B) UMAP of nuclei, colored and numbered by manual cell type annotation (legend). (C-G) UMAP illustrating raw counts (unique molecular identifiers) of a selection of genes used to annotate testes data. Corresponding validation using RNA in situ hybridization (below) are labeled with indicated cell types (number and color from B). Genes: vas (AAEL004978) (C), betaTub (AAEL019894) (D), eya (AAEL019952) (E), ana (AAEL007208) (F), and AAEL001918 (G). Raw counts shown to correlate expression patterns to in situ images (normalized gene expression shown in Data S1). Scale bar: 100 μm for C-F; 50 μm for G. (H) Dissected female Aedes aegypti salivary gland with anatomical diagram of salivary gland pair. One sample yielded 10,898 nuclei from 495 animals (female, mated, sugar-fed). Scale bar: 500 μm. (I) UMAP of nuclei, colored and numbered by manual cell type annotation (legend). (J) Fraction of total transcripts per cell of antimicrobial peptides gene set: CECD (AAEL029046), CECN (AAEL029047), putative cecropins (AAEL029041 and AAEL029104), DEFA (AAEL003841), DEFC (AAEL003832), DEFD (AAEL003857), DPT1 (AAEL004833), GAM1 (AAEL004522). Ends of color bar trimmed 0.1% for visibility. (K) Dot plot illustrating mean normalized expression of secreted protein and antimicrobial genes by cell type (Table S1). Localization of genes colored in purple has been validated by previous work. Normalized expression is ln([(raw count/total cell counts)*median total counts across cells]+1).
Figure 3.
Figure 3.. Male-specific ppk317 cell type in the Aedes aegypti antenna.
(A) Dissected antennae from female (top) and male (bottom) Aedes aegypti with anatomical diagrams (orange). Five samples yielded 32,062 nuclei from ~2400 animals (mated, sugar-fed). Scale bar: 500 μm. (B) UMAP of antennal nuclei, colored by sample (female = 4, male = 1). Putative male-specific cluster highlighted (grey box). (C) ppk317 (AAEL000873) normalized expression. Cluster with high expression highlighted (grey box). Normalized expression is ln([(raw count/total cell counts)*median total counts across cells]+1). (D) ppk317 expression [transcripts per million (log10)] in previously published bulk RNA-seq data of indicated tissues. Female tissues (purple) are from animals that were sugar-fed, post-blood feeding (48 or 96 hours). Male tissues are sugar-fed (yellow). Both sexes were mated; females were not provided an egg-laying substrate before tissue collection. (E) ppk317 normalized expression in all mated, sugar-fed nuclei. Cluster with high expression highlighted (grey box, enlarged in inset). (F) Maximum-intensity projection of ppk317 RNA in situ hybridization (magenta) with DAPI nuclear staining (blue) from whole-mount male antenna (mated, sugar-fed). Scale bar: 10 μm. (G-H) Single Z plane (0.24 μm) corresponding to highlighted boxes from (F). Left box (G), right box (H). Scale bar: 1 μm. (I) Maximum-intensity projection of ppk317 RNA in situ hybridization (magenta) with DAPI nuclear staining (blue) from whole-mount female antenna (mated, sugar-fed). Scale bar: 10 μm. (J-K) Maximum-intensity projection corresponding to highlighted boxes from (I). Left box (J), right box (K). Scale bar: 1 μm.
Figure 4.
Figure 4.. Precise sexually-dimorphic expression of Or82 in a single antennal chemosensory cell type.
(A) Fraction of total transcripts per cell of neuronal genes set: Syt1 (AAEL000704), brp (AAEL018153), nSyb (AAEL024921), CadN (AAEL000597). nompC (AAEL019818)-negative cells highlighted (grey box). For nompC gene percentage, see Figure S4B. (B) UMAP of antenna nompC-negative (olfactory sensory) neurons, colored by manual cell type annotation (legend). (C-D) Heatmap of Ir41l, Or3, and Ir41b cells female (C) and male (D) samples. Selected genes are indicated in rows, cells in columns, with cell type annotations below. Heatmap colors represent normalized expression. Normalized expression is ln([(raw count/total cell counts)*median total counts across cells]+1). (E) Maximum-intensity projection of Or82 (magenta) and Ir41l (green) RNA in situ hybridization with DAPI nuclear staining (blue) from whole-mount female and male antenna (mated, sugar-fed). Scale bar: 10 μm. Highlighted white boxes enlarged to the right, with indicated probes. Scale bar: 5 μm. (F) Maximum-intensity projection of Or82 (magenta), Or47 (yellow) and Or3 (green) RNA in situ hybridization with DAPI nuclear staining (blue) from whole-mount female and male antenna (mated, sugar-fed). Scale bar: 10 μm. Highlighted white boxes enlarged to the right, with indicated probes. Scale bar: 5 μm.
Figure 5.
Figure 5.. Tarsi sensory neurons are polymodal.
(A) Dissected tarsi from female (top) and male (bottom) Aedes aegypti with anatomical diagram (orange). Four samples yielded 29,323 nuclei from 630 animals (mated, sugar-fed). Scale bar: 500 μm (B) Fraction of total transcripts per cell of neuronal genes set: Syt1, brp, nSyb, CadN. nompC-negative cells highlighted (grey box). For nompC gene percentage, see Data S4. (C) UMAP of tarsi chemosensory (nompC-negative) neurons after filtering, colored by manual cell type annotation (legend). (D) Heatmap of chemoreceptor gene expression in all annotated clusters. Selected genes indicated in rows, cells in columns, with annotations for cell type (below) and respective sensory function (above). Heatmap colors represent normalized expression. Normalized expression is ln([(raw count/total cell counts)*median total counts across cells]+1).
Figure 6.
Figure 6.. Brain annotation identifies sexually dimorphic Kenyon cells and glia.
(A) Dissected brain from female (top) and male (bottom) Aedes aegypti with anatomical diagram. Data was collected from sugar-fed females and males, and blood-fed females 3, 12, 24, and 48 hours after blood feeding. Five samples yielded 68,898 nuclei from 182 animals. Scale bar: 500 μm (B) UMAP of brain nuclei, colored by sample (female = 7, male = 2). (C-D) Normalized expression of neuronal marker nSyb (C) and glial marker repo (AAEL027131) (D). Normalized expression is ln([(raw count/total cell counts)*median total counts across cells]+1). (E) UMAP of nuclei from all samples, colored and numbered by manual annotation using marker genes (legend). Major cell type annotations represented in shaded gray headers. (F) Fraction of total transcripts per cell of 30 putative Kenyon cell gene markers (Table S1). Annotated Kenyon cells highlighted (grey box). (G) Bar plot showing cell types with at least 2 differentially expressed genes (DEGs) between sugar-fed male and female cells. Clusters colored by cell identity: Kenyon cells (light blue), glia (dark blue), other neurons (grey) (Table S3). Significant genes had ∣log fold change∣ >1, false discovery rate <0.05, determined by MAST on normalized expression. (H-I) UMAP of Kenyon cell nuclei from all sugar-fed brains, colored by manual cell type annotation (H), and by sex (I). GPRCAL1, Imp1 cells (AAEL010043, AAEL006876) highlighted (dotted area). (J) Volcano plot of DEGs in GPRCAL1, Imp1 Kenyon cells. Significant genes indicated in red. Male biased genes on right, female biased genes on left. (K-L) GPRNPY6 (AAEL017005) (K) and pKa-R1 (AAEL019956) (L) normalized expression in Kenyon cell nuclei from all sugar-fed brains.
Figure 7.
Figure 7.. Glia show extensive transcriptional changes after blood feeding.
(A) Blood feeding experimental design. (B) Bar plot showing cell types with differentially expressed genes (DEGs) between sugar-fed and blood-fed female cells. Bars colored by blood-feeding condition. Glia and neuron cell types labeled below. Significant genes had ∣log fold change∣ >1, false discovery rate <0.05, determined by MAST on normalized expression (Table S2). Normalized expression is ln([(raw count/total cell counts)*median total counts across cells]+1). (C-D) Volcano plots of DEGs for SVP glia (AAEL002765) (C) and Nlg2, acj6 neurons (AAEL014303, AAEL005507) (D) for sugar-fed compared to indicated blood-feeding timepoint Number of downregulated (blue) and upregulated (red) genes indicated alongside arrows. (E-F) Heatmaps of log fold change of E75 (AAEL007397) (E) and HR3 (AAEL009588) (F) for glia (blue) and neuron (black) cell types. Cell types are sorted by the total log fold change across all timepoints. Cell types shown have >10 cells in each timepoint, and at least one timepoint where change from sugar-fed condition had a false discovery rate <0.05.

References

    1. World Health Organization ed. World malaria report 2024.
    1. Disease Outbreak News; Dengue - Global Situation (2024).
    1. Kraemer M.U.G., Reiner R.C., Brady O.J., Messina J.P., Gilbert M., Pigott D.M., Yi D., Johnson K., Earl L., Marczak L.B., et al. (2019). Past and future spread of the arbovirus vectors Aedes aegypti and Aedes albopictus. Nat. Microbiol. 4, 854–863. 10.1038/s41564-019-0376-y. - DOI - PMC - PubMed
    1. Gubler D.J. (2009). Vector-borne diseases. Rev. Sci. Tech. 28, 583–588. 10.20506/rst.28.2.1904. - DOI - PubMed
    1. Souza-Neto J.A., Powell J.R., and Bonizzoni M. (2019). Aedes aegypti vector competence studies: A review. Infect. Genet. Evol. 67, 191–209. 10.1016/j.meegid.2018.11.009. - DOI - PMC - PubMed

Publication types

LinkOut - more resources