[Preprint]. 2025 Feb 25:2025.02.19.638943.
doi: 10.1101/2025.02.19.638943.

Resistance to Radiation Enhances Metastasis by Altering RNA Metabolism

Affiliations

Resistance to Radiation Enhances Metastasis by Altering RNA Metabolism

Ayush Kumar et al. bioRxiv. .

Abstract

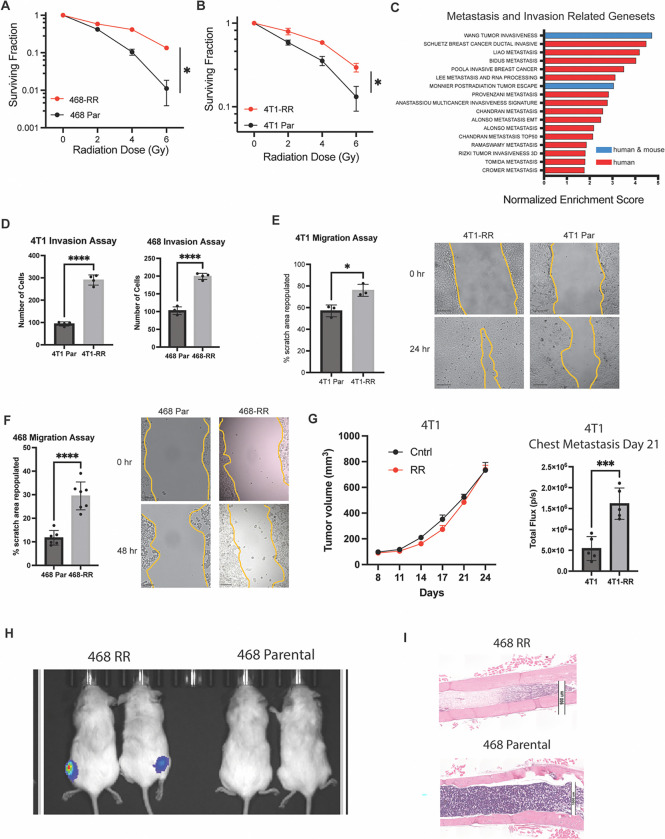
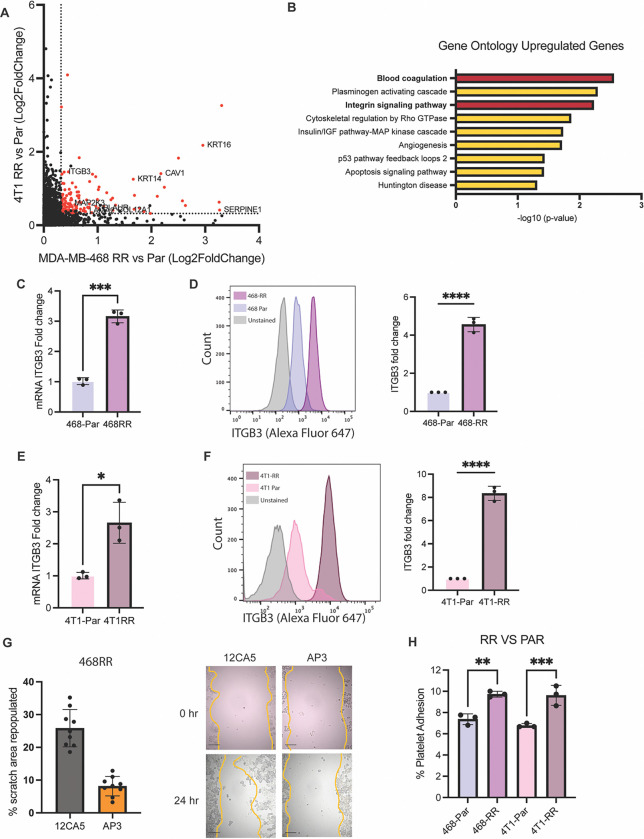
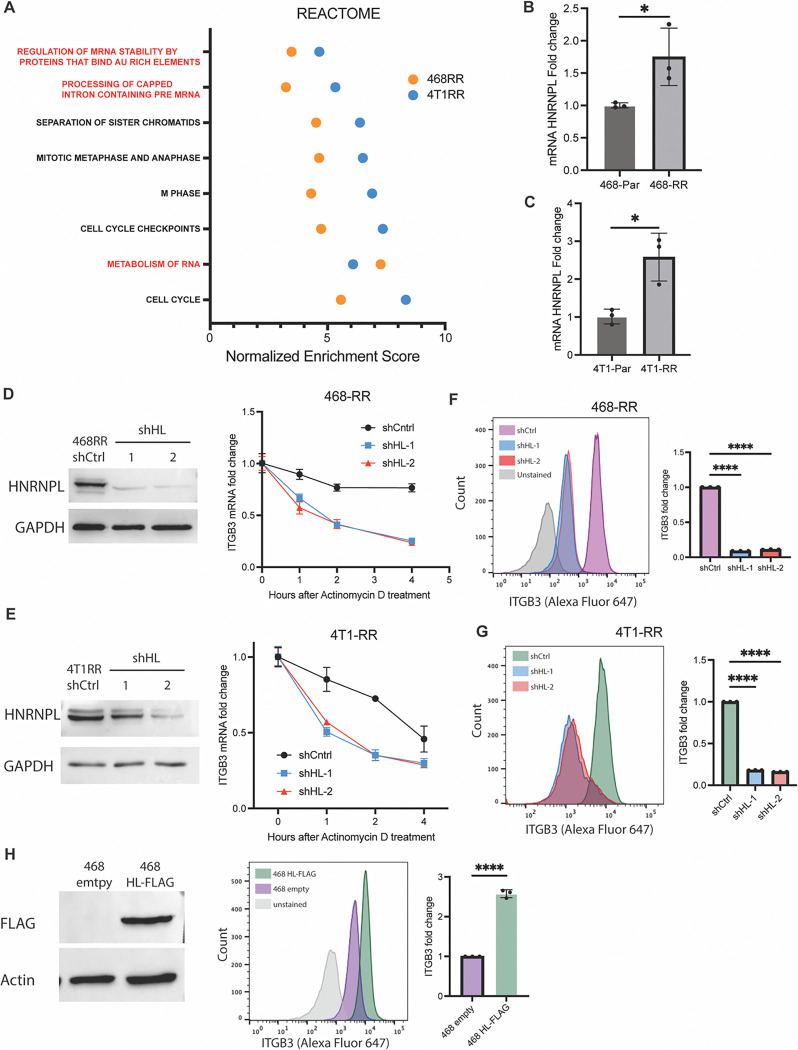
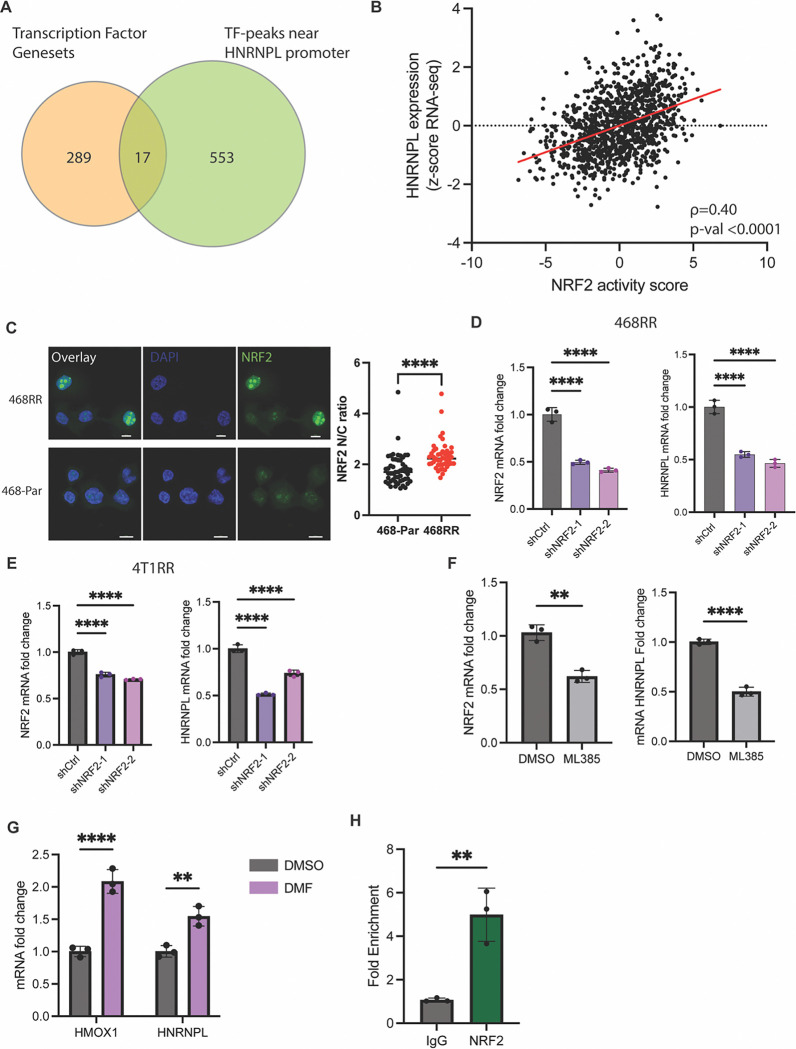
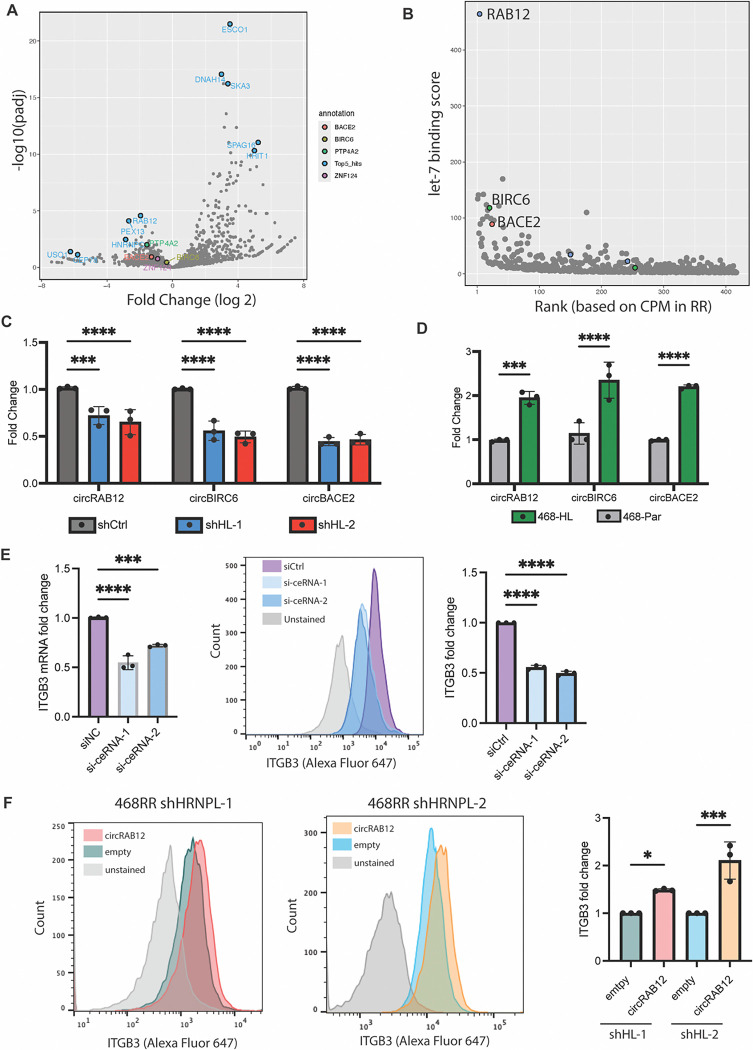
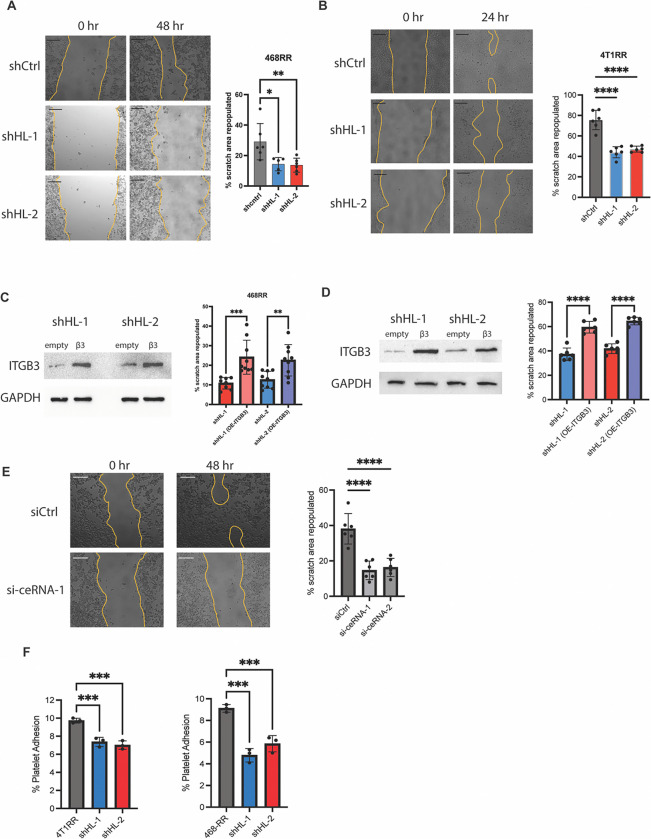
The cellular programs that mediate therapy resistance are often important drivers of metastasis, a phenomenon that needs to be understood better to improve screening and treatment options for cancer patients. Although this issue has been studied extensively for chemotherapy, less is known about a causal link between resistance to radiation therapy and metastasis. We investigated this problem in triple-negative breast cancer (TNBC) and established that radiation resistant tumor cells have enhanced metastatic capacity, especially to bone. Resistance to radiation increases the expression of integrin β3 (ITGβ3), which promotes enhanced migration and invasion. Bioinformatic analysis and subsequent experimentation revealed an enrichment of RNA metabolism pathways that stabilize ITGβ3 transcripts. Specifically, the RNA binding protein heterogenous nuclear ribonucleoprotein L (HNRNPL), whose expression is regulated by Nrf2, mediates the formation of circular RNAs (circRNAs) that function as competing endogenous RNAs (ceRNAs) for the family of let-7 microRNAs that target ITGβ3. Collectively, our findings identify a novel mechanism of radiation-induced metastasis that is driven by alterations in RNA metabolism.


Conflict of interest statement

Conflict of Interest The authors have no conflicting interests

Figures

Figure 1:
Figure 1:. Radiation resistance enhances metastasis.
A. A clonogenic assay of MDA-MB-468-RR vs MDA-MB-468 showing the surviving fraction after radiation of 0, 2, 4, and 6Gy (n=3 biological replicates, representative experiment, mean ± SD). B. A clonogenic assay of 4T1-RR vs 4T1 showing the surviving fraction after radiation of 0, 2, 4, and 6Gy (n=3 biological replicates, representative experiment, mean ± SD). C. The normalized enrichment score for genesets associated with metastasis, invasion, and migration that were upregulated in the radioresistant cell lines compared to the parental cell lines (blue is found in both human and mouse genesets whereas red is found in the human genesets). D. The number of cells that were able to invade through the Matrigel of the Transwell in the radioresistant and parental cell lines (n=4, mean± SD, student’s t-test). E. The percentage of the scratch area that was repopulated after 24 hours for the 4T1 cells (n=3, mean± SD, student’s t-test, scale bar is 200um) and F. 48 hours for the MDA-MB-468 cells (n=3, mean± SD, student’s t-test, scale bar is 200um). G. The tumor growth of the 4T1 and 4T1-RR tumors in the mammary fat pad of Balb/c mice after orthotopic injection and the total flux in the thoracic region of the mice that was seen 21 days after implantation (n=5, mean± SEM, ANOVA 2-way). H. The bioluminescent image taken 64 days after intracardiac injection of MDA-MB-468-RR and MDA-MB-468 cells (n=2, 2×10⁵ cells/injection). I. Histological images of the femur taken from the mice. The scale bar is 1000um for the upper image and 900um for the lower image.
Figure 2.
Figure 2.. Unbiased identification of integrin β3 as a driver of radiation-induced migration and invasion.
A. A graph of the differentially upregulated genes based on the Log2 fold change when comparing the radioresistant cell lines to the parental cell lines. The red dots are the 135 upregulated genes in both cell lines that meet the criteria of a FC>1.25 and FDR<0.1 B. The gene ontology analysis of the 135 shared genes identified in Fig 2A with ‘blood coagulation’ and ‘Integrin signaling pathway’ being enriched. C. The mRNA expression of ITGβ3 based on RT-qPCR (n=3, mean ± SD, unpaired t-test two-tailed) and D. the surface protein expression of ITGβ3 based on flow cytometry in the MDA-MB-468-RR and MDA-MB-468 cells (n=3, mean ± SD, unpaired t-test two-tailed). E. The mRNA expression of ITGβ3 based on RT-qPCR (n=3, mean ± SD, unpaired t-test two-tailed) and F. the surface protein expression of ITGβ3 based on flow cytometry in the 4T1-RR and 4T1 cells (n=3, mean ± SD, unpaired t-test two-tailed). G. The percentage of the scratch area that was repopulated after 48 hours for the MDA-MB-468 cell lines after treating with an integrin β3 function blocking antibody (AP3) and its appropriate control (12CA5) (n=9, mean ± SD, unpaired t-test two-tailed). The scale bar is 200um. H. The percent of platelets that were able to bind to the MDA-MB-468 and 4T1 cell lines seen in vitro. n=3, mean ± SD, and unpaired t-test two-tailed.
Figure 3.
Figure 3.. HNRNPL stabilizes ITGβ3 mRNA and regulates integrin β3 expression.
A. The gene sets from ‘REACTOME’ that were upregulated in the 4T1-RR and MDA-MB-468-RR cells with the red signifying gene sets associated with RNA metabolism. The mRNA expression of HNRNPL based on RT-qPCR in the B. MDA-MB-468 cell lines (n=3, mean ± SD, unpaired t-test two-tailed) and the C. 4T1 cell lines (n=3, mean ± SD, unpaired t-test two-tailed). D. The protein expression of HNRNPL in MDA-MB-468-RR cells and the HNRNPL-knockdown cells (shHL-1 and shHL-2) and the transcript stability assay of ITGβ3 after 0,1,2, and 4 hours of actinomycin D treatment (n=3, mean ± SD, two-way ANOVA with Tukey’s multiple comparison tests). E. The protein expression of HNRNPL in 4T1-RR cells and the HNRNPL-knockdown cells (shHL-1 and shHL-2) and the transcript stability assay of ITGβ3 after 0,1,2, and 4 hours of actinomycin D treatment (n=3, mean ± SD, two-way ANOVA with Tukey’s multiple comparison tests). F. The surface expression of ITGβ3 in the MDA-MB-468-RR cells and the HNRNPL-knockdown cells (n=3, mean ± SD, one-way ANOVA with Dunnett’s multiple comparisons tests). G. The surface expression of ITGβ3 in the 4T1-RR cells and the HNRNPL-knockdown cells (n=3, mean ± SD, one-way ANOVA with Dunnett’s multiple comparisons tests). H. The western blot expression of FLAG in the MDA-MB-468 cells transfected with empty vector and FLAG-tagged HNRNPL. The surface expression of ITGβ3 in the MDA-MB-468 empty vector and HNRNPL overexpression cells (n=3, mean ± SD, unpaired t-test two-tailed).
Figure 4.
Figure 4.. NRF2 regulates HNRNPL transcription.
A. A Venn diagram showing the transcription factor genesets that were upregulated based on GSEA of the RNA-seq comparing the radioresistant cell lines to the parental cell lines along with the transcription factors that were identified by ENCODE transcription factor ChIP-seq data to regulate HNRNPL. B. A correlation between NRF2 activity score compared to HNRNPL expression in breast cancer patient samples collected by TCGA (n=1108, Spearman correlation). C. Immunofluorescent images of the MDA-MB-468-RR and MDA-MB-468 cells with blue being the DAPI dye and green representing NRF2. Scale bar is 10um. A ratio comparing NRF2 localization in the nucleus vs the cytoplasm for the MDA-MB-468-RR (n=52) vs MDA-MB-468 cells (n=47). Data represented as mean ± SD, and statistical analysis involved one-way ANOVA with Dunnett’s multiple comparisons tests. C. The mRNA expression of NRF2 and HNRNPL for the MDA-MB-468-RR and NRF2-knockdown cells (shNRF2–1 and shNRF2–2). n=3, mean ± SD, one-way ANOVA with Dunnett’s multiple comparisons tests. D. The mRNA expression of NRF2 and HNRNPL for the 4T1-RR and NRF2-knockdown cells (shNRF2–1 and shNRF2–2). n=3, mean ± SD, one-way ANOVA with Dunnett’s multiple comparisons tests. E. The mRNA expression of NRF2 and HNRNPL for the MDA-MB-468-RR cells treated with DMSO or ML385 (5uM) for 72 hours (n=3, mean ± SD, one-way ANOVA with Dunnett’s multiple comparisons tests). F. The mRNA expression of NRF2 and HNRNPL for the MDA-MB-468 cells treated with DMSO or DMF (5uM) for 24 hours (n=3, mean ± SD, unpaired t-test two tailed). G. The fold enrichment of NRF2 binding to the HNRNPL promoter region identified by ChIP-qPCR when pulling down NRF2 vs IgG (n=3, mean ± SD, unpaired t-test two tailed).
Figure 5.
Figure 5.. HNRNPL-mediated circular RNA formation regulates ITGβ3.
A. IMCR-seq results showing the differential expression of different circular RNAs in the MDA-MB-468-RR and in the shHNRNPL-1 cells. The blue dots highlight the top 5 differentially expressed circular RNAs whereas the other labels represent other circular RNAs that can function as ceRNAs B. A graph showing the let-7 binding score for each circular RNA in comparison to its abundance (based on ranking of circular RNAs from CPM values) in MDA-MB-468-RR cells. C. mRNA expression of the top ceRNAs identified by Circr in the MDA-MB-468-RR and HNRNPL-knockdown cells (n=3, mean ± SD, one-way ANOVA with Dunnett’s multiple comparisons tests). D. mRNA expression of the top ceRNAs in MDA-MB-468 transfected with empty vector and HNRNPL (n=3, mean ± SD, unpaired t-test two-tailed). E. mRNA expression of ITGβ3 after siRNA treatment of the ceRNAs, with a representative image of the surface expression of integrin β3 and quantification based on flow cytometry (n=3, mean ± SD, unpaired t-test two-tailed). F. Representative flow cytometry data showing the surface expression of integrin β3 in the HNRNPL knockdown cells transducing with an empty plasmid or circRAB12. The graphs quantify the fold change in integrin β3 surface expression in the HNRNPL knockdown cells after transducing them with an empty plasmid or circRAB12. n=3, mean ± SD, unpaired t-test two-tailed.
Figure 6.
Figure 6.. HNRNPL-derived circular RNAs drive migration by stabilizing ITGβ3 mRNA.
A. The scratch area repopulated by MDA-MB-468-RR cells and the HNRNPL-knockdown cells after 48 hours. Scale bar is 200um. (n=6, mean ± SD, one-way ANOVA with Dunnett’s multiple comparisons tests). B. The scratch area repopulated by 4T1-RR cells and the HNRNPL-knockdown cells after 24 hours. Scale bar is 200um. (n=6, mean ± SD, one-way ANOVA with Dunnett’s multiple comparisons tests). C. The protein expression of MDA-MB-468-RR HNRNPL-knockdown cells given an empty vector or ITGβ3-GFP plasmid with the scratch area repopulated after 48 hours. (n=9, mean ± SD, unpaired t-test two-tailed) D. The protein expression of 4T1-RR HNRNPL-knockdown cells given an empty vector or ITGβ3-GFP plasmid with the scratch area repopulated after 24 hours. (n=6, mean ± SD, unpaired t-test two-tailed) E. The scratch area repopulated in 48 hours by MDA-MB-468RR cells given siCtrl, si-ceRNA-1, and si-ceRNA-2. The scale bar is 200um. (n=6, mean ± SD, one-way ANOVA with Dunnett’s multiple comparisons tests) F. The percent of platelets that were able to bind to the MDA-MB-468-RR and 4T1-RR cell lines along with their respective HNRNPL-knockdown cell lines seen in vitro. (n=3, mean ± SD, one-way ANOVA with Dunnett’s multiple comparisons tests).

Similar articles

References

    1. Yates LR, et al. Subclonal diversification of primary breast cancer revealed by multiregion sequencing. Nat Med. 2015;21(7):751–759. - PMC - PubMed
    1. Casasent AK, et al. Multiclonal Invasion in Breast Tumors Identified by Topographic Single Cell Sequencing. Cell. 2018;172(1–2):205–217.e12. - PMC - PubMed
    1. Biomechanical regulation of breast cancer metastasis and progression | Scientific Reports [Internet]. https://www.nature.com/articles/s41598-021-89288-z. Accessed November 1, 2024. - PMC - PubMed
    1. Goetz JG, et al. Biomechanical remodeling of the microenvironment by stromal Caveolin-1 favors tumor invasion and metastasis. Cell. 2011;146(1):148. - PMC - PubMed
    1. Pan M-R, et al. FAK is Required for Tumor Metastasis-Related Fluid Microenvironment in Triple-Negative Breast Cancer. J Clin Med. 2019;8(1). 10.3390/jcm8010038. - DOI - PMC - PubMed

Publication types

LinkOut - more resources