[Preprint]. 2025 Feb 27:2025.02.24.639159.
doi: 10.1101/2025.02.24.639159.

Comprehensive analysis of myeloid reporter mice

Affiliations

Comprehensive analysis of myeloid reporter mice

Yidan Wang et al. bioRxiv. .

Abstract

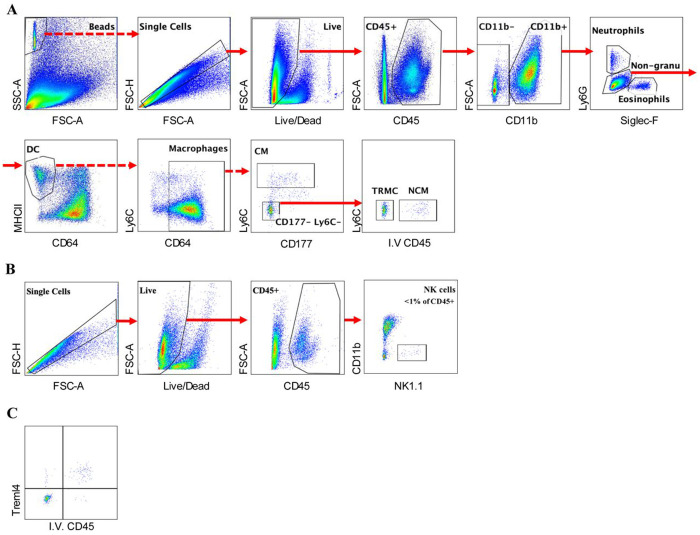
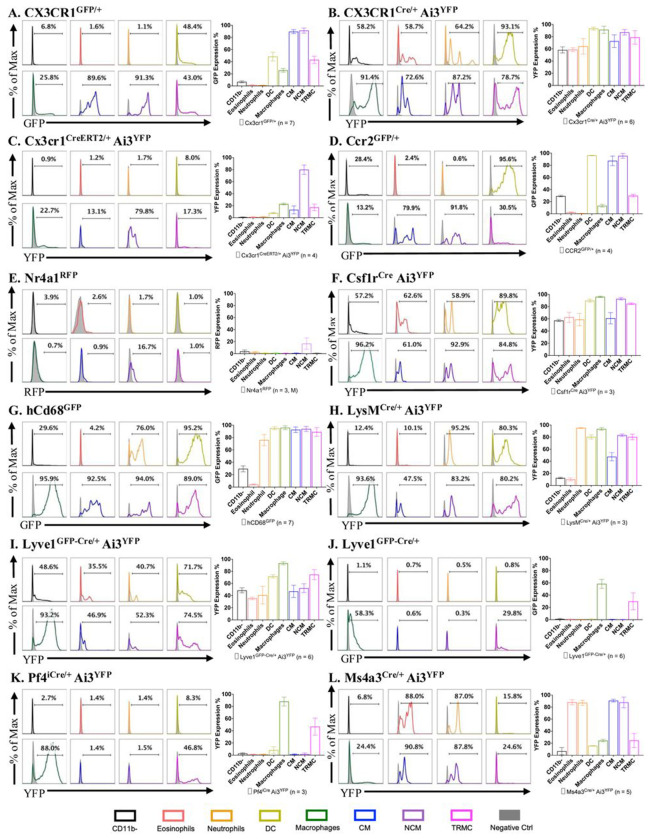
Macrophages are a pivotal cell type within the synovial lining and sub-lining of the joint, playing a crucial role in maintaining homeostasis of synovium. Although fate-mapping techniques have been employed to differentiate synovial macrophages from other synovial myeloid cells, no comprehensive study has yet been conducted within the mouse synovial macrophage compartment. In this study, we present, for the first time, lineage tracing results from 18 myeloid-specific fate-mapping models in mouse peripheral blood (PB) and synovial tissue. The identification of synovial macrophages and monocyte-lineage cells through flow cytometry was further validated using cellular indexing of transcriptomes and epitopes by sequencing (CITE-seq) datasets. These findings provide a valuable methodological tool for researchers to select appropriate models for studying the function of synovial myeloid cells and serve as a reference for investigations in other tissue types.


Figures

Figure 1.
Figure 1.. Flow cytometry gating strategy of cells in mouse synovial tissue.
(A) Mouse synovial tissue gating strategy for the identification of eosinophils, neutrophils, dendritic cells (DCs), macrophages, tissue-resident monocytes-lineage cells (TRMCs), non-classical monocytes (NCMs), and classical monocytes (CMs). (B) Natural killer (NK) cells in synovial tissue are CD11b. (C) Comparable level of staining with I.V. anti-CD45 antibody and anti-Treml4 antibody on NCM in synovial tissue. Solid arrows indicate positive gating, while dashed arrows indicate negative gating.
Figure 2.
Figure 2.. Schematic of modified fate-mapping mouse models.
The schematic of (A) Cx3cr1CreERT2/+, (B) Cx3cr1Cre/+, (C) Cx3cr1GFP/+, (D) Ccr2GFP+, (E) Nr4a1RFP, (F) Csf1rCre, (G) hCD68GFP, (H) LysMCre/+, (I) Lyve1GFP-Cre/+, (J) Pf4iCre, (K) Ms4a3Cre/+, (L) Cd163iCre/+,(M) RetnlaiCre,(N) Cd74tdTomato/+, (O) hMrp8Cre-ires/GFP, (P) Tmem119GFP/GFP, (Q) P2ry12CreERT2/+, (R) Timd4Cre/+, (S) Ai3YFP, and (T) R26YFP mouse model.
Figure 3.
Figure 3.. Quantification of reporter-gene positive cells in synovial immune population.
Histogram of a representative mouse (percent indicates mean reporter gene-positive across all mice) and bar graph (mean ± SD) summarizing frequencies of reporter gene-positive synovial cells in twelve reporter and fate-mapping models. (A) Cx3cr1GFP/+ (n= 7; C57BL/6 mice were used as negative controls). (B) Cx3cr1Cre/+Ai3YFP (n=6; C57BL/6 or Ai3YFP mice were used as negative controls). (C) Cx3cr1CreERT2/+Ai3YFP (n=4; Ai3YFP mice were used as negative controls; 50 mg/kg tamoxifen (TAM) in corn oil was administered intraperitoneally on day −2 and day −1, and tissues were collected and processed on day 0). (D) Ccr2GFP/+ (n=4; C57BL/6 mice were used as negative controls). (E) Nr4a1RFP (n=3, males; C57BL/6 mice were used as negative controls). (F) Csf1rCre Ai3YFP (n=3; Ai3YFP mice were used as negative controls). (G) hCD68GFP (n =7; TRMC was identified using I.V. CD45 in 5 of the mice, and Treml4 in 2 of the mice; C57BL/6 mice were used as negative controls). (H) LysMCre/+Ai3YFP (n=3; C57BL/6 mice were used as negative controls). (J) Lyve1GFP-Cre/+Ai3YFP (n = 6; 5 of the mice received I.V. CD45 for the identification of TRMC, in 1 mouse Treml4 was used for the identification of TRMC; Ai3YFP mice were used as negative controls), (I) Lyve1GFP-Cre/+ (n=6; C57BL/6 mice were used as negative controls). (K) Pf4iCre/+Ai3YFP (n=3; Ai3YFP mice were used as negative controls). (L) Ms4a3Cre/+Ai3YFP (n=5; C57BL/6 or Ai3YFP mice were used as negative controls). (M) Cd163Cre/+Ai3YFP (n=4; Ai3YFP mice were used as negative controls). (N) RetnlaCreAi3YFP (n=2; Ai3YFP mice were used as negative controls). (O) Cd74tdTomato/+ (n=6, 4 females, 2 males; C57BL/6 mice were used as negative controls). (P) hMrp8Cre/ires-GFPAi3YFP (n=5; Ai3YFP mice were used as negative controls). (Q) Tmem119GFP/GFP (n=4; C57BL/6 or Ai3YFP mice were used as negative controls). R) Histogram and bar graph of P2ry12CreERT2/+ Ai3YFP (n = 5; P2ry12ERCre/+Ai3YFP mouse without treatment or C57BL/6 mice were used as negative controls; 50mg/kg TAM in corn oil was administered intraperitoneally on day −2 and day −1, and tissues were collected and processed on day 0). (S) Tim4Cre/+R26YFP/+ (n=4, males; R26YFP mice were used as negative controls).
Figure 4.
Figure 4.. Quantification of reporter-gene positive cells in synovial immune population.
Histogram of a representative mouse (percent indicates mean reporter gene-positive across all mice) and bar graph (mean ± SD) summarizing frequencies of reporter gene-positive synovial cells in seven reporter and fate-mapping models. (A) Cd163Cre/+Ai3YFP (n=4; Ai3YFP mice were used as negative controls). (B) RetnlaCreAi3YFP (n=2; Ai3YFP mice were used as negative controls). (C) Cd74tdTomato/+ (n=6, 4 females, 2 males; C57BL/6 mice were used as negative controls). (D) hMrp8Cre/ires-GFPAi3YFP (n=5; Ai3YFP mice were used as negative controls). (E) Tmem119GFP/GFP (n=4; C57BL/6 or Ai3YFP mice were used as negative controls). F) Histogram and bar graph of P2ry12CreERT2/+ Ai3YFP (n = 5; P2ry12ERCre/+Ai3YFP mouse without treatment or C57BL/6 mice were used as negative controls; 50mg/kg TAM in corn oil was administered intraperitoneally on day −2 and day −1, and tissues were collected and processed on day 0). (G) Tim4Cre/+R26YFP/+ (n=4, males; R26YFP mice were used as negative controls).
Figure 5.
Figure 5.. Comparison of gene expression and fate-mapping reporters in monocyte lineage subsets in the synovium.
(A) Uniform manifold approximation and projection (UMAP) depicting eight cell populations from C57BL/6 CD45+CD11b+CD4CD8CD19NK1.1Ly6GSiglecFCD64+ and CD45+CD11b+CD4CD8CD19NK1.1Ly6GSiglecFCD64MHCII cells. (B) Heatmap of the average expression of the ADT markers of the eight cell populations identified in A. (C) Bubble plots of the average scaled gene expression of promoter genes in the CD64+ cells, classical monocytes (CM), non-classical monocytes (NCM), and TRMC defined by CITE-seq in A. (D) Heatmap of the percent of cells with detectable fluorescent protein in each fate-mapping model across macrophages, CM, NCM, and TRMC defined by flow cytometry.
Figure 6.
Figure 6.. Comparison of gene expression and fate-mapping reporters in macrophage subsets in the synovium.
(A) UMAP depicting six macrophage subsets of C57BL/6 CD45+CD11b+CD4CD8CD19NK1.1Ly6GSiglecFCD64+ cells. (B) Violin plots of the ADT expression of CX3CR1 and (C) I-A-I-E across macrophage subsets. (D) Four synovial macrophages identified by flow cytometry using CX3CR1 vs. MHCII. (E) CX3CR1 surface protein expression in synovial macrophages. (F) MHCII surface protein expression in synovial macrophages. (G) Bubble plots of the average scaled gene expression of promoter genes in the six macrophage subsets defined by CITE-seq in A. (H) Heatmap of the percent of cells with detectable fluorescent protein in each fate-mapping model across the four macrophage subsets defined by flow cytometry in D.
Figure 7.
Figure 7.. Expression of candidate gene expression markers in TRMC and synovial macrophage subsets.
(A) Violin plots for the expression of potential TRMC markers in the seven myeloid populations in the merged CD45+CD11b+CD4CD8CD19NK1.1Ly6GSiglecFCD64MHCII (CD64) and CD45+CD11b+CD4CD8CD19NK1.1Ly6GSiglecFCD64+ (CD64+) cells and in the six macrophage subsets from the CD64+ cells. (B) Violin plots for the expression of potential markers for CX3CR1+MHCII macrophage subset in the CD64+ cells and in the CD64 cells. (C) Violin plots for the expression of potential markers for CX3CR1+MHCII+ macrophage subset in the CD64+ cells and in the CD64 cells. (D) Violin plots for the expression of potential markers for CX3CR1MHCII A macrophage subset in the CD64+ cells and in the CD64 cells. (E) Violin plots for the expression of potential markers for CX3CR1MHCII B macrophage subset in the CD64+ cells and in the CD64 cells. (F) Violin plots for the expression of potential markers for CX3CR1MHCII+ A macrophage subset in the CD64+ cells and in the CD64 cells. (G) Violin plots for the expression of potential markers for CX3CR1MHCII+ B macrophage subset in the CD64+ cells and in the CD64 cells.

References

    1. Guilliams M., Mildner A. & Yona S. Developmental and Functional Heterogeneity of Monocytes. 49, 595–613 (2018). - PubMed
    1. Lazarov T., Juarez-Carreno S., Cox N. & Geissmann F. Physiology and diseases of tissue-resident macrophages. Nature 618, 698–707 (2023). 10.1038/s41586-023-06002-x - DOI - PMC - PubMed
    1. Ginhoux F. et al. Fate mapping analysis reveals that adult microglia derive from primitive macrophages. Science 330, 841–845 (2010). 10.1126/science.1194637 - DOI - PMC - PubMed
    1. Alivernini S. et al. Distinct synovial tissue macrophage subsets regulate inflammation and remission in rheumatoid arthritis. Nat Med 26, 1295–1306 (2020). 10.1038/s41591-020-0939-8 - DOI - PubMed
    1. Culemann S. et al. Locally renewing resident synovial macrophages provide a protective barrier for the joint. Nature 572, 670–675 (2019). 10.1038/s41586-019-1471-1 - DOI - PMC - PubMed

Publication types

LinkOut - more resources