[Preprint]. 2025 Feb 24:2025.02.19.639110.
doi: 10.1101/2025.02.19.639110.

Topologically Optimized Intrinsic Brain Networks

Affiliations

Topologically Optimized Intrinsic Brain Networks

Noah Lewis et al. bioRxiv. .

Abstract

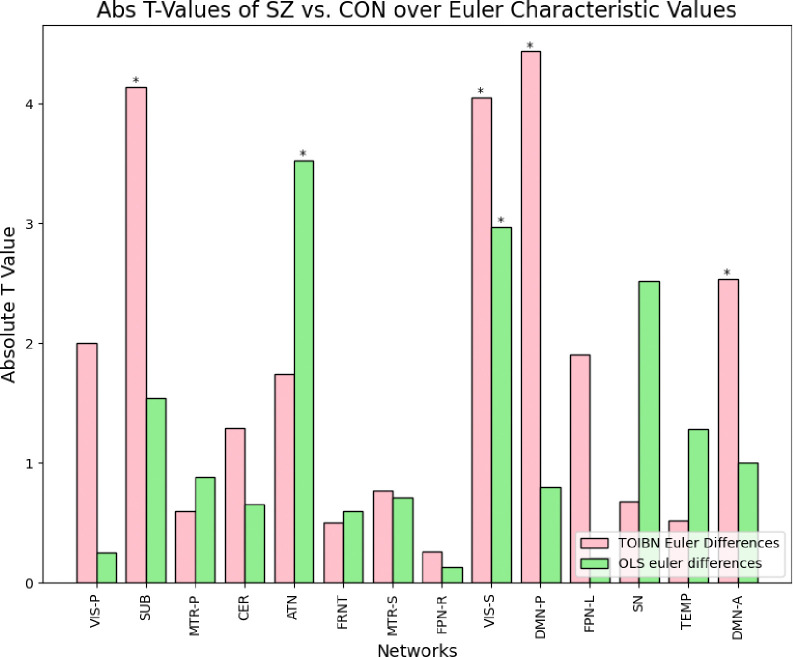
The estimation of brain networks is instrumental in quantifying and evaluating brain function. Nevertheless, achieving precise estimations of subject-level networks has proven to be a formidable task. In response to this challenge, researchers have developed group-inference frameworks that leverage robust group-level estimations as a common reference point to infer corresponding subject-level networks. Generally, existing approaches either leverage the common reference as a strict, voxel-wise spatial constraint (i.e., strong constraints at the voxel level) or impose no constraints. Here, we propose a targeted approach that harnesses the topological information of group-level networks to encode a high-level representation of spatial properties to be used as constraints, which we refer to as Topologically Optimized Intrinsic Brain Networks (TOIBN). Consequently, our method inherits the significant advantages of constraint-based approaches, such as enhancing estimation efficacy in noisy data or small sample sizes. On the other hand, our method provides a softer constraint than voxel-wise penalties, which can result in the loss of individual variation, increased susceptibility to model biases, and potentially missing important subject-specific information. Our analyses show that the subject maps from our method are less noisy and true to the group networks while promoting subject variability that can be lost from strict constraints. We also find that the topological properties resulting from the TOIBN maps are more expressive of differences between individuals with schizophrenia and controls in the default mode, subcortical, and visual networks.

Keywords: back reconstruction; fMRI; functional networks; resting state; topological data analysis; topology.


Conflict of interest statement

Remarks and Declarations We have no competing or conflicting interests in the publication of this manuscript.

Figures

Figure 1:
Figure 1:
The reference maps, thresholded to the top 30% of absolute-valued voxels, retaining only the highest-valued (red) and lowest-valued (blue) parts of the networks. The networks are defined as: primary visual (VIS-P), subcortical (SUB), primary somatomotor (MTR-P), cerebellum (CER), attention (ATN), frontal (FRNT), secondary somatomotor (MTR-S), frontoparietal-right (FPN-R), secondary visual (VIS-S), posterior default mode (DMN-P), frontoparietal-left (FPN-L), salience (SN), temporal (TEMP), and anterior DMN (DMN-A).
Figure 2:
Figure 2:
The OLS-only (left), TOIBN (middle), and reference (right) persistence diagrams from the VIS network of one subject. A persistence diagram shows the birth (x-axis) and the death (y-axis) of each homological object (e.g. a component or a hole). In this example, we see that the TOIBN persistence diagram is observably more similar to the reference image than the OLS-only diagram. This is expected, as the loss function is applied directly to these birth-death pairs.
Figure 3:
Figure 3:
a) The TOIBN primary VIS maps from six randomly selected subjects, along with the OLS-only maps (b.) from the same subjects.
Figure 4:
Figure 4:
A diagram of our methodology. We start by estimating the reference network, θG, and its associated persistence diagram, PDθG. Then, we initialize the subject network, such that θS0 is the OLS estimation. For each iteration i, we compute the subject PD, PDθSi and estimate θSi+1.θSI is the final subject estimation.
Figure 5:
Figure 5:
Top) The differences between the per-subject Euler characteristic of the TOIBN maps and the Euler characteristic of the reference image (pink) compared to the difference between the reference map and the OLS-only maps (green). The solid purple lines are the medians, and the black circles are the means. Compared to the Euler characteristics between the OLS-only and reference maps. This Euler characteristic is defined on a binarized image, where every subject is, after z-scoring, binarized at a threshold of 0. As expected, the TOIBN maps are more similar to the reference maps than the OLS-only maps. Bottom) Plots of the per-subject distance (defined as the MAE) to the reference image for all TOIBN subject maps (blue) and all OLS-only maps (red). So, not only are the maps more topologically similar to the reference maps, but they are also statistically similar. All networks marked with an asterisk are statistically significant after FDR correction.
Figure 6:
Figure 6:
Top) Histograms of the pair-wise subject spatial correlation (Pearson correlation). This figure shows that, for every network, the TOIBN maps are less correlated, implying that there is higher subject variation. Each bin is normalized as counts / (sum(counts) * diff(bins)). These correlations are how we begin to estimate the subject-specificity of the methods, by capturing the subject variability. Bottom) Plots of the per-voxel subject standard deviation (SD) for all TOIBN subject maps (blue) and all OLS-only maps (red) for voxels that are most positively relevant for the reference maps. We find these highly-correlated voxels by clustering every reference image into three clusters, then selecting the cluster with the highest value to be the correlated value, and removing the remaining voxels. From this, we see that the standard deviation over the subjects is higher for the TOIBN maps for voxels that are inside the network. This complements the correlation results, showing that there is more subject variability from the TOIBN maps, but that this variability exists inside the networks. In both figures, all networks are statistically significantly different after FDR correction.
Figure 7:
Figure 7:
Histograms of the per-subject CNRs for each network. The CNR is computed as the average of the voxels in the network minus the average of the voxels outside of the network, divided by the SD of the noise, which we define as the CSF. The voxels inside and outside of the network are defined using K-Means clustering. We cluster every image into three clusters and select the cluster with the highest value to be the network values and every voxel from the other two clusters to be the values outside of the network. We see that the CNR of the TOIBN maps is significantly (see table 4) lower than the OLS-only CNR values.
Figure 8:
Figure 8:
Group differences of the Euler characteristics between patients and controls for the TOIBN maps (pink) and OLS-only maps (green). The stars indicate which networks are significantly different between groups using FDR-corrected, unpaired, two-sample t-tests. The SUB, secondary VIS, posterior DMN, And anterior DMN networks of the TOIBN maps are significantly different between groups. Whereas only the ATN and secondary VIS are significantly different among the OLS-only maps.

References

    1. Calhoun V. D., Adali T., Pearlson G. D., Pekar J. J., A method for making group inferences from functional mri data using independent component analysis, Human brain mapping 14 (2001) 140–151. - PMC - PubMed
    1. Erhardt E. B., Rachakonda S., Bedrick E. J., Allen E. A., Adali T., Calhoun V. D., Comparison of multi-subject ica methods for analysis of fmri data, Human brain mapping 32 (2011) 2075–2095. - PMC - PubMed
    1. Iraji A., Chen J., Lewis N., Fu Z., Agcaoglu O., Kochunov P., Adhikari B. M., Mathalon D. H., Pearlson G. D., Macciardi F., et al., Spatial dynamic subspaces encode sex-specific schizophrenia disruptions in transient network overlap and its links to genetic risk, bioRxiv (2023) 2023–07. - PMC - PubMed
    1. Du Y., Fu Z., Sui J., Gao S., Xing Y., Lin D., Salman M., Abrol A., Rahaman M. A., Chen J., et al., Neuromark: An automated and adaptive ica based pipeline to identify reproducible fmri markers of brain disorders, NeuroImage: Clinical 28 (2020) 102375. - PMC - PubMed
    1. Calhoun V. D., Adalı T., Pekar J. J., A method for comparing group fmri data using independent component analysis: application to visual, motor and visuomotor tasks, Magnetic Resonance Imaging 22 (2004) 1181–1191. - PubMed

Publication types

LinkOut - more resources