[Preprint]. 2025 Feb 24:2025.02.23.639736.
doi: 10.1101/2025.02.23.639736.

Distinct prelimbic cortex ensembles encode response execution and inhibition

Affiliations

Distinct prelimbic cortex ensembles encode response execution and inhibition

Rajtarun Madangopal et al. bioRxiv. .

Update in

  • Distinct prelimbic cortex ensembles encode response execution and inhibition.
    Madangopal R, Zhao Y, Heins C, Zhou J, Liang B, Barbera G, Lam KC, Komer LE, Weber SJ, Thompson DJ, Gera Y, Pham DQ, Savell KE, Warren BL, Caprioli D, Venniro M, Bossert JM, Ramsey LA, Jedema HP, Schoenbaum G, Lin DT, Shaham Y, Pereira F, Hope BT. Madangopal R, et al. Proc Natl Acad Sci U S A. 2025 Sep 16;122(37):e2505378122. doi: 10.1073/pnas.2505378122. Epub 2025 Sep 8. Proc Natl Acad Sci U S A. 2025. PMID: 40920924

Abstract

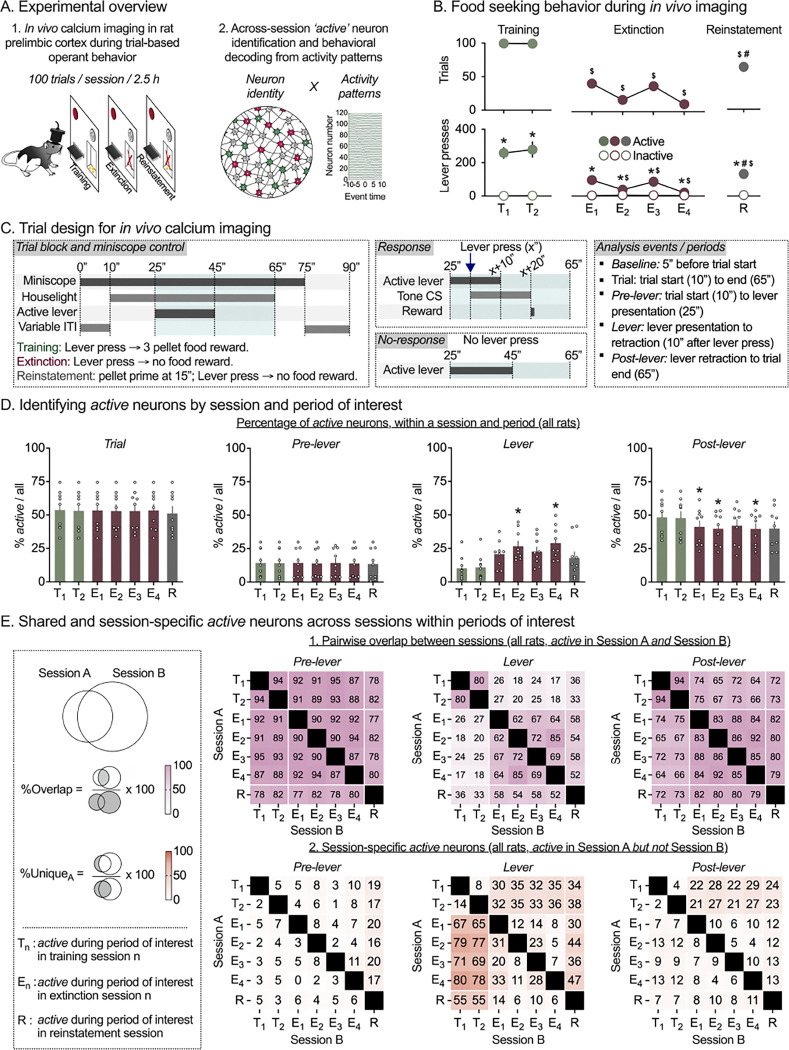
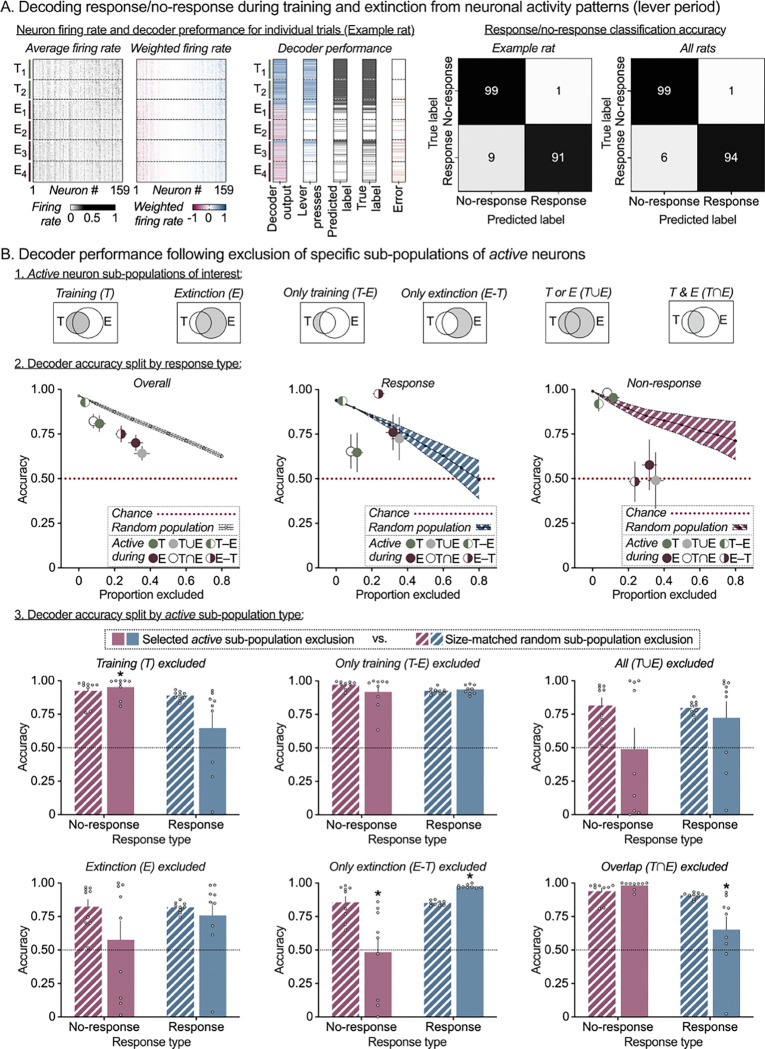
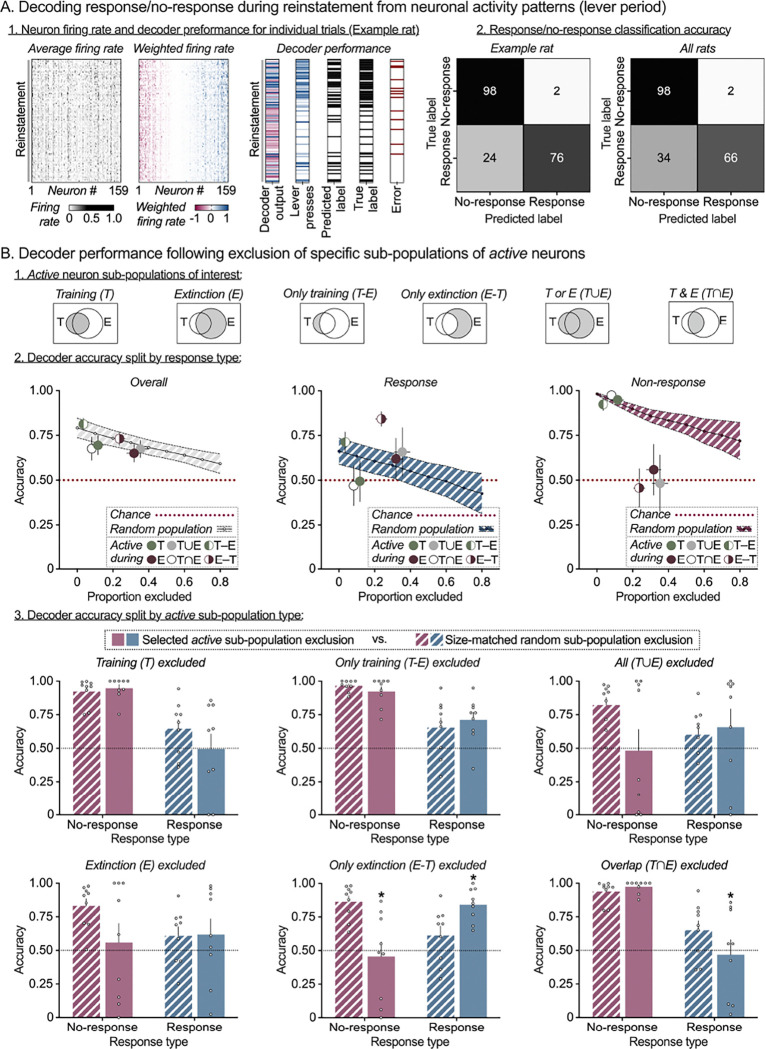
Learning when to initiate or withhold actions is essential for survival and requires integration of past experiences with new information to adapt to changing environments. While stable prelimbic cortex (PL) ensembles have been identified during reward learning, it remains unclear how they adapt when contingencies shift. Does the same ensemble adjust its activity to support behavioral suppression upon reward omission, or is a distinct ensemble recruited for this new learning? We used single-cell calcium imaging to longitudinally track PL neurons in rats across operant food reward Training, Extinction and Reinstatement, trained rat-specific decoders to predict trial-wise behavior, and implemented an in-silico deletion approach to characterize ensemble contributions to behavior. We show that operant training and extinction recruit distinct PL ensembles that encode response execution and inhibition, and that both ensembles are re-engaged and maintain their roles during Reinstatement. These findings highlight ensemble-based encoding of multiple learned associations within a region, with selective ensemble recruitment supporting behavioral flexibility under changing contingencies.


Conflict of interest statement

Competing Interests All authors declare that they do not have any conflicts of interest (financial or otherwise) related to the text of the paper.

Figures

Figure 1.
Figure 1.. In vivo calcium imaging allows longitudinal tracking of neuronal activity patterns and active neuron overlap in rat prelimbic cortex during palatable food-seeking behavior.
(A) Experimental overview. Rats were trained to self-administer palatable food pellets using a trial-based operant procedure prior to longitudinal in vivo calcium imaging during palatable food self-administration (Training (T), 2 sessions), extinction of palatable food seeking (Extinction (E), 4 sessions), and reinstatement of palatable food-seeking behavior by presentation of a priming pellet (Reinstatement (R), 1 sessions). Neuron spatial and temporal footprints were detected using imaging data concatenated across all 7 imaging sessions. (See supplementary figure S1 for detailed experimental timelines, behavioral training prior to imaging sessions, GRIN lens placements, and example imaging field of view). (B) Palatable food seeking behavior during in vivo calcium imaging sessions. Mean (± SEM) number of response trials (top row), and active and inactive lever presses (bottom row) during training (2 sessions, left panel), extinction (4 sessions, center panel) and pellet-primed reinstatement (1 session, right panel). *Significant difference (p < 0.05) between active and inactive lever presses. $Significant decrease (p < 0.05), versus training session 1 in number of response trials (top) and active lever presses (bottom). #Significant increase (p < 0.05), versus extinction session 4 in number of response trials (top) and active lever presses (bottom) during reinstatement. (C) Trial design and analyzed events. Temporal sequence of events under experimenter control (left), or dependent on rats’ behavioral response (middle, top) or no-response (middle, bottom). Description of trial periods analyzed (right). (D) Percentage of active neurons by trial period and imaging session. For each rat, spikes were estimated from calcium transients and used to calculate trial-by-trial average firing rate of individual neurons (all neurons detected across all 7 sessions) within each trial period. For each session and trial period, active neurons were identified as those with significantly different average firing rates during that period vs. baseline period at the start of the same trial in the session. Mean (± SEM) percentage of active neurons identified during the entire trial (left), pre-lever period (center left), lever availability period (center right) and post-lever period (right), for each imaging session. Clear circles represent data from individual rats (n = 9). *Significant difference (p < 0.05) in percentage of active neurons vs. Training session 1. (See supplementary Figure S2 for active neuron counts for each session and period, and supplementary Figure S3 for active neuron counts by session type.). (E) Shared and session-specific active neurons across sessions within trial periods. Percentage pairwise shared (1) and session-specific (2) active neurons were calculated for each rat, and trial period as shown in the schematic (left). Heatmaps show mean pairwise %overlap (1) and %unique (2) active neurons for pre-lever period (left), lever period (middle) and post-lever period (right), for all 7 imaging sessions. (See supplementary Figure S3 for heatmaps of %overlap and %unique neurons for pair-wise comparisons between 3 session types.)
Figure 2.
Figure 2.. Distinct prelimbic cortex activity patterns support response/no-response behavior during Training and Extinction sessions.
(A) Prelimbic cortex neuronal activity supports trial-by-trial behavioral decoding during Training and Extinction. For each rat, a binary (response/no-response) linear decoder was trained using the average firing rate vector during lever availability period, for a randomly selected subset of training and extinction trials (75/25 stratified split between training and test trials). The decoder was then tested on the holdout subset of training and extinction trials and showed high decoding accuracy for all rats. Heatmaps for one example rat showing raw firing rate of each neuron (left), firing rate multiplied by the corresponding decoder weight (center) and decoder performance (right) during the 2 training and 4 extinction sessions. Each grey pixel in the left plot represents the lever-period-average firing rate of one neuron (column) in one trial (row). Each colored pixel in the center plot represents the weighted firing rate (decoder weight × firing rate) of one neuron (column) in one trial (row). Sessions and trials are displayed in chronological order from top to bottom and neurons are sorted by weight from negative (red, left) to positive (blue, right). Decoder output column shows the sum of weighted firing rates across all neurons, which determines the decoder prediction (blue = response, red = no response). Lever press column shows number of responses by trial. Predicted label column shows binarized decoder output by trial (black tick = response predicted). True label column shows binarized response pattern by trial (black tick = response). Error column shows disagreement between predicted and true labels (red tick = error). For each rat (n = 9), an equal number of response and no-response trials were sampled to set chance accuracy (red dotted line) at 0.5. Decoder accuracy (%true label) on the holdout test set (training and extinction) split by response and shown as a confusion matrix for one example rat (left heatmap) or averaged across all rats (right heatmap, n = 9). (B) Distinct sub-sets of active Training and Extinction session neurons support response and no-response prediction accuracy. For each rat, lever period decoder accuracy was measured following exclusion of one of six combinations of Training and Extinction session-specific active neuron populations (top row). Note that the decoder was trained prior to the exclusion; the weights of excluded neurons are set to 0. Summary plots (row two, all rats) of Mean (± SEM) overall accuracy (left), response prediction accuracy (center), and no-response prediction accuracy (right) following exclusion of each active population (colored circles) vs. random population exclusion (line plot, 0–80% of all neurons per rat). Bar charts (third and fourth rows, split by population) of Mean (± SEM) response (blue) and no-response (red) prediction accuracy after exclusion of active population of interest (solid bars), versus exclusion of a random population of the same size for each rat (patterned bars). Clear circles represent data from individual rats (n = 9). *Significant difference (p < 0.05) in response or no-response prediction accuracy between specific population exclusion and size-matched random population exclusion.
Figure 3.
Figure 3.. Prelimbic cortex Training and Extinction neuron activity patterns support response/no-response behavior during pellet-primed reinstatement.
(A) Prelimbic cortex neuronal activity supports trial-by-trial behavioral decoding during Reinstatement. For each rat, the response/no-response decoder trained using training and extinction session trials was tested on the reinstatement session trials. Heatmaps for one example rat showing raw firing rate of each neuron (left), firing rate multiplied by the corresponding decoder weight (center) and decoder performance (right) during the reinstatement session. Each grey pixel in the left plot represents the lever-period-average firing rate of one neuron (column) in one trial (row). Each colored pixel in the center plot represents the weighted firing rate (decoder weight × firing rate) of one neuron (column) in one trial (row). Trials are displayed in chronological order from top to bottom, and neurons are sorted by weight from negative (red, left) to positive (blue, right). Decoder output column shows the sum of weighted firing rates across all neurons, which determines the decoder prediction (blue = response, red = no response). Lever press column shows number of responses by trial. Predicted label column shows binarized decoder output by trial (black tick = response predicted). True label column shows binarized response pattern by trial (black tick = response). Error column shows disagreement between predicted and true labels (red tick = error). For each rat (n = 9), equal number of response and no-response trials were sampled from the reinstatement session to set chance accuracy at 0.5. Decoder accuracy (%true label) on reinstatement trials split by response and shown as a confusion matrix for one example rat (left heatmap) or averaged across all rats (right heatmap, n = 9). (B) Distinct sub-sets of active Training and Extinction session neurons support response and no-response prediction during Reinstatement. For each rat, lever period decoder accuracy was measured following exclusion of one of six combinations of Training and Extinction session-specific active neuron populations (top row). Summary plots (row two, all rats) of Mean (± SEM) overall accuracy (left), response prediction accuracy (center), and no-response prediction accuracy (right) following exclusion of each active population (colored circles) vs. random population exclusion (line plot, 0–80% of all neurons per rat). Bar charts (third and fourth rows, split by population) of Mean (± SEM) response (blue) and no-response (red) prediction accuracy after exclusion of active population of interest (solid bars), versus exclusion of a random population of the same size for each rat (patterned bars). Clear circles represent data from individual rats (n = 9). *Significant difference (p < 0.05) in response or no-response prediction accuracy between specific population exclusion and size-matched random population exclusion.

References

    1. Burgos-Robles A., Bravo-Rivera H., Quirk G. J., Prelimbic and infralimbic neurons signal distinct aspects of appetitive instrumental behavior. PloS one 8, e57575 (2013). - PMC - PubMed
    1. Dalley J. W., Cardinal R. N., Robbins T. W., Prefrontal executive and cognitive functions in rodents: neural and neurochemical substrates. Neurosci Biobehav Rev 28, 771–784 (2004). - PubMed
    1. Euston D. R., Gruber A. J., McNaughton B. L., The role of medial prefrontal cortex in memory and decision making. Neuron 76, 1057–1070 (2012). - PMC - PubMed
    1. Howland J. G., Ito R., Lapish C. C., Villaruel F. R., The rodent medial prefrontal cortex and associated circuits in orchestrating adaptive behavior under variable demands. Neuroscience & Biobehavioral Reviews 135, 104569 (2022). - PMC - PubMed
    1. Kaminska B., Caballero J. P., Moorman D. E., “Chapter Three - Integration of value and action in medial prefrontal neural systems” in International Review of Neurobiology, Brockett A. T., Amarante L. M., Laubach M., Roesch M. R., Eds. (Academic Press, 2021), vol. 158, pp. 57–82. - PMC - PubMed

Publication types

LinkOut - more resources