[Preprint]. 2025 May 17:2025.02.26.640383.
doi: 10.1101/2025.02.26.640383.

Inhibitory and disinhibitory VIP IN-mediated circuits in neocortex

Affiliations

Inhibitory and disinhibitory VIP IN-mediated circuits in neocortex

Shlomo Dellal et al. bioRxiv. .

Abstract

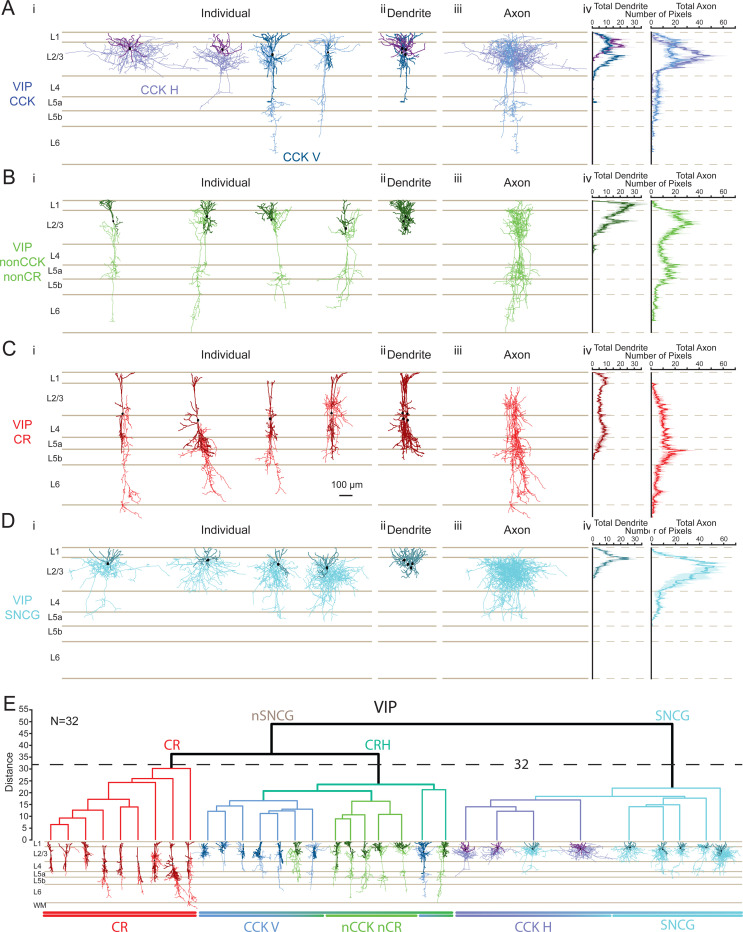
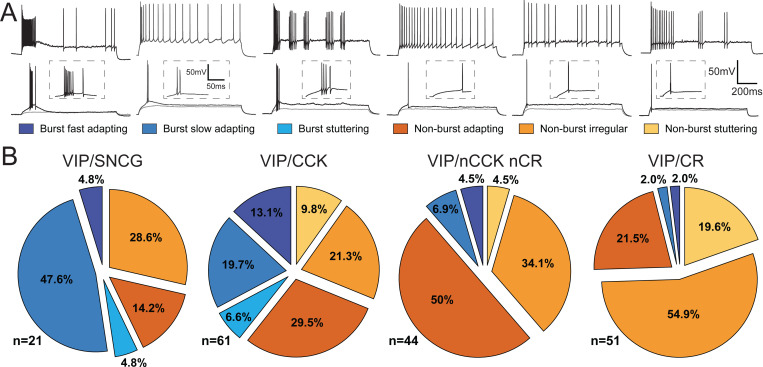
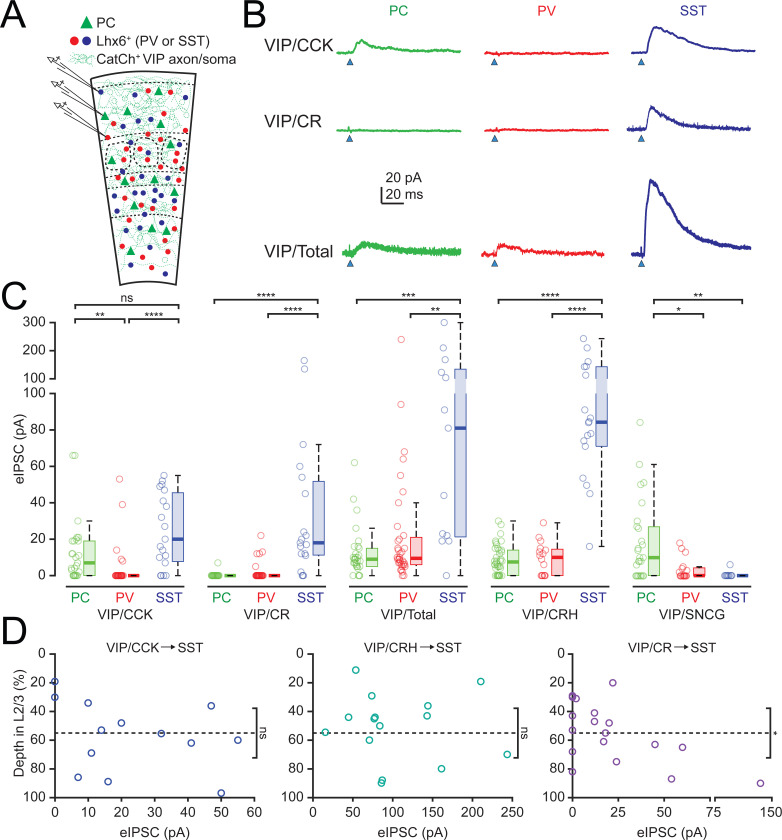
Cortical GABAergic interneurons (INs) expressing the neuropeptide vasoactive-intestinal peptide (VIP) predominantly function by inhibiting dendritic-targeting somatostatin (SST) expressing INs, thereby disinhibiting pyramidal cells (PCs) and facilitating cortical circuit plasticity. VIP INs are a molecularly heterogeneous group, but the physiological significance of this diversity is unclear at present. Here, we have characterized the functional diversity of VIP INs in the primary somatosensory cortex (vS1) using intersectional genetic approaches. We found that VIP INs are comprised of four primary populations that exhibit different laminar distributions, axonal and dendritic arbors, intrinsic electrophysiological properties, and efferent connectivity. Furthermore, we observe that these populations are differentially activated by long-range inputs, and display distinct responses to neuromodulation by endocannabinoids, acetylcholine and noradrenaline. Stimulation of VIP IN subpopulations in vivo results in differential effects on the cortical network, thus providing evidence for specialized modes of VIP IN-mediated regulation of PC activity during cortical information processing.

Keywords: GABAergic microcircuits; VIP interneurons; cortical disinhibitory circuits; endocannabinoid signaling; interneuron diversity; intersectional genetic targeting; neocortical synaptic connectivity; neuromodulatory control; optogenetic manipulation; somatosensory cortex.


Conflict of interest statement

Declaration of interests The authors declare no competing interests.

Figures

Figure 1.
Figure 1.. Resolution of distinct VIP IN populations using intersectional genetics.
(A) Schematic of the FLTG reporter. Flp activity results in tdTomato expression and Flp + Cre results in EGFP expression. (B) Image of a brain tissue section (vS1) from VIP-Flpo; CCK-Cre; CR-Cre; FLTG animals illustrates the VIP/non-CCK non-CR population (red). (C-E) Images of VIP/CCK (C), VIP/non-CCK non-CR (D) and VIP/CR (E) INs labeled using the FLTG reporter (50 μm thick sections of vS1 adult cortex). (F) Graphical representation of the proportions of each VIP subtype shown in C-E from the pia to white matter in 5% increments. Pie charts summarize the overall proportions of each subtype in L2/3 and overall (vS1), and include the inferred VIP/CCK/CR overlap. Scale bars in B-E represent 100 μm.
Figure 2.
Figure 2.. Morphological Properties of VIP IN populations.
(A) VIP/CCK-expressing neurons. (i) Complete Neurolucida reconstructions of four CCK-expressing neurons reconstructed from VIP-Flp/CCK-Cre/FLTG mice across cortical layers. CCK+ neurons were classified as CCK Horizontal (CCK H) and CCK Vertical (CCK V), with their respective dendrites (dark lavender for CCK H, dark blue for CCK V), axons (light lavender for CCK H, light blue for CCK V), and soma (black) (ii) Superimposed dendrites and somata of the four neurons. (iii) Superimposed axons of the four neurons Quantification of pixel distribution for total reconstructed dendrites (left) and axons (right) in (iv) is shown for CCK H and CCK V neurons. (B) Same as (A) for non-CCK, non-CR VIP neurons reconstructed from VIP-Flp/CCKCR-Cre/FLTG mice, with dendrites shown in dark green, axons in light green, and soma in black. (C) Same as (A) for CR-expressing neurons reconstructed from VIP-Flp/CR-Cre/FLTG mice with dendrites shown in dark red, axons shown in light red, and soma in black. (D) Same as (A) for four SNCG-expressing neurons reconstructed from VIP-Cre/SNCG-Flp mice with dendrites shown in dark cyan, axons shown in cyan, and soma in black. (E) Unbiased hierarchical clustering (Ward’s method) was performed on all reconstructed neurons (n = 32) using a comprehensive set of morphological parameters, including somatic localization, surface area, volume, number of primary dendrites, total dendritic length, mean dendritic length, dendritic surface area, dendritic volume, dendritic polarity, total axonal length, axonal surface area, axonal volume, and axonal polarity. The Gap Statistic was used to determine the optimal number of clusters, leading to the selection of a distance threshold of 32 for final group separation. The most pronounced morphological distinction was observed between VIP/SNCG-like and VIP/non SNCG neurons, followed by the separation of VIP/CR and VIP/CRH-like neuronal morphologies. Below the clustering dendrogram, each corresponding morphology is displayed for visualization.
Figure 3.
Figure 3.. Firing patterns of VIP IN populations.
(A) Firing properties of VIP INs in response to step depolarizations. Shown are the responses of representative cells to a just subthreshold, threshold, and suprathreshold current injection. Insets show a magnification of the area near the first spike for the threshold response. L2–4 VIP neurons in vS1 showed one of six distinct firing patterns: Burst fast adapting (dark blue) neurons exhibited an initial high-frequency burst of at least three action potentials riding on a calcium hump (inset), followed by rapid adaptation or complete cessation of spiking at rheobase (bottom). During suprathreshold current (top) injections, these neurons largely maintained bursting behavior, though some generated additional spikes. Burst slow adapting (medium blue) neurons fired an initial burst of at least two action potentials at rheobase (bottom; inset), followed by a gradual adaptation in firing rate over the duration of the current injection step at suprathreshold levels (top). Burst stuttering (light blue/cyan) neurons displayed an initial burst of at least three action potentials with fast and low afterhyperpolarizations (AHPs) at rheobase (bottom; inset). During suprathreshold depolarizations, these neurons exhibited intermittent bursts of action potentials with irregular interspike intervals (top). Non-burst adapting neurons (dark orange) generated a single spike at rheobase (bottom; inset) and a train of spikes during suprathreshold current injections, showing a gradual decrease in firing frequency over the course of the depolarizing step (top). Non-burst irregular neurons (medium orange) fired a single spike at rheobase (bottom; inset) and exhibited irregular spiking patterns at suprathreshold depolarization, without a clear adaptation pattern (top). Non-burst stuttering (light orange/yellow) neurons generated a single spike with fast and low AHPs at rheobase (bottom; inset) and displayed intermittent bursts of action potentials with irregular interspike intervals during suprathreshold current injections (top). (B) Electrophysiological Subtype Distribution of firing patterns in VIP IN populations. Shown is the proportion of distinct firing patterns for VIP/SNCG (n = 21), VIP/CCK (n = 61), VIP/nonCCK/nonCR (n = 44), and VIP/CR (n = 51) neurons. VIP/SNCG and VIP/CCK neurons predominantly exhibited bursting firing patterns, whereas VIP/nonCCK/nonCR neurons were more commonly associated with non-burst adapting behavior, and CR neurons displayed a higher prevalence of irregular spiking phenotypes.
Figure 4.
Figure 4.. Efferent connectivity of VIP IN populations.
(A) Schematic of the experiments to study efferent connectivity of VIP IN populations using Ai80 mice. Either PCs or EGFP+ Lhx6+ INs (PV or SST cells) in vS1 were patched to measure output from VIP INs following light stimulation of CatCh-expressing VIP IN axons. (B) Representative voltage-clamp (Vhold = −50 mV) recordings of evoked VIP IN output to PCs, PV or SST INs. An unbiased classifier (see Methods) was used to differentiate between PV and SST INs among Lhx6+ neurons. The top, middle, and bottom rows were from representative neurons in the VIP;CCK;Ai80;Lhx6-EGFP, VIP;CR;Ai80;Lhx6-EGFP, and VIP;Ai80-frt;Lhx6-EGFP mouse lines, respectively. (C) Quantification of evoked inhibitory postsynaptic currents (eIPSCs) in PCs, PV INs, and SST INs following light stimulation of VIP/CCK, VIP/CR, Total VIP, VIP/CRH and VIP/SNCG IN axons. Box-and-whisker plots the box represents the interquartile range (IQR: 25th to 75th percentile), the horizontal line within the box indicates the median, and whiskers extend to 1.5x the IQR unless outliers are present. Outliers are plotted individually as separate points. (N, respectively, for PC, PV, SST: CCK(27,30,19), CR(22,31,19), Total(30,36,13), CRH(38,16,18), SNCG(17 PC, 10 SST), Kruskal-Wallis test followed by a Dunn-Sidak post hoc test: CCK, p<0.0001, PC vs PV p=0.00371, PC vs SST p=0.32007, PV vs SST p=1.97×10⁻⁵; CR, p<0.0001, PC vs PV p=0.79165, PC vs SST p=3.42×10⁻⁸, PV vs SST p=2.74×10⁻⁷; Total, p=0.0003, PC vs PV p=0.69629, PC vs SST p=0.000203, PV vs SST p=0.002501; CRH, p<0.0001, PC vs PV p=0.99948, PC vs SST p=7.87×10⁻⁹, PV vs SST p=3.34×10⁻⁶; SNCG p= 0.0008, PC vs PV p= 0.026569, PC vs SST p= 0.001784, PV vs SST p= 0.57144). (D) Quantification of evoked inhibitory postsynaptic currents (eIPSCs) from VIP/CCK, VIP/CRH, and VIP/CR output to L2/3 SST INs by depth in L2/3, with the L1/2 and L3/4 borders being 0% and 100%, respectively. The dashed line indicates the 55% depth mark which is the cutoff for high and low VIP/CR axon density (Figure 2, and supplementary Figure 2). For VIP/CR INs the eIPSC amplitudes in SST INs below this cutoff are significantly larger on average than those above the cutoff (right panel, Two-sample t-test, p=0.0477). In contrast, SST IN eIPSC amplitudes evoked from VIP/CCK or VIP/CRH INs are not significantly different in upper or lower L2/3 (left and middle panels, Two-sample t-test, VIP/CCK p=0.1696 and VIP/CRH p=0.2967).
Figure 5.
Figure 5.. DSI of synaptic responses evoked by VIP INs in L2/3 PCs
(A) Stacked bar plots of normalized mRNA levels (CPM weighted mean, the mean of all CPM values from all transcriptomic bins for the indicated IN subtype weighted by the number of cells in each transcriptomic bin) from the Allen Institute library for cannabinoid receptor 1 (CNR1) (Allen Institute scRNAseq data;) in different VIP IN populations and PV neurons. (B) Protocol used to study depolarization-induced suppression of inhibition (DSI) (top). DSI was assessed using optogenetics in L2/3 pyramidal cells (PCs) as follows: PCs were recorded in voltage-clamp mode (Vhold = −50 mV) in cortical slices from VIP-Flpo/CRH;Ai80, VIP-Cre/SNCG-Flpo;Ai80 or VIP-Flpo/CCK-Cre;Ai80 mice, in which CatCh is expressed in the intersected VIP IN subpopulation. Control IPSCs were elicited by light pulses of 2 ms duration. Then, after a 15 s interval, the PC was depolarized (dp) to +10 mV (from −70 mV) for 1.2 s, and after a 0.5 s recovery, another IPSC was elicited by light stimulation. Averaged traces (n=3) from single cells of pre-DSI (black; top), post-DSI (red; middle), and recovery (bottom; grey) from VIP/CRH (left) and VIP/SNCG (right) Ai80 mice. (C) DSI of all cells tested with responses normalized to the pre-depolarization step. Grey, individual cells; black, average of all cells (CRH, n=5; SNCG, n=6; CCK, n=5; Wilcoxon matched-pairs signed rank test, one-tailed, post vs pre, CRH, p=0.0312, SNCG, p=.0156, CCK, p=.0312). The magnitude of DSI observed in SNCG was significantly greater than that observed in CRH (Kruskal-Wallis test, p=0.002 followed by a Dunn-Sidak post-hoc test, SNCG vs. CRH, p=0.0071, SNCG vs. CCK, p=0.0894, CRH vs. CCK, p>0.9999), (D) Summary of all cells, comparing for each cell, the effect of withholding the depolarization step (dp+ vs dp-, Wilcoxon matched-pairs signed rank test, one-tailed, SNCG, p=0.0312; Paired t-test, one-tailed, CRH, p=0.0173, CCK, p=0.0057). Cells in which no dp- protocol was run are denoted by an ‘x’.
Figure 6.
Figure 6.. Differential afferent connectivity of VIP IN populations.
(A) Schematic representation of the experimental procedure to study vM1 inputs onto L2–4 VIP INs in vS1, showing the injection of AAV-ChR2-EYFP into vM1, leading to the expression of ChR2 in vM1 axons projecting to Layer 1 and Layer 6 of vS1. (B) Differential interference contrast (DIC) (top panels) and epifluorescence images (bottom panels) of the vM1 injection site (left) and the projection/recording site in vS1 (right), illustrating the ChR2- EYFP injection site and the vM1 axons in vS1. Scale bar = 200 μm. (C) Schematic of experimental procedure. VIP/SNCG, VIP/CCK, VIP/nonCCK nonCR, or VIP/CR neurons were patched in the appropriate mouse lines and ChR2 was expressed in vM1 in order to optically stimulate vM1 projections in vS1. (D) Confocal image showing two patched VIP neurons, with a VIP/CR neuron (left, white) and a VIP/CCK neuron (right, white), both receiving vM1 input from L1-projecting axons (green top). Scale bar = 200 μm. (E) Representative voltage-clamp (left, V-clamp, Vhold = −90 mV) and current-clamp (right, I-clamp, Vhold = −70 mV) recordings from the samecells of vM1 evoked synaptic input to VIP/CCKH (cyan), VIP/CCKV (blue), VIP/nCCK nCR (green), and VIP/CR (red) neurons. (F) Quantification of vM1 evoked excitatory postsynaptic currents (eEPSCs) in different VIP IN populations (CCK H N=15, CCK V N=10, nonCCK nonCR N=11, CR N=15). Box-and-whisker plots. The box represents the interquartile range (IQR: 25th to 75th percentile), the horizontal line within the box indicates the median, and whiskers extend to 1.5x the IQR unless outliers are present. Data points which lie beyond the range of the whiskers are considered outliers. The vM1 response evoked in nCCK nCR VIP INs was significantly stronger than VIP/CCK V and VIP/CR (Kruskal-Wallis p = 0.042, Dunn-Sidak nCCK nCR vs CCK V p = 0.0166 and nCCK nCR vs CR p = 0.0191). The VIP/CCK H group received the second strongest input and was not significantly different from the rest of the groups (CCK H vs CCK V p = 0.2037, CCK H vs nCCK nCR p = 0.8228, CCK H vs CR p = 0.2682) and the least responsive groups were VIP/CCK V and VIP/CR (CCK V vs CR p = 0.9997). (G) Stacked bar plots of normalized mRNA levels (CPM weighted mean, the mean of all CPM values from all transcriptomic bins for the indicated IN subtype weighted by the number of cells in each transcriptomic bin; Allen Institute scRNAseq data;) for nicotinic cholinergic receptor α subunits (Chrna3, Chrna4, Chrna5, Chrna7) across four VIP IN populations (VIP/CCK SNCG, VIP/CCK nSNCG, VIP/nonCCK nonCR, and VIP/CR) showing that although all VIP populations express α nicotinic receptor subunits the VIP/nonCCK non CR neurons expressed the lowest levels. (H) Schematic of the cholinergic input experiment, where L2–4 VIP INs were patched in a Cholinergic/VIP mouse model (ChAT-ires-Flpo; VIP-Cre; Ai80F + Cre-dependent tdTomato virus to label all VIP INs) in Layer 2/3, and measuring cholinergic light-evoked currents in the presence of synaptic blockers (Gabazine and CNQX 10 μM; D-AP5 25 μM). Soma location, morphology, electrophysiological properties, and CR immunohistochemistry were used for VIP IN classification. (I) Post hoc immunohistochemistry in brain slices showing biocytin-filled patched neurons. The images show CR+ (top) and CR- (bottom) neurons, co-labeled with VIP (red) and Biocytin (blue). Scale bar = 10 μm. (J) Representative voltage-clamp (V-clamp) recordings of cholinergic light-evoked currents in VIP/CCK (blue), VIP/nonCCK nonCR (green), and VIP/CR (red) neurons. (K) Quantification of cholinergic input (eEPSCs) to VIP neurons (CCK, N=5, nonCCK nonCR N=6, CR N=11, Kruskal-Wallis test p=0.0127, Dunn-Sidak CCK vs nonCCK nonCR p=0.3129, CCK vs CR p>0.9999, nonCCK nonCR vs CR p=0.0147). (L) Stacked bar plots of normalized mRNA levels (CPM weighted mean as in G; Allen Institute scRNAseq data;) for α1-adrenergic receptor subunits (Adra1a, Adra1b) across the four VIP interneuron subpopulations (VIP/CCK SNCG, VIP/CCK nSNCG, VIP/nonCCK nonCR, VIP/ CR). The height of each colored segment represents the relative contribution of each subunit to the total expression. (M) Representative traces of noradrenaline (NA, 10 μM; Tocris 5169) application in the presence of glutamatergic blockers (D-AP5 25 μM; Abcam and CNQX 10 μM; Abcam), showing differential effects on a VIP/CCK, VIP/nonCCK nonCR, and a VIP/CR IN. The VIP/CR neuron exhibited a modest membrane potential depolarization, whereas the VIP/CCK and VIP/nonCCK nonCR INs both showed a strong depolarization with spiking. (N) Quantification of membrane potential change (ΔV, if cell began spiking than spiking threshold was used as the final Vm reached; cells that spiked are marked as filled in circles, otherwise they are empty) after NA application demonstrating a significantly greater NA-induced depolarization in VIP/CCK and VIP/nonCCK nonCR neurons, with many reaching spiking threshold, compared to VIP/CR neurons (CCK, N=9, nCCK nCR N=7, CR N=5, Kruskal-Wallis test p=0.0091, Dunn-Sidak CCK vs nCCK nCR p>0.9999, CCK vs CR p=0.0336, nCCK nCR vs CR p=0.0225).
Figure 7.
Figure 7.. Network effects of the activation of VIP/CR and VIP/CCK INs.
(A) Optogenetic activation of VIP/CR and VIP/CCK neurons in freely behaving mice. Combined optical fiber-electrode probes were implanted in VIP-Flpo; CR-Cre; Ai80 and VIP-Flpo; CCK-Cre; Ai80 mice to enable simultaneous stimulation and recording. (B) Peristimulus time histograms (PSTHs) of pyramidal cells and interneurons in the posterior parietal cortex (PTLp) following VIP/CR IN activation, sorted by light stimulus (n = 4 mice). (C) Average firing rate (± s.d.) peri-stimulus time histograms (PSTHs) for pyramidal cells and interneurons. The significance of the average response in each spatial bin was assessed using the Wilcoxon rank test and is shown for both groups. (D) Fraction of positive, negative, and non-significant responses (bootstrap, 1000 repetitions) following VIP/CR IN activation across groups. A higher fraction of pyramidal cells was disinhibited by VIP/CR optogenetic activation (45.2% vs. 30.0%, p = 0.005, Chi-square test). Conversely, a greater fraction of interneurons was suppressed by the same manipulation (10.3% vs. 28.3%, p < 10−5). (E-F) Same as in B-C for VIP/CCK IN activation (n = 2 mice). (G) A comparable fraction of pyramidal cells and interneurons was suppressed by VIP/CCK IN activation (7.4% and 7.8%, p = 0.95). (H) Pyramidal cells were disinhibited by optogenetic activation of VIP/CR INs (two-way ANOVA: effect of optogenetically activated cell group, F1,549 = 16.5, p < 10−4; effect of response group, F1,549= 8.2, p = 0.004; interaction between activated and response groups, F1,549 = 11.8, p < 10−3).

References

    1. Ramón y Cajal S. (1911). Histologie du système nerveux de l’homme et des vertébrés, Édition française revue et mise à jour par l’auteur, traduite de l’espagnol par L. Azoulay Edition (A. Maloine).
    1. DeFelipe J. (2002). Cortical interneurons: from Cajal to 2001. Prog Brain Res 136, 215–238. 10.1016/s0079-6123(02)36019-9. - DOI - PubMed
    1. Tremblay R., Lee S., and Rudy B. (2016). GABAergic Interneurons in the Neocortex: From Cellular Properties to Circuits. Neuron 91, 260–292. 10.1016/j.neuron.2016.06.033. - DOI - PMC - PubMed
    1. Fishell G., and Kepecs A. (2020). Interneuron Types as Attractors and Controllers. Annu Rev Neurosci 43, 1–30. 10.1146/annurev-neuro-070918-050421. - DOI - PMC - PubMed
    1. Lee S., Kruglikov I., Huang Z.J., Fishell G., and Rudy B. (2013). A disinhibitory circuit mediates motor integration in the somatosensory cortex. Nat Neurosci 16, 1662–1670. 10.1038/nn.3544. - DOI - PMC - PubMed

Publication types

LinkOut - more resources