[Preprint]. 2025 Feb 24:2025.02.20.638910.
doi: 10.1101/2025.02.20.638910.

Autophagy Suppresses CCL2 to Preserve Appetite and Prevent Lethal Cachexia

Affiliations

Autophagy Suppresses CCL2 to Preserve Appetite and Prevent Lethal Cachexia

Maria Ibrahim et al. bioRxiv. .

Abstract

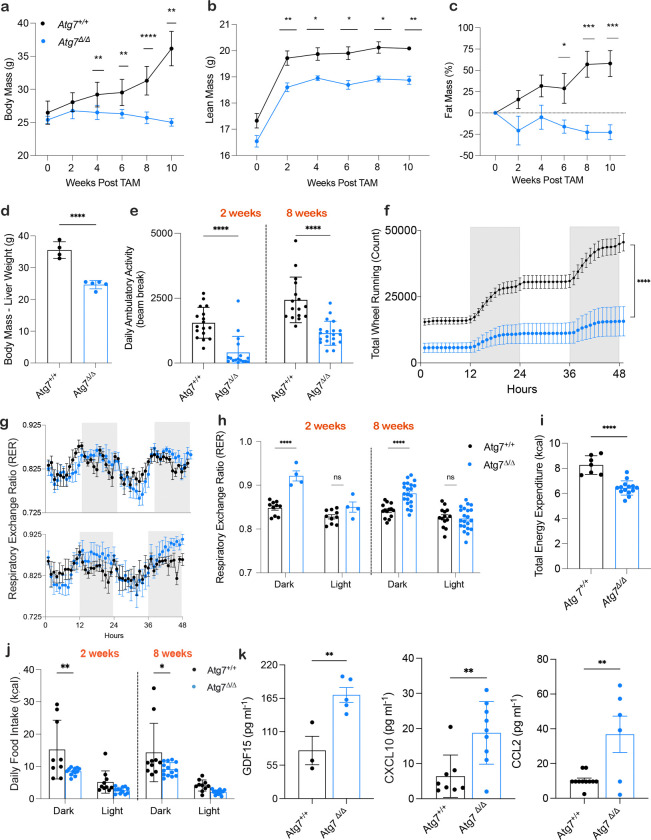
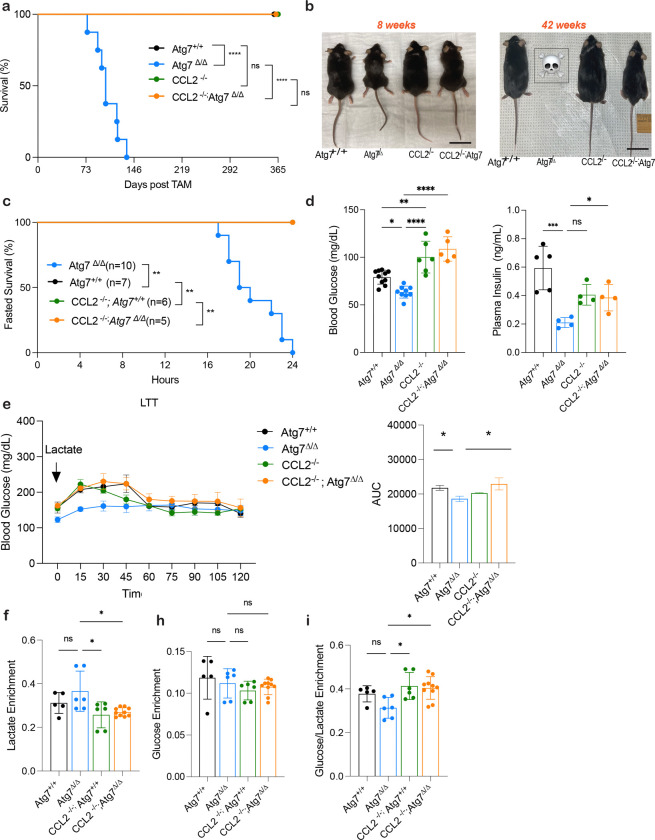
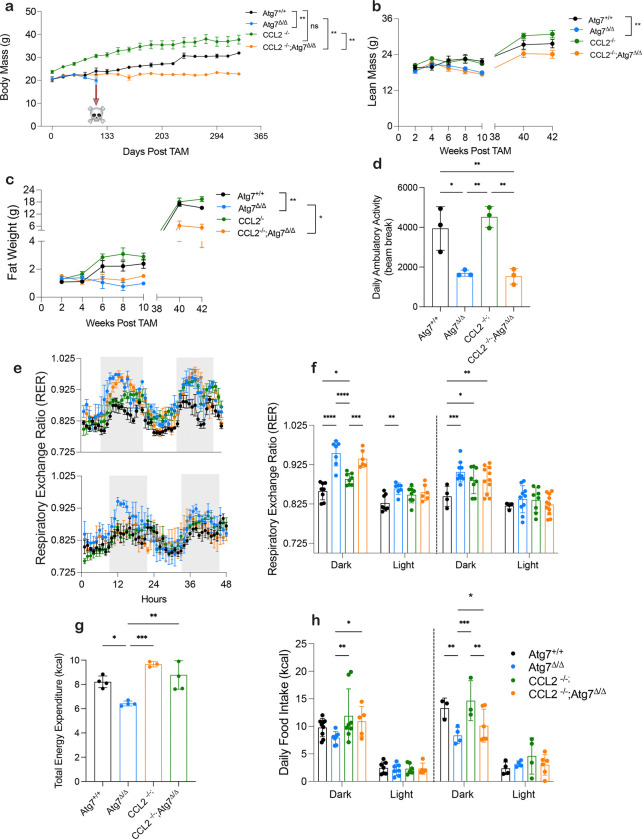
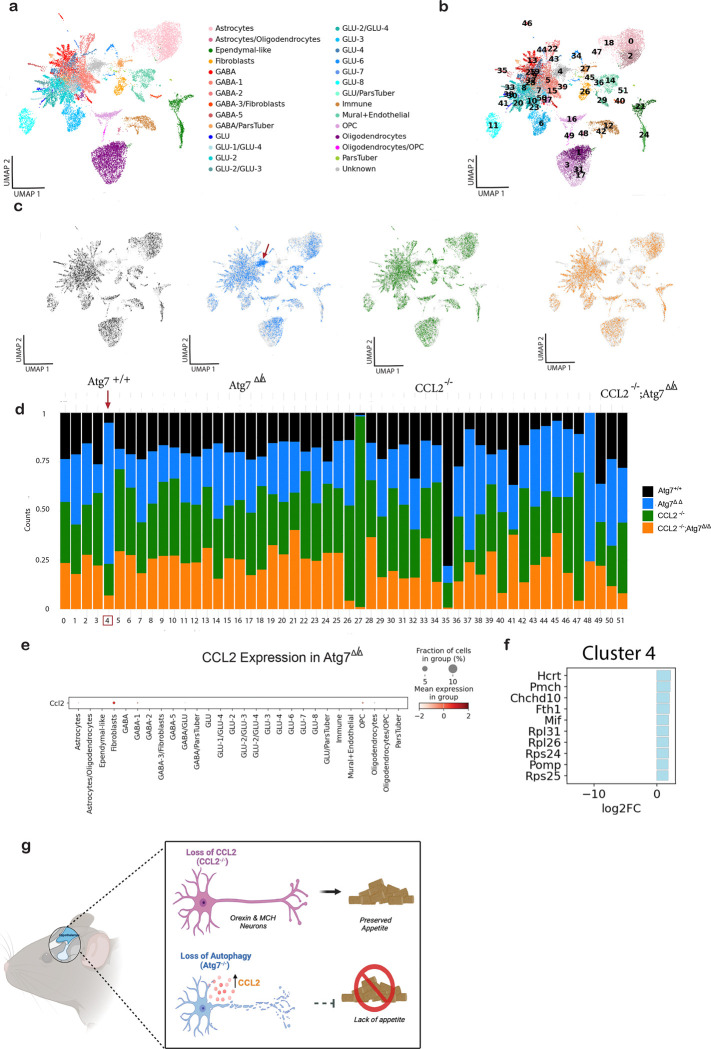
Macroautophagy (autophagy hereafter) captures intracellular components and delivers them to lysosomes for degradation and recycling1. In adult mice, autophagy sustains metabolism to prevent wasting by cachexia and to survive fasting, and also suppresses inflammation, liver steatosis, neurodegeneration, and lethality2,3. Defects in autophagy contribute to metabolic, inflammatory and degenerative diseases, however, the specific mechanisms involved were unclear 4. Here we profiled metabolism and inflammation in adult mice with conditional, whole-body deficiency in an essential autophagy gene and found that autophagy deficiency altered fuel usage, and reduced ambulatory activity, energy expenditure, and food intake, and elevated circulating GDF15, CXCL10, and CCL2. While deletion of Gdf15 or Cxcl10 provided no or mild benefit, deletion of Ccl2 restored food intake, suppressed cachexia and rescued lethality of autophagy-deficient mice. To test if appetite suppression by CCL2 was responsible for lethal cachexia we performed single nucleus RNA sequencing of the hypothalamus, the center of appetite control in the brain. Notably, we found that autophagy deficiency was specifically toxic to PMCH and HCRT neurons that produce orexigenic neuropeptides that promote food intake, which was rescued by deficiency in CCL2. Finally, the restoration of food intake via leptin deficiency prevented lethal cachexia in autophagy-deficient mice. Our findings demonstrate a novel mechanism where autophagy prevents induction of a cachexia factor, CCL2, which damages neurons that maintain appetite, the destruction of which may be central to degenerative wasting conditions.


Figures

Figure 1:
Figure 1:. Systemic metabolic impairment due to loss of autophagy causes cachexia
a, Mouse body mass post TAM injection in Atg7+/+ mice (n = 5) and Atg7Δ/Δ mice (n = 7) b,c Lean mass in grams and fat mass percentage loss post TAM injection in Atg7+/+ mice (n = 5) and Atg7Δ/Δ mice (n = 5). Body composition was measured by EchoMRI. All data are mean ± s.e.m. *P < 0.05, **P < 0.01, ***P < 0.01, ****P < 0.0001 using a two-sided Student’s t-test. d, Body mass subtracted by liver weight at 10 weeks post TAM in Atg7+/+ mice (n = 4) and Atg7Δ/Δ mice (n = 5) ej, Mice were housed in Promethion metabolic cages (n = 4–21/group). Shaded regions represent the dark cycle from 19:00 pm to 7:00 am. e, daily ambulatory activity at 2- and 8- weeks post TAM . f, total wheel running at 2 weeks post TAM. g, Hourly mean of RER at 2- and 8- weeks post TAM. h, Overall hourly means of RER at 2- and 8- weeks post TAM. i, Total energy expenditure. j, daily food intake. k, Serum (GDF15 ELISA) and cytokine and chemokine profiling (CXCL10 and CCL2) (n = 5–11/group) of Atg7+/+ and Atg7Δ/Δ mice.
Figure 2:
Figure 2:. Induction of CCL2 contributes to lethality during autophagy deficiency
a, Kaplan-Meier survival curve of Atg7+/+, Atg7Δ/Δ, Ccl2−/−, and Ccl2−/−;Atg7Δ/Δ mice. b, Representative images of Atg7+/+, Atg7Δ/Δ, Ccl2−/−, and Ccl2−/−;Atg7Δ/Δ mice at 8- and 42- weeks post TAM injection. c, Kaplan-Meier 24 hours fasting survival curve of Atg7+/+, Atg7Δ/Δ, Ccl2−/−, and Ccl2−/−;Atg7Δ/Δ mice 10 days post–TAM. d, Blood glucose and plasma insulin measurements collected at 16-hour post fast. e, Blood glucose following an intraperitoneal lactate tolerance test. Area under curve calculated from individual blood glucose traces. (*) P < 0.05; (***) P < 0.001; (****) P < 0.0001; (n.s.) not significant (unpaired t-test). f-i, Statistical analysis of the main altered metabolites enrichment in plasma of Atg7+/+, Atg7Δ/Δ, Ccl2−/−, and Ccl2−/−;Atg7Δ/Δ mice after in vivo 13C lactate tracing at 2 weeks post deletion. f, Lactate enrichment h, glucose enrichment i, ratio glucose/lactate enrichment. For all graphs the P values were determined using one-way ANOVA. P values are indicated as ≤0.05*, ≤0.01**, ≤0.001***, and ≤0.0001****.
Figure 3:
Figure 3:. Metabolic Phenotyping shows Loss of CCL2 impacts body composition and food intake.
a, Mouse body weight post TAM injection in Atg7+/+, Atg7Δ/Δ mice, Ccl2−/− mice, and Ccl2−/−;Atg7Δ/Δ mice over 365 days. b,c Lean mass and fat mass over 42 weeks post TAM injection in Atg7+/+, Atg7Δ/Δ mice, Ccl2−/− mice, and Ccl2−/−;Atg7Δ/Δ. Body composition was measured by EchoMRI. All data are mean ± s.e.m. *P < 0.05, **P < 0.01, ***P < 0.01, ****P < 0.0001 using a two-sided Student’s t-test. d–h, Mice were housed in Promethion metabolic cages (n = 4–11/group). Shaded regions represent the dark cycle from 19:00 pm to 7:00 am. d, daily ambulatory activity at 2 weeks post TAM. e, Hourly mean of RER at 2- and 8- weeks post TAM. f, Overall hourly means of RER at 2- and 8- weeks post TAM. g, Total energy expenditure. h, daily food intake.
Figure 4:
Figure 4:. Diversity and proportion of cell types in the scRNA-seq of the hypothalamus from wild-type and Ccl2−/− mice with and without deletion of Atg7.
a, Uniform Manifold Approximation and Projection (UMAP) of the snRNA-seq data with cell type annotations for Atg7Δ/Δ, Ccl2−/−, and Ccl2−/−;Atg7Δ/Δ mice at the 8-wk time point. b, UMAP showing 52 clusters that were used to annotate cell types. c, UMAP showing the cells separately for Atg7Δ/Δ, Ccl2−/−, and Ccl2−/−;Atg7Δ/Δ mice. d, Bar plot depicting the cluster composition across the different samples. e, Expression of CCL2 across cell types in Atg7Δ/Δ mice. f, Top 10 upregulated genes in Cluster 4. g, Schematic of snRNA-seq results due to loss of CCL2.
Figure 5:
Figure 5:. ob/ob rescues lethality and weight loss induced by autophagy deficiency.
a, Kaplan-Meier survival curve of Atg7+/+, Atg7Δ/Δ , ob/ob, and ob/ob;Atg7Δ/Δ mice. b, Representative images of Atg7+/+, Atg7Δ/Δ mice, ob/ob mice, and ob/ob; Atg7Δ/Δ mice at 8- and 42-weeks post TAM injection. c, Mouse body weight post TAM injection in Atg7+/+, Atg7Δ/Δ mice, ob/ob mice, and ob/ob; Atg7Δ/Δ mice. d-e, Fat mass and lean mass loss post TAM injection in mice. Body composition was measured by EchoMRI. All data are mean ± s.e.m. *P < 0.05, **P < 0.01, ***P < 0.01, ****P < 0.0001 using a two-sided Student’s t-test. f, Serum CCL2 ELISA. g, Kaplan-Meier 24 hours fasting survival curve of Atg7+/+, Atg7Δ/Δ, ob/ob, and ob/ob;Atg7Δ/Δ mice 10 days post–TAM. Blood glucose collected at 16-hour post fast. h, daily food intake. k, Proposed graphical summary of lethality in autophagy deficient mice.

References

    1. Komatsu M. et al. Impairment of starvation-induced and constitutive autophagy in Atg7-deficient mice. J Cell Biol 169, 425–434 (2005). 10.1083/jcb.200412022 - DOI - PMC - PubMed
    1. Karsli-Uzunbas G. et al. Autophagy is required for glucose homeostasis and lung tumor maintenance. Cancer Discov 4, 914–927 (2014). 10.1158/2159-8290.CD-14-0363 - DOI - PMC - PubMed
    1. Yang Y. et al. Autophagy promotes mammalian survival by suppressing oxidative stress and p53. Genes Dev 34, 688–700 (2020). 10.1101/gad.335570.119 - DOI - PMC - PubMed
    1. Rabinowitz J. D. & White E. Autophagy and metabolism. Science 330, 1344–1348 (2010). 10.1126/science.1193497 - DOI - PMC - PubMed
    1. Mizushima N. & Komatsu M. Autophagy: renovation of cells and tissues. Cell 147, 728–741 (2011). 10.1016/j.cell.2011.10.026 - DOI - PubMed

Publication types

LinkOut - more resources