[Preprint]. 2025 Feb 27:2025.02.23.639515.
doi: 10.1101/2025.02.23.639515.

Human memory CD4+ T-cells recognize Mycobacterium tuberculosis-infected macrophages amid broader pathogen-specific responses

Affiliations

Human memory CD4+ T-cells recognize Mycobacterium tuberculosis-infected macrophages amid broader pathogen-specific responses

Volodymyr Stetsenko et al. bioRxiv. .

Update in

Abstract

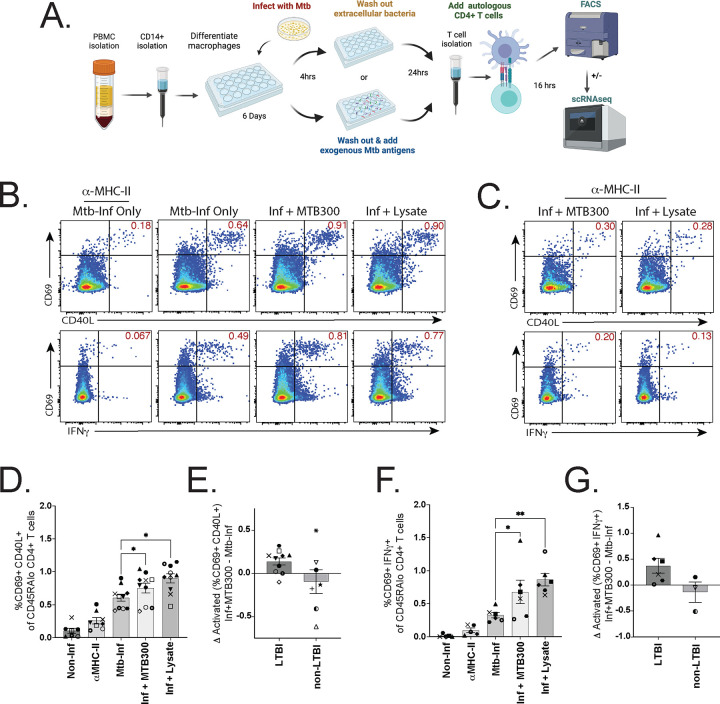
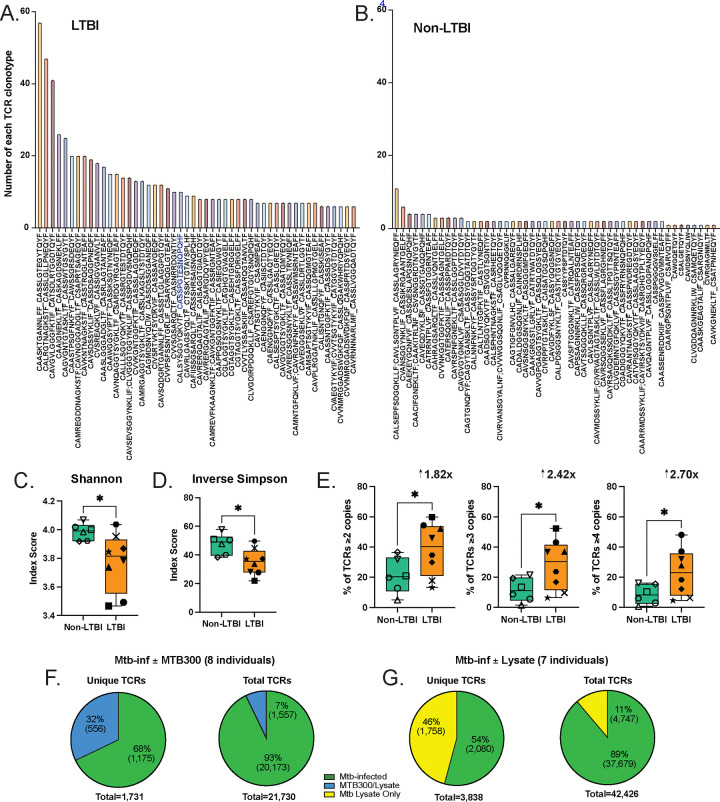
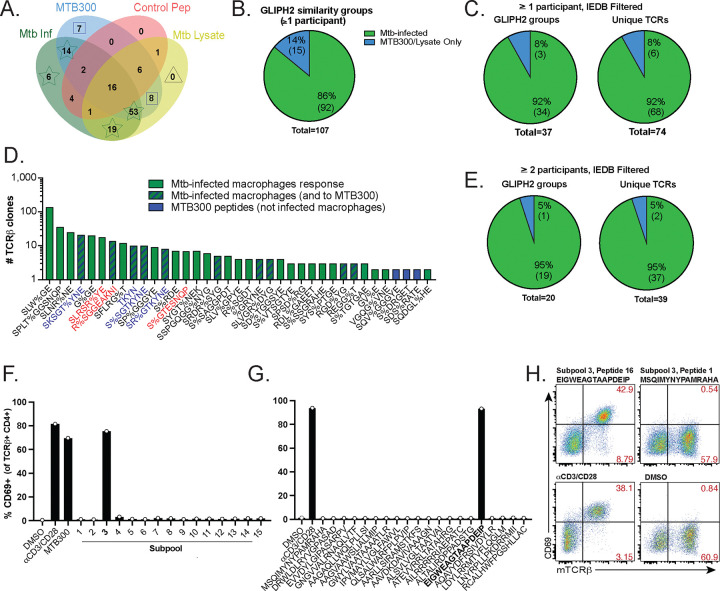
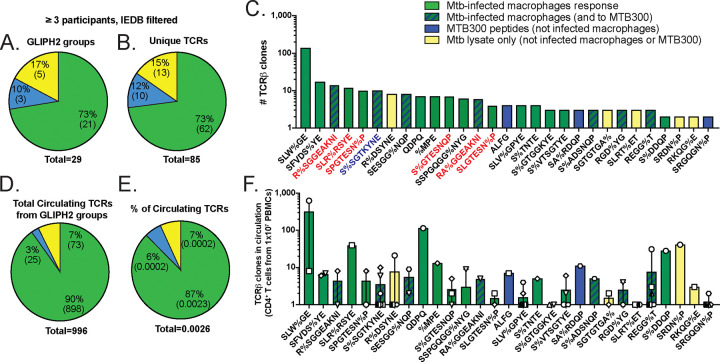
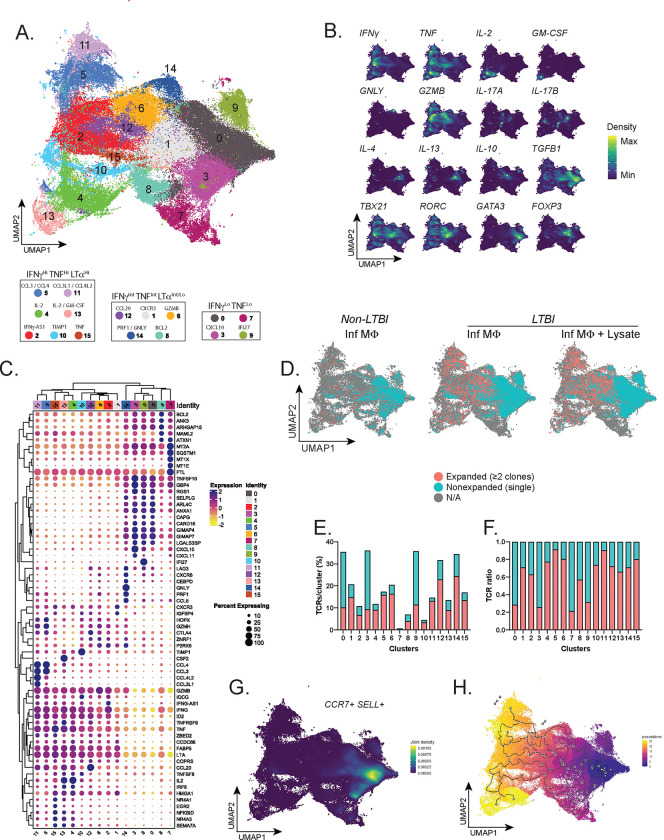
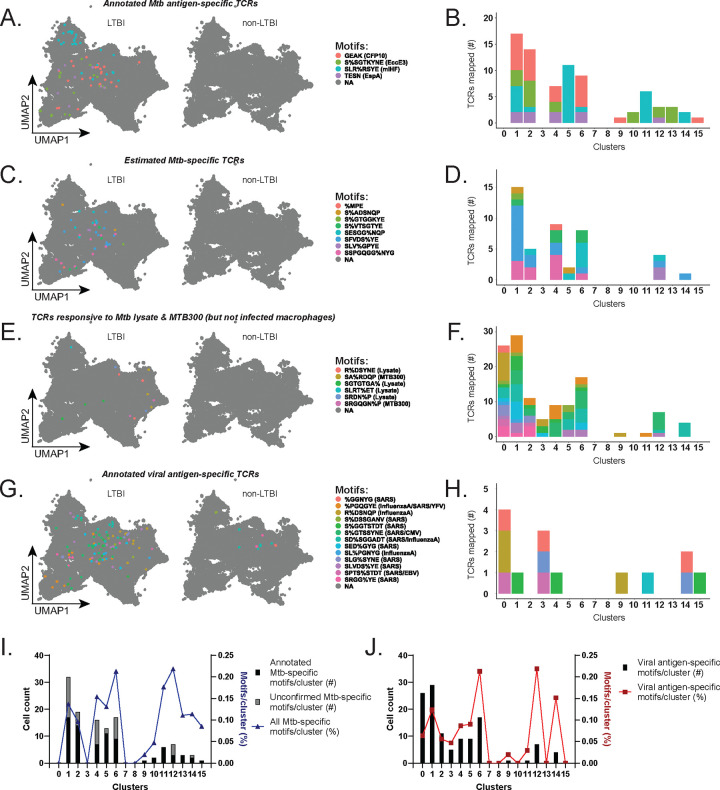
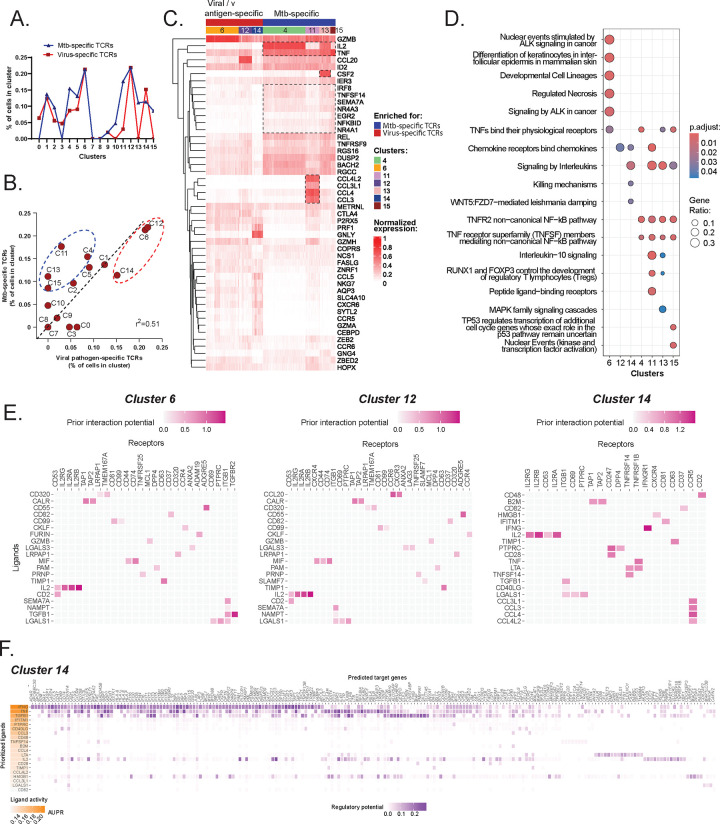
Recognition of macrophages infected with Mycobacterium tuberculosis (Mtb) is essential for CD4+ T cells to prevent tuberculosis (TB). Yet not all antigen-specific T cells recognize infected macrophages in human and murine models. Using monocyte-derived macrophages (MDMs) and autologous memory CD4+ T cells from individuals with latent Mtb infection (LTBI), we quantify T cell activation in response to infected macrophages. T cell antigen receptor (TCR) sequencing revealed >70% of unique and >90% of total Mtb-specific TCR clonotypes in stable LTBI are linked to recognition of infected macrophages, while a subset required exogenous antigen exposure, suggesting incomplete recognition. Clonotypes specific for multiple Mtb antigens and other pathogens were identified, indicating Mtb-specific and non-specific activation. Single-cell transcriptomics demonstrates Mtb-specific T cells express signature effector functions dominated by IFNγ, TNF, IL-2, and GM-CSF or chemokine production and signaling. We propose TB vaccines that elicit T cells capable of recognizing infected macrophages and expressing these canonical effector functions will offer protection against TB.

Keywords: GM-CSF; Mycobacterium tuberculosis; TB; TCR; bystander activation; human; infected macrophage; memory CD4 T cell; recognition.


Figures

Figure 1.
Figure 1.. A subset of memory CD4+ T cells lack recognition for Mtb-infected macrophages.
(A) Schematic of experimental workflow to co-culture infected macrophages with autologous memory CD4+ T cells for flow cytometry or sorting. Created in BioRender. Carpenter, S. (2025). (B) Representative flow plots comparing activation marker co-expression of CD69 with CD40L (top row) or IFNγ (bottom row), gated on CD45RALo CD4+ T cells after 16–18 h co-culture with Mtb infected macrophages ± treatment with MTB300 or lysate, and (C) in the presence of α-MHC-II blocking antibodies. Data are representative of 10 (CD69 vs CD40L) and 6 (CD69 vs IFNγ) experiments and participants. (D) Summary bar graphs compare mean (± SEM) co-expression of CD69 and CD40L, and (E) the difference in activation when MTB300 is added to infected macrophages (10 LTBI and 7 non-LTBI). (F) Summary bar graphs compare mean (± SEM) CD69 and IFNγ co-expression, and (G) change in activation when MTB300 is added (6 LTBI and 3 non-LTBI). Each symbol represents the mean of 1–3 replicates from independent experiments. Statistical significance was determined by Wilcoxon matched pairs signed rank test. * p < 0.05, ** p < 0.01. See also Supplemental Figure 1.
Figure 2.
Figure 2.. scTCRseq identifies clonotypes linked to recognition of infected macrophages.
(A) Bar graphs of the top 50 TCR clonotypes and their frequencies from representatives of 8 LTBI and (B) 6 non-LTBI participants. Clonotypes are displayed as CDR3α_CDR3β sequences; some TCRs contained two CDR3α or β chains. Blue font highlights a CDR3β motif previously annotated as specific for EspA301–315. (C) Summary box plots of the average Shannon and (D) Inverse Simpson diversity index scores of 8 LTBI and 6 non-LTBI participants. Each symbol represents individual participant TCR repertoires. (E) Summary box plots of %TCR clonotypes present in ≥ 2, 3, or 4 copies with fold-differences listed above each graph. Statistical significance was determined by unpaired t test with Welch’s correction. (F) Pie charts combining TCRs from 7–8 participants, each, showing percent (and number) of unique TCRβ sequences linked to memory CD4+ T cell activation in response to infected macrophages (green) or after adding MTB300 (blue), or (G) lysate (yellow). Plots include all unique TCR clonotypes that meet each expansion threshold (≥2, 3, or 4 copies). (H) Pie charts for percent (and number) of total TCRs for each are also plotted. * p < 0.05. See also Supplemental Figure 2.
Figure 3.
Figure 3.. GLIPH2 refines estimates of Mtb-specific CD4+ T cell recognition of infected macrophages.
(A) Venn diagram indicating the number of GLIPH2 groups containing TCRs linked to responses to infected macrophages (green, stars), MTB300 (blue, squares), Control peptide megapools (red), or lysate (yellow, triangle). Data were generated from a combined list of TCRs from all experimental conditions (10 experiments; 10 LTBI and 6 non-LTBI participants). (B) Pie charts of percent (and number) of remaining GLIPH2 groups that respond to infected macrophages (green; sum of star groups from A) or MTB300 only (blue; sum of square groups from A). (C) Pie charts of GLIPH2 groups (left) and corresponding unique TCRβs (right) after removing GLIPH2 groups containing TCRs linked to viral antigen responses. (D) Bar graph of GLIPH2 groups (x-axis) estimated to be Mtb-specific, rank-ordered by sum of highest number of TCR copies per condition (y-axis). Responses to infected macrophages (green), MTB300 only (blue), or both (blue stripes) are indicated. (E) Pie charts comparing responses to infected macrophages (green) or MTB300 peptides only (blue) for GLIPH2 groups (left) containing unique TCRβs (right) from at least 2 participants. (F) Bar graphs of CD69 expression of ‘TKYN’ TCR-transduced SKW-3 cells by flow cytometry (gated on CD4+ TCRβ+ Live-DeadLo) 18 h after co-culture with APCs loaded with MTB300 megapool, 15 subpools (20 peptides each), or (G) individual peptides from subpool #3 from 2 independent experiments. (H) Representative flow plots of CD69 and TCRβ expression gated on total CD4+ SKW-3 cells after TCR transduction in response to cognate peptide (top left), irrelevant peptide (top right) and controls. See also Supplemental Figure 3.
Figure 4.
Figure 4.. TCRs from additional LTBI cohorts enhance the ability of GLIPH2 to distinguish Mtb-specific TCR clonotypes.
(A) Pie charts comparing percent (and number) of GLIPH2 groups or (B) unique TCRβs (right) linked to a response to Mtb-infected macrophages (green), MTB300 only (blue), or lysate only (yellow) from ≥ 3 participants in the combined TCR dataset. (C) Bar graph of GLIPH2 groups estimated to be Mtb-specific (x-axis) from ≥ 3 participants, rank-ordered by sum of highest number of TCR copies per condition (y-axis). Responses to infected macrophages (green), MTB300 only (blue), both (blue stripes), or lysate only (yellow) are indicated. GLIPH2 groups containing TCRs annotated as Mtb antigen-specific in IEDB, or from our peptide screen, are in red and blue font, respectively. (D) Pie charts comparing total or (E) percent of total circulating TCRβs for CD4+ T cells from 10×106 unstimulated PBMCs after cross-referencing CDR3β sequences from Cleveland participants from GLIPH2 groups. Each dot represents TCRβ count from a separate participant. (F) Bar graph of mean circulating frequency of Cleveland participants’ TCRβ clonotypes (symbols) for each GLIPH2 group after cross-referencing with unstimulated PBMCs. (G) Bar graphs of mean CDR3β (top) and CDR3α (bottom) lengths of TCRs from Cleveland participants within GLIPH2 groups from the combined dataset. (H) Sequence logo plots show the probability of each amino acid for CDR3β (top) and CDR3α (bottom) motifs of six GLIPH2 groups common in the initial and combined analyses, created using WebLogo3. The number of CDR3 sequences used for each plot is indicated (top-right). See also Supplemental Figure 3.
Figure 5.
Figure 5.. Single-cell transcriptomics reveals distinct phenotypic clusters of memory CD4+ T cell responses to Mtb-infected macrophages.
(A) UMAP visualization plot including Louvain clustering of 157,462 cells, flow-sorted based on expression of CD4 and AIMs, from 7 LTBI participants (12 samples, including memory CD4+ T cells in co-culture with Mtb-infected macrophages ± lysate) and 6 non-LTBI participants (6 samples, memory CD4+ T cells in co-culture with Mtb-infected macrophages) after integration and QC. (B) Kernel density estimation of gene transcripts for T helper subset genes projected onto UMAP plot. Density metrics values were reduced to max/min scale. (C) Heatmap with hierarchical clustering showing top 5 DEGs (left) for each cluster (top and bottom), conserved across treatment groups. (D) Split UMAP plots for experimental groups showing mapping of all TCRs. Expanded (≥2 copies) and non-expanded (single) TCR clonotypes are shown in red and blue, respectively. (E) Representative stacked bar plots showing percent clonally expanded versus non-expanded TCRs in LTBI participant samples, normalized to each cluster’s total cell number and (F) total number of TCRs. (G) UMAP plot showing joint density estimation for plot for CCR7 and SELL transcripts in the integrated dataset. (H) UMAP plot illustrating the single-cell trajectory and pseudotime analysis of CD4+ populations within the integrated dataset. Cell fates (gray circles), transition states (black circles), proximity to (purple), and remoteness from (yellow) the root are indicated. See also Supplemental Figure 4.
Figure 6.
Figure 6.. CDR3 mapping distinguishes effector functions of Mtb-specific TCR clonotypes that recognize infected macrophages.
(A) UMAP plot with split view (based on LTBI status) with mapping of TCRs from listed GLIPH2 global motifs and (B) stacked bar plots showing their numbers per cluster for previously annotated Mtb antigen-specific TCRs. (C) UMAP plots with mapping of TCRs estimated to be Mtb-specific from listed GLIPH2 groups and (D) stacked bar plots showing their numbers per cluster. (E) UMAP plots with mapping of TCRs responsive to MTB300 or lysate stimulation, but not infected macrophages, from listed GLIPH2 groups and (F) stacked bar plots showing their numbers per cluster. (G) UMAP plots with mapping of annotated viral antigen-specific TCRs from listed GLIPH2 groups and (H) stacked bar plots showing their numbers per cluster. (I) Total copy numbers (left axis) and percentage (right axis) of cells per cluster mapping TCRs ([clone count / total cells per cluster] × 100) from known or estimated Mtb-specific GLIPH2 groups that recognized infected macrophages and (J) for annotated viral antigen-specific TCRs. See also Supplemental Figure 5.
Figure 7.
Figure 7.. Mtb-specific CD4+ T cells feature two signature gene sets in response to infected macrophages.
(A) Overlaid line graph and (B) correlation plot of percent T cells per cluster that mapped TCRs estimated to be Mtb-specific (blue) and viral antigen-specific (red). Linear regression (black dashed line) correlation was estimated using Pearson correlation coefficient squared (r2). Red and blue dashed circles identify UMAP clusters with highest enrichment of TCRs estimated to be Mtb or viral antigen-specific, respectively. (C) Heatmap showing top 10 DEGs normalized to the individual maximum expression for clusters 4, 6, 12, 14, 11,13, and 15. Gene expression patterns common to cluster enriched for Mtb-specific TCRs (4,11, 13, and 15) are outlined. (D) Dot plot showing Reactome pathway overrepresentation analysis using the lists of genes with Log2FC>1 for UMAP clusters 4, 6, and 11–15. The list of top 7 most significant pathways is arranged based on the GeneRatio (number of input genes associated with a Reactome term / total number of input genes). (E) Summary of receptor-ligand pairs identified by NicheNet analysis, estimating the cell-cell communication between “sender” clusters 4, 11, 13, or 15 (combined) and “receiver” cluster 6 (left), cluster 12 (middle), and cluster 14 (right). (F) Heatmap showing downstream signaling genes estimated to be linked to cell-cell communication between the cluster 4, 11, 13, or 15 ligands (combined) and cells in cluster 14. The area under the precision-recall curve (AUPRC) was used to rank the ligand activity of senders on responders (left). See also Supplemental Figure 6.

References

    1. Aalst S. van, Ludwig I.S., van der Zee R., van Eden W., and Broere F.. 2017. Bystander activation of irrelevant CD4+ T cells following antigen-specific vaccination occurs in the presence and absence of adjuvant. PLoS ONE. 12:e0177365. doi: 10.1371/journal.pone.0177365. - DOI - PMC - PubMed
    1. Allan E.R.O., Tailor P., Balce D.R., Pirzadeh P., McKenna N.T., Renaux B., Warren A.L., Jirik F.R., and Yates R.M.. 2014. NADPH Oxidase Modifies Patterns of MHC Class II–Restricted Epitopic Repertoires through Redox Control of Antigen Processing. J. Immunol. 192:4989–5001. doi: 10.4049/jimmunol.1302896. - DOI - PubMed
    1. Alquicira-Hernandez J., and Powell J.E.. 2021. Nebulosa recovers single-cell gene expression signals by kernel density estimation. Bioinformatics. 37:2485–2487. doi: 10.1093/bioinformatics/btab003. - DOI - PubMed
    1. Andrews J.R., Noubary F., Walensky R.P., Cerda R., Losina E., and Horsburgh C.R.. 2012. Risk of Progression to Active Tuberculosis Following Reinfection With Mycobacterium tuberculosis. Clin Infect Dis. 54:784–791. doi: 10.1093/cid/cir951. - DOI - PMC - PubMed
    1. Antunes R. da S., Paul S., Sidney J., Weiskopf D., Dan J.M., Phillips E., Mallal S., Crotty S., Sette A., and Arlehamn C.S.L.. 2017. Definition of Human Epitopes Recognized in Tetanus Toxoid and Development of an Assay Strategy to Detect Ex Vivo Tetanus CD4+ T Cell Responses. PLoS ONE. 12:e0169086. doi: 10.1371/journal.pone.0169086. - DOI - PMC - PubMed

Publication types