[Preprint]. 2025 Feb 25:2025.02.24.639862.
doi: 10.1101/2025.02.24.639862.

Apolipoprotein E abundance is elevated in the brains of individuals with Down syndrome-Alzheimer's disease

Affiliations

Apolipoprotein E abundance is elevated in the brains of individuals with Down syndrome-Alzheimer's disease

Clíona Farrell et al. bioRxiv. .

Update in

Abstract

Trisomy of chromosome 21, the cause of Down syndrome (DS), is the most commonly occurring genetic cause of Alzheimer's disease (AD). Here, we compare the frontal cortex proteome of people with Down syndrome-Alzheimer's disease (DSAD) to demographically matched cases of early-onset AD and healthy ageing controls. We find wide dysregulation of the proteome, beyond proteins encoded by chromosome 21, including an increase in the abundance of the key AD-associated protein, APOE, in people with DSAD compared to matched cases of AD. To understand the cell types that may contribute to changes in protein abundance, we undertook a matched single-nuclei RNA-sequencing study, which demonstrated that APOE expression was elevated in subtypes of astrocytes, endothelial cells and pericytes in DSAD. We further investigate how trisomy 21 may cause increased APOE. Increased abundance of APOE may impact the development of, or response to, AD pathology in the brain of people with DSAD, altering disease mechanisms with clinical implications. Overall, these data highlight that trisomy 21 alters both the transcriptome and proteome of people with DS in the context of AD, and that these differences should be considered when selecting therapeutic strategies for this vulnerable group of individuals who have high-risk of early-onset dementia.

Keywords: Amyloid Precursor protein; ApoE; Trisomy 21; frontal cortex; mass spectrometry; neuropathology.


Conflict of interest statement

Competing interests The authors declare that they have no competing interests.

Figures

Figure 1
Figure 1. Significantly up- and down-regulated proteins between DSAD, EOAD and HA control frontal cortex by label-free proteomics.
Volcano plots show Log2(Fold-change) between case types, (a) DSAD compared with HA control, (b) DSAD compared with EOAD, (c) EOAD compared with HA control, plotted against −Log10(ANOVA p), using fold-change threshold of ±0.8 and a significance threshold of 1.5, created using VolcaNoseR [19]. The top 15 dysregulated proteins are labelled on each plot. Venn diagrams, created in BioVenn [29], demonstrate the common (d) upregulated and (e) downregulated proteins across the three comparisons of DSAD v HA, DSAD v EOAD and EOAD v HA.
Figure 2
Figure 2. Single-nuclei RNA sequencing demonstrates differential expression of chromosome 21 genes in a broad range of cell types, and upregulation of APOE in astrocytes, endothelial cells, and pericytes, in DSAD compared with EOAD and HA controls.
(a) Annotated UMAP demonstrates nuclei clusters identified. (b) UMAP demonstrates the identified nuclei by case type. (c-j) UMAP demonstrates the molecular identity of each cluster; neurons (RBFOX3), excitatory neurons (SATB2), inhibitory neurons (GAD2), pericytes (PDGFRB), oligodendrocytes (MOBP), astrocytes (ALDH1L1), microglia (TYROBP), and endothelial cells (CD34). This is further elaborated on in (k) with a dot plot showing multiple cellular markers used to identify cell clusters. (l) The total number of differentially expressed genes (DEGs) detected across nuclei clusters (magenta = upregulated, green = downregulated). (m, n) Hsa21-encoded genes identified in the proteomics dataset, and other commonly investigated Hsa21 genes, are significantly upregulated across multiple cell types in DSAD compared to EOAD and HA, respectively. (o-p) Non-Hsa21 genes which were significantly different between case types in the proteomic study are represented in dot plots. (o, p) APOE is significantly upregulated in astrocytes in DSAD compared to HA, and in astrocytes, endothelial cells and pericytes in DSAD compared to EOAD.
Figure 3
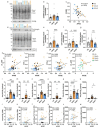
Figure 3. APOE abundance is increased in DSAD compared to matched cases of EOAD at protein and transcript level, independent of APOE genotype.
(a-d) Representative western blots for APOE (Calbiochem, 178479), APOE C-terminal (Sigma, SAB2701946) and Revert 700 total protein stain (Licor bio, 926-11016) in frontal cortex samples from (a, b) discovery + validation cohort A (n=14 HA, n=18 DSAD, n=14 EOAD), and (c, d) validation cohort B (n=6 YC, n=6 DS, n=10 DSAD, n=10 LOAD). (e) Case type significantly alters APOE abundance (Calbiochem) (Univariate ANOVA F(2,43) = 4.381, p = 0.019), with APOE abundance significantly higher in DSAD than EOAD (post-hoc comparison with Bonferroni p = 0.015). (f) Case type significantly alters APOE abundance (Sigma) (Univariate ANOVA F(2,43) = 4.696, p = 0.014), with APOE abundance significantly higher in DSAD than EOAD (post-hoc comparison with Bonferroni p = 0.012). No effect of sex, age at death, or PMI was found for either antibody in the discovery and validation A cohorts. (g) Case type significantly alters APOE abundance (Calbiochem), in validation cohort B (Univariate ANOVA, F(3,28) = 5.541, p = 0.004, with APOE abundance significantly higher in DSAD than YC (post-hoc correction with Bonferroni, p = 0.033) and in DSAD than LOAD (p = 0.005). No effect of sex, age at death or PMI was found. (h) Case type significantly alters APOE abundance (Sigma), in validation cohort B (Univariate ANOVA, F(3,28) = 6.099, p = 0.003), with APOE being significantly higher in DS than LOAD (post-hoc comparison with Bonferroni, p = 0.002), and in DSAD than LOAD (p = 0.040). A significant interaction of age at death and case type was identified (F(1,22) = 6.169, p = 0.021), but no effect of sex or PMI were identified. (i) In qPCR from bulk frontal cortex tissue homogenate, case type alters APOE expression (Univariate ANOVA F(2,38) = 5.373, p = 0.009), with higher APOE expression in HA and DSAD than EOAD (post-hoc comparison with Bonferroni p = 0.004 and p = 0.033 respectively). APOE abundance by APOE genotype as detected by western blot (j, l) APOE (Calbiochem) (k,m), and APOE (Sigma), and by (n) mass spectrometry. (l, m) APOE genotype only available for DSAD and LOAD groups so only these cases included in analysis. APOE genotype had no effect on APOE abundance by western blot (j) (Calbiochem) in discovery and validation cohort A (Univariate ANOVA, F(3,42) = 0.333, p = 0.802), (k) (Sigma) in discovery and validation cohort A (Univariate ANOVA, F(3,42) = 0.624, p = 0.604), (l) (Calbiochem) in validation cohort B (Univariate ANOVA, F(5,26) = 1.142, p = 0.364), (m) (Sigma) in validation cohort B (Univariate ANOVA, F(5,26) = 1.488, p = 0.228), or by mass-spectrometry (Univariate ANOVA F(2,12) = 0.055, p = 0.947). Data expressed as mean ± SEM, *p<0.05, **p<0.01.
Figure 4
Figure 4. The abundance of APOE correlates with full-length APP, APP C-terminal fragments, and amyloid-β40 in frontal cortex.
(a) Representative western blot for S100B (Abcam, ab41548) and Revert 700 total protein stain (Licor bio, 926-11016) in frontal cortex samples from the discovery cohort and validation cohort A. (b) Relative S100B abundance does not significantly differ between case types (Univariate ANOVA, F(2,38) = 2.188, p = 0.126). (c) S100B abundance negatively correlates with APOE abundance (Slope = −0.8321, Pearson’s R = −0.5074, F(1,41) = 14.21, p = 0.0005). (d) Representative western blot for APP (Abcam, Y188) showing bands representing full-length APP (FL-APP), APP-C-terminal fragment-α (CTF-α), APP-C-terminal fragment-β (CTF-β), and Revert 700 total protein stain (Licor bio, 926-11016) in frontal cortex samples from the discovery cohort and validation cohort A. (e) FL-APP abundance is significantly different between case types (Univariate ANOVA, F(2,38) = 7.155, p = 0.002), being elevated in DSAD compared to EOAD (post-hoc correction with Bonferroni, p < 0.0001), and tending to be elevated in DSAD compared to HA (p = 0.081). (f) CTF-α abundance differed between case types (Univariate ANOVA, F(2,38) = 7.025, p = 0.003) with elevated abundance in DSAD compared with EOAD (post-hoc correction with Bonferroni, p = 0.001) and DSAD compared with HA (p = 0.038). (g) CTF-β abundance differed between case types (Univariate ANOVA, F(2,38) = 5.493, p = 0.008) with elevated expression in DSAD compared with EOAD (post-hoc correction with Bonferroni, p = 0.003) and tending to be elevated in DSAD compared to HA (p = 0.087). (h) Correlation of FL-APP with APOE (Calbiochem) western blot abundance showed a significant positive correlation (Slope = 1.358, Pearson’s R = 0.4806, F(1,41) = 12.32, p = 0.0011). (i) Correlation of CTF-α with APOE (Calbiochem) western blot abundance showed a significant positive correlation (Slope = 0.2049, Pearson’s R = 0.3695, F(1,41) = 6.482, p = 0.0148). (j) Correlation of CTF-β with APOE (Calbiochem) western blot abundance showed a significant positive correlation (Slope = 0.1040, Pearson’s R = 0.3408, F(1,41) = 5.388, p = 0.0253). (k) Correlation of FL-APP with APOE (Calbiochem) abundance in validation cohort B did not show a significant relationship (Slope = 0.2387, Pearson’s R = 0.2073, F(1,30) = 1.347, p = 0.2549). MSD amyloid-β multiplex assay was used to quantify the abundance of (l-q) amyloid-β42 and amyloid-β40 in (l, m) soluble (Tris buffered saline), (n, o) membrane-associated (1% Triton-X100) and (p, q) insoluble aggregated (5M guanidine hydrochloride) fractions of frontal cortex from cases of HA, DSAD and EOAD (discovery cohort and validation cohort A). (l) Soluble amyloid-β42 abundance differed between case types (Univariate ANOVA, F(2,38) = 41.312, p < 0.0001), with significantly elevated levels in DSAD (post-hoc correction with Bonferroni p < 0.001) and EOAD (p < 0.001) than HA, and higher levels in DSAD than EOAD (p < 0.001). (n) Membrane-associated amyloid-β42 abundance differed between case types (Univariate ANOVA, F(2,38) = 45.256, p < 0.0001), with significantly elevated levels in DSAD (post-hoc correction with Bonferroni, p < 0.001) and EOAD (p < 0.001) than HA, and higher levels in DSAD than EOAD (p < 0.001). (p) Insoluble aggregated amyloid-β42 abundance differed between case types (Univariate ANOVA, F(2,38) = 11.322, p < 0.0001), with significantly elevated levels in DSAD (post-hoc correction with Bonferroni, p < 0.001) and EOAD (p = 0.016) than HA, and no difference between DSAD and EOAD (p = 0.281). (m) Soluble amyloid-β40 abundance differed between case types (Univariate ANOVA, F(2,38) = 7.215, p = 0.002), with significantly elevated levels in DSAD than HA (post-hoc correction with Bonferroni, p = 0.003), and EOAD (p = 0.004). (o) Membrane-associated amyloid-β40 abundance differed between case types (Univariate ANOVA, F(2,38) = 5.960, p = 0.006), with significantly elevated levels in DSAD than HA (post-hoc correction with Bonferroni, p = 0.006), and EOAD (p = 0.007). (q) Insoluble aggregated amyloid-β40 abundance differed between case types (Univariate ANOVA, F(2,29) = 3.339, p = 0.050), with significantly elevated levels in DSAD than EOAD (post-hoc correction with Bonferroni, p = 0.021). (r, t, v) No significant correlation was found between APOE (Calbiochem) abundance by western blot and amyloid-β42 in soluble or insoluble frontal cortex protein fractions. A significant positive correlation was identified between APOE (Calbiochem) abundance by western blot and amyloid-β40 in the (s) soluble (Slope = 20.83, Pearson’s R = 0.3664, F(1,41) = 6.359, p = 0.0157), (u) membrane-associated (Slope = 19.09, Pearson’s R = 0.4083, F(1,41) = 8.205, p = 0.0066) and (w) insoluble aggregated (Slope = 27840, Pearson’s R = 0.4312, F(1,32) = 7.307, p = 0.0109) frontal cortex fractions. Discovery and validation cohort A; n=14 HA, n=18 DSAD, n=14 EOAD. Validation cohort B; n = 6 YC, n = 6 DS, n = 10 DSAD, n = 10 LOAD. Data expressed as mean ± SEM, *p<0.05, **p<0.01, ***p<0.001, ****p<0.0001.
Figure 5
Figure 5. Total tau protein, but not AT8, correlates with APOE abundance.
The abundance of (a, b) total tau (lane quantified), and (d, e) AT8 phosphorylated tau was quantified in frontal cortex by western blot and correlated (c, f) with the abundance of APOE to determine if there was a relationship between these proteins in the discovery cohort and validation cohort A. (b) No significant effect of case type was found on tau total abundance (Univariate ANOVA, F(2,38) = 0.867, p = 0.428). (c) A correlation between APOE and total tau abundance was observed (Slope = 0.9412, Pearson’s R = 0.3139, F(1,41) = 4.480, p = 0.0404). (d) No significant effect of case type was found on AT8 abundance (Univariate ANOVA, F(2,38) = 1.741, p = 0.189). (f) No correlation between APOE and AT8 abundance was observed (Slope = 1.165, Pearson’s R = 0.03061, F(1,41) = 0.03844, p = 0.8455). n=14 HA, n=18 DSAD, n=14 EOAD. Data expressed as mean ± SEM.

References

    1. Alić I, Goh PA, Murray A, Portelius E, Gkanatsiou E, Gough G, Mok KY, Koschut D, Brunmeir R, Yeap YJ, O’Brien NL, Groet J, Shao X, Havlicek S, Dunn NR, Kvartsberg H, Brinkmalm G, Hithersay R, Startin C, Hamburg S, Phillips M, Pervushin K, Turmaine M, Wallon D, Rovelet-Lecrux A, Soininen H, Volpi E, Martin JE, Foo JN, Becker DL, Rostagno A, Ghiso J, Krsnik Ž, Šimić G, Kostović I, Mitrečić D, Francis PT, Blennow K, Strydom A, Nizetic D, Hardy J, Zetterberg H, Nižetić D (2021) Patient-specific Alzheimer-like pathology in trisomy 21 cerebral organoids reveals BACE2 as a gene dose-sensitive AD suppressor in human brain. Mol Psychiatry 26:5766–5788. doi: 10.1038/s41380-020-0806-5 - DOI - PMC - PubMed
    1. Altuna M, Giménez S, Fortea J (2021) Epilepsy in Down Syndrome: A Highly Prevalent Comorbidity. J Clin Med 10:2776. doi: 10.3390/jcm10132776 - DOI - PMC - PubMed
    1. Arai Y, Mizuguchi M, Ikeda K, Takashima S (1995) Developmental changes of apolipoprotein E immunoreactivity in Down syndrome brains. Dev Brain Res 87:228–232. doi: 10.1016/0165-3806(95)00066-M - DOI - PubMed
    1. Bejanin A, Iulita MF, Vilaplana E, Carmona-Iragui M, Benejam B, Videla L, Barroeta I, Fernandez S, Altuna M, Pegueroles J, Montal V, Valldeneu S, Giménez S, González-Ortiz S, Muñoz L, Padilla C, Aranha MR, Estellés T, Illán-Gala I, Belbin O, Camacho V, Wilson LR, Annus T, Osorio RS, Videla S, Lehmann S, Holland AJ, Zetterberg H, Blennow K, Alcolea D, Clarimon J, Zaman SH, Blesa R, Lleó A, Fortea J (2021) Association of Apolipoprotein E ε4 Allele With Clinical and Multimodal Biomarker Changes of Alzheimer Disease in Adults With Down Syndrome. JAMA Neurol 78:937–947. doi: 10.1001/jamaneurol.2021.1893 - DOI - PMC - PubMed
    1. Boerwinkle AH, Gordon BA, Wisch J, Flores S, Henson RL, Butt OH, McKay N, Chen CD, Benzinger TLS, Fagan AM, Handen BL, Christian BT, Head E, Mapstone M, Rafii MS, O’Bryant S, Lai F, Rosas HD, Lee JH, Silverman W, Brickman AM, Chhatwal JP, Cruchaga C, Perrin RJ, Xiong C, Hassenstab J, McDade E, Bateman RJ, Ances BM, Aizenstein HJ, Andrews HF, Bell K, Birn RM, Bulova P, Cheema A, Chen K, Clare I, Clark L, Cohen AD, Constantino JN, Doran EW, Feingold E, Foroud TM, Hartley SL, Hom C, Honig L, Ikonomovic MD, Johnson SC, Jordan C, Kamboh MI, Keator D, Klunk MD WE, Kofler JK, Kreisl WC, Krinsky- McHale SJ, Lao P, Laymon C, Lott IT, Lupson V, Mathis CA, Minhas DS, Nadkarni N, Pang D, Petersen M, Price JC, Pulsifer M, Reiman E, Rizvi B, Sabbagh MN, Schupf N, Tudorascu DL, Tumuluru R, Tycko B, Varadarajan B, White DA, Yassa MA, Zaman S, Zhang F, Adams S, Allegri R, Araki A, Barthelemy N, Bechara J, Berman S, Bodge C, Brandon S, Brooks W, Brosch J, Buck J, Buckles V, Carter K, Cash L, Mendez PC, Chua J, Chui H, Courtney L, Day G, DeLaCruz C, Denner D, Diffenbacher A, Dincer A, Donahue T, Douglas J, Duong D, Egido N, Esposito B, Farlow M, Feldman B, Fitzpatrick C, Fox N, Franklin E, Joseph-Mathurin N, Fujii H, Gardener S, Ghetti B, Goate A, Goldberg S, Goldman J, Gonzalez A, Gräber-Sultan S, Graff-Radford N, Graham M, Gray J, Gremminger E, Grilo M, Groves A, Haass C, Häslerc L, Hellm C, Herries E, Hoechst-Swisher L, Hofmann A, Holtzman D, Hornbeck R, Igor Y, Ihara R, Ikeuchi T, Ikonomovic S, Ishii K, Jack C, Jerome G, Johnson E, Jucker M, Karch C, Käser S, Kasuga K, Keefe S, Klunk W, Koeppe R, Koudelis D, Kuder-Buletta E, Laske C, Levey A, Levin J, Li Y, Lopez O, Marsh J, Martins R, Mason NS, Masters C, Mawuenyega K, McCullough A, Mejia A, Morenas-Rodriguez E, Morris JC, Mountz J, Mummery C, Nadkarni N, Nagamatsu A, Neimeyer K, Niimi Y, Noble J, Norton J, Nuscher B, Obermüller U, O’Connor A, Patira R, Ping L, Preische O, Renton A, Ringman J, Salloway S, Schofield P, Senda M, Seyfried NT, Shady K, Shimada H, Sigurdson W, Smith J, Smith L, Snitz B, Sohrabi H, Stephens S, Taddei K, Thompson S, Vöglein J, Wang P, Wang Q, Weamer E, Xu J, Xu X (2023) Comparison of amyloid burden in individuals with Down syndrome versus autosomal dominant Alzheimer’s disease: a cross-sectional study. Lancet Neurol 22:55–65. doi: 10.1016/S1474-4422(22)00408-2 - DOI - PMC - PubMed

Publication types

LinkOut - more resources