. 2024 Oct 11;10(2):e10727.
doi: 10.1002/btm2.10727. eCollection 2025 Mar.

Photobiomodulation improves functional recovery after mild traumatic brain injury

Affiliations

Photobiomodulation improves functional recovery after mild traumatic brain injury

Andrew R Stevens et al. Bioeng Transl Med. .

Abstract

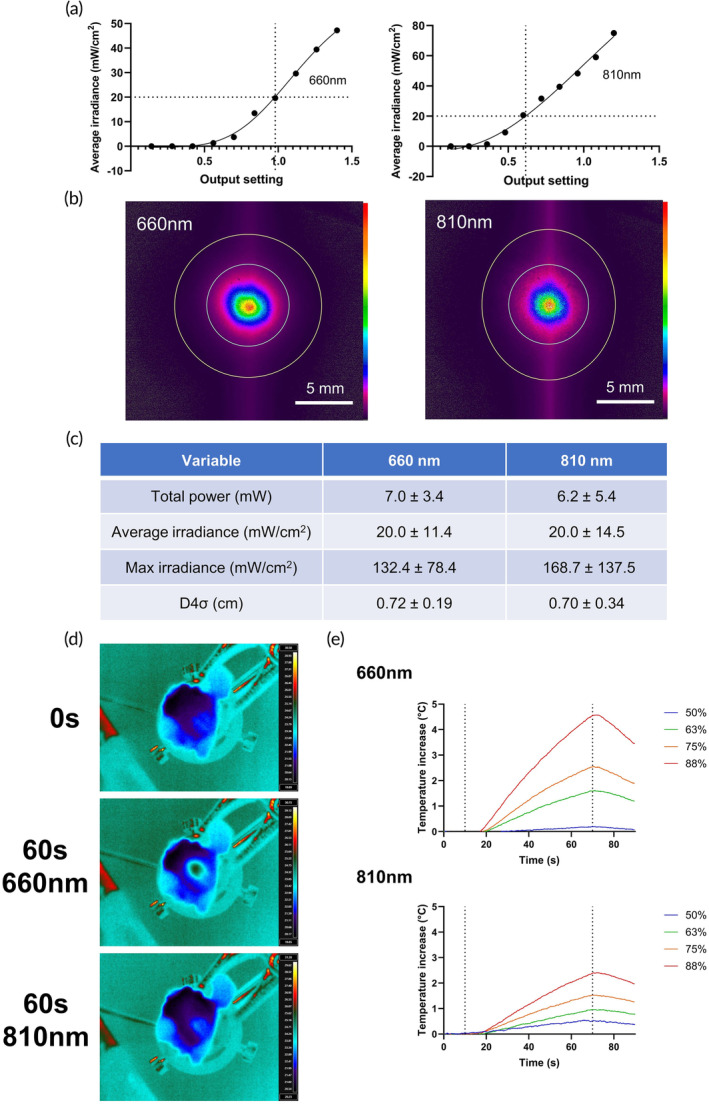
Mild traumatic brain injury (mTBI) is a common consequence of head injury but there are no recognized interventions to promote recovery of the brain. We previously showed that photobiomodulation (PBM) significantly reduced the number of apoptotic cells in adult rat hippocampal organotypic slice cultures. In this study, we first optimized PBM delivery parameters for use in mTBI, conducting cadaveric studies to calibrate 660 and 810 nm lasers for transcutaneous delivery of PBM to the cortical surface. We then used an in vivo weight drop mTBI model in adult rats and delivered daily optimized doses of 660, 810 nm, or combined 660/810 nm PBM. Functional recovery was assessed using novel object recognition (NOR) and beam balance tests, whilst histology and immunohistochemistry were used to assess the mTBI neuropathology. We found that PBM at 810, 660 nm, or 810/660 nm all significantly improved both NOR and beam balance performance, with 810 nm PBM having the greatest effects. Histology demonstrated no overt structural damage in the brain after mTBI, however, immunohistochemistry using brain sections showed significantly reduced activation of both CD11b+ microglia and glial fibrillary acidic protein (GFAP)+ astrocytes at 3 days post-injury. Significantly reduced cortical localization of the apoptosis marker, cleaved caspase-3, and modest reductions in extracellular matrix deposition after PBM treatment, limited to choroid plexus and periventricular areas were also observed. Our results demonstrate that 810 nm PBM optimally improved functional outcomes after mTBI, reduced markers associated with apoptosis and astrocyte/microglial activation, and thus may be useful as a potential regenerative therapy.

Keywords: functional recovery; medical devices; neuroprotection; photobiomodulation; traumatic brain injury.


Conflict of interest statement

Members of the authorship have submitted a patent pending application (DD, MH, WP, AS, and ZA) relating to the invasive delivery of PBM (UK Patent App. No. 2006201.4; US Patent App. 17/922, 157, 2023). There are no other competing interests to declare, including those relating to employment, consultancy, other patents, or products in development.

Figures

FIGURE 1
FIGURE 1
(a) Plot of average irradiance transmitted to the inner surface of skull against laser output setting for 660 (left panel) and 810 nm (right panel) lasers. Additional × axis line indicates 20 mW/cm2 level, with corresponding y axis line at the intersection to plot required output setting. Output settings given in manufacturer determined arbitrary units as a 0%–100% output (non‐linear) of 1.4 (660 nm) and 1.2 (810 nm). (b) Beam profiles at inner surface of skull with transcutaneous application of PBM for 660 (left panel) and 810 nm (right panel) lasers. Gaussian distribution of transmitted light with a D4𝜎 of 0.70–0.72 cm. Relative intensity color bar to right (OSI Rainbow). (c) Table showing beam profilometry readings with SD using output settings derived from (a). n = 4 per group. (d) Images of FLIR thermal profiling taken from the internal skull surface at 0, and 60 s during 60 s treatment protocol for 20 mW/cm2 660 nm and 810 nm PBM. (e) Temporal plots of thermal change (maximum temperature) for a region of interest on the internal skull surface during 60 s treatment protocol for 660 nm and 810 nm PBM. x‐axis lines denote ON (10 s) and OFF (70 s), with 10 s observation to establish temperature baseline prior to PBM, and 20 s post‐administration to observe cooldown. Temperature change given is relative to background temperature recorded within the field of view of the thermal imaging camera, from tissue not exposed to PBM. n = 4 per group. Treatment protocols used for PBM were 70% output for 660 nm and 63% for 810 nm.
FIGURE 2
FIGURE 2
(a) Schematic diagram of a rat skull (surface view) with red dots demonstrating the 12 points of PBM administration. B = bregma; L = lambda. (b) Schematic diagram of a coronal section of adult rat brain (bregma 1.30 mm) with inset demonstrating brain areas (labeled) imaged for assessment of immunofluorescence. cc, corpus callosum; Cg1, cingulate cortex area 1; Cg2, cingulate cortex area 2; Ch, choroid plexus (within lateral and third ventricles); FL, forelimb area of cortex; Fr1, frontal cortex area 1; Fr2, frontal cortex area 2; HL, hindlimb area of cortex; PV‐CPu, periventricular region of caudate putamen. (c) Novel object recognition at four timepoints. (d) Beam walk (error ratio calculated by the formula errors/completed steps) at three time points. * = p <0.05 ** = p <0.01 *** = p <0.001 **** = p <0.0001. Comparisons for TBI vs. control not shown (all p <0.0001). All n = 4 per group. PBM, photobiomodulation; TBI, traumatic brain injury. (e) H&E staining on brain coronal slices from all treatment conditions at 3 dpi (days post‐injury) and 4 wpi (weeks post‐injury). Images were taken from frontal cortex, corpus callosum, and choroid plexus (body of the lateral ventricle). No differences evident, with the exception of some increased cellularity (hematoxylin staining) within the corpus callosum in acute (3 dpi) phase, not evident with PBM therapy at this time point. PBM taken from 810 nm groups. All n = 4 per group.
FIGURE 3
FIGURE 3
PBM reduces GFAP immunoreactivity across brain areas at 3 dpi. (A) Area controlled integrated densities for GFAP in denoted brain areas. (b) Immunofluorescence imaging for Cg2 and cc areas. A total of 810 nm used in PBM group (2 min per day (1 min per hemisphere), 20 mW/cm2, 2.4 J). n = 5 per group (n = 4 for control). * = p <0.05; ** = p <0.01. Non‐significant comparisons not shown. AU, arbitrary units; cc, corpus callosum; Cg1, cingulate cortex area 1; Cg2, cingulate cortex area 2; Ch, choroid plexus (within lateral and third ventricles); DAPI, 4,6‐diamidino‐2phenylindole; FL, forelimb area of cortex; Fr1, frontal cortex area 1; Fr2, frontal cortex area 2; GFAP, glial fibrillary acidic protein; HL, hindlimb area of cortex; NF200, neurofilament 200; PV‐CPu, periventricular region of caudate putamen; PBM, photobiomodulation, TBI, traumatic brain injury.
FIGURE 4
FIGURE 4
There was no discernible difference between injury, control and PBM in GFAP+ immunoreactive areas across brain areas at 6 wpi. (a) Area controlled integrated densities for GFAP in denoted brain areas. (b) Immunofluorescence imaging for Cg1 areas (3 dpi TBI shown for reference). A total of 660 and/or 810 nm used in PBM group (2 min per day (1 min per hemisphere), 3‐day course, 20 mW/cm2, 2.4 J). n = 5 per group (n = 4 for control). Non‐significant comparisons not shown. AU, arbitrary units; cc, corpus callosum; Cg1, cingulate cortex area 1; Cg2, cingulate cortex area 2; Ch, choroid plexus (within lateral and third ventricles); DAPI, 4,6‐diamidino‐2‐phenylindole; FL, forelimb area of cortex; Fr1, frontal cortex area 1; Fr2, frontal cortex area 2; GFAP, glial fibrillary acidic protein; HL, hindlimb area of cortex; NF200, neurofilament 200; PBM, photobiomodulation; PV‐CPu, periventricular region of caudate putamen; TBI, traumatic brain injury.
FIGURE 5
FIGURE 5
PBM reduces CD11b immunofluorescence across brain areas at 3 dpi. (a) Area controlled integrated densities for CD11b in denoted brain areas. (b) Immunofluorescence imaging for Cg2 areas. A total of 810 nm used in PBM group (2 min per day (1 min per hemisphere), 20 mW/cm2, 2.4 J). n = 5 per group (n = 4 for control). * = p <0.05; ** = p <0.01; ns = not significant. Non‐significant comparisons not shown. cc, corpus callosum; AU, arbitrary units; Cg1, cingulate cortex area 1; Cg2, cingulate cortex area 2; Ch, choroid plexus (within lateral and third ventricles); DAPI, 4,6‐diamidino‐2‐phenylindole; Fr1, frontal cortex area 1; Fr2, frontal cortex area 2; GFAP, glial fibrillary acidic protein; HL, hindlimb area of cortex; NF200, neurofilament 200; PBM, photobiomodulation; PVA, paraventricular thalamic nucleus, area a; PV‐CPu, periventricular region of caudate putamen; TBI, traumatic brain injury.
FIGURE 6
FIGURE 6
PBM results in minimal reductions in fibronectin immunofluorescence across brain areas at 3 dpi. (a) Area controlled integrated densities for fibronectin (FN) and laminin (LN) in denoted brain areas. (b) Immunofluorescence imaging for PV‐CPu areas. A total of 810 nm used in PBM group (2 min per day (1 min per hemisphere), 20 mW/cm2, 2.4 J). n = 5 per group (n = 4 for control). * = p <0.05; ** = p <0.01; ns = not significant. AU, arbitrary units; cc, corpus callosum; Cg1, cingulate cortex area 1; Cg2, cingulate cortex area 2; Ch, choroid plexus (within lateral and third ventricles); DAPI, 4,6‐diamidino‐2phenylindole; FL, forelimb area of cortex; FN, fibronectin; Fr2, frontal cortex area 2; GFAP, glial fibrillary acidic protein; HL, hindlimb area of cortex; LN, laminin; NF200, neurofilament 200; PBM, photobiomodulation; PVA, paraventricular thalamic nucleus, area a; PV‐CPu, periventricular region of caudate putamen; TBI, traumatic brain injury.
FIGURE 7
FIGURE 7
PBM results in reduced cortical expression of cleaved caspase‐3 at 3 days post‐injury. (a) Comparison of counts of cleaved caspase‐3+ nuclei across five cortical areas. (b) Comparison of fluorescence intensity of cleaved caspase‐3 across whole field in five cortical areas. (c) Immunofluorescence imaging in HL area. A total of 660 and/or 810 nm used in PBM group (2 min per day (1 min per hemisphere), 20 mW/cm2, 2.4 J/cm2). n = 4 per group. * = p <0.05. AU, arbitrary units; CC3, cleaved caspase‐3; DAPI, 4,6‐diamidino‐2‐phenylindole; ns, not significant; PBM, photobiomodulation; TBI, traumatic brain injury.

References

    1. Maas AIR, Menon DK, David Adelson PD, et al. Traumatic brain injury: integrated approaches to improve prevention, clinical care, and research. Lancet Neurol. 2017;16:987‐1048. - PubMed
    1. Hellewell SC, Beaton CS, Welton T, Grieve SM. Characterizing the risk of depression following mild traumatic brain injury: a meta‐analysis of the literature comparing chronic mTBI to non‐mTBI populations. Front Neurol. 2020;11:1‐14. - PMC - PubMed
    1. Danna‐Dos‐Santos A, Mohapatra S, Santos M, Degani AM. Long‐term effects of mild traumatic brain injuries to oculomotor tracking performances and reaction times to simple environmental stimuli. Sci Rep. 2018;8:4583. - PMC - PubMed
    1. Dean PJA, Sterr A. Long‐term effects of mild traumatic brain injury on cognitive performance. Front Hum Neurosci. 2013;7:30. - PMC - PubMed
    1. Madhok DY, Rodriguez RM, Barber J, et al. Outcomes in patients with mild traumatic brain injury without acute intracranial traumatic injury. JAMA Netw Open. 2022;5:E2223245. - PMC - PubMed

LinkOut - more resources