

The impact of high humidex on the risk of hospital admissions for urinary system diseases in Lanzhou, China: A time-series analysis
- PMID: 40060900
- PMCID: PMC11889667
- DOI: 10.1016/j.isci.2025.111968
The impact of high humidex on the risk of hospital admissions for urinary system diseases in Lanzhou, China: A time-series analysis
Abstract
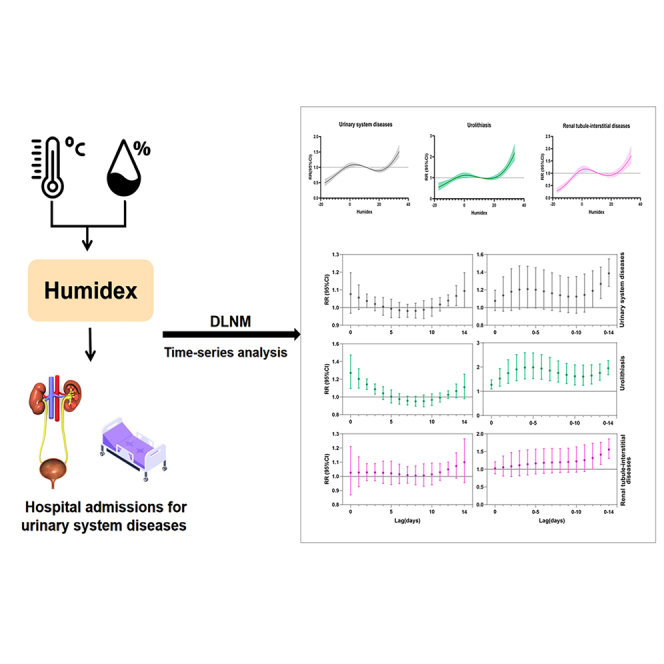
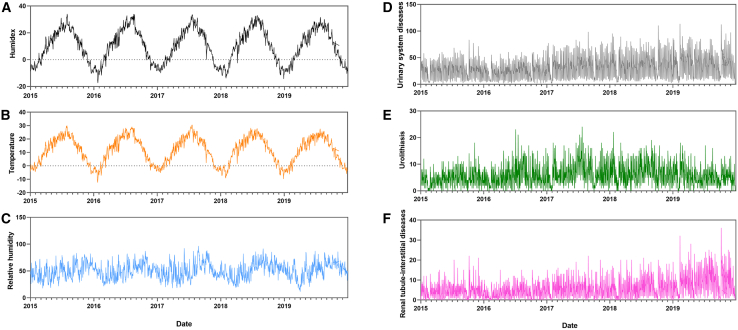
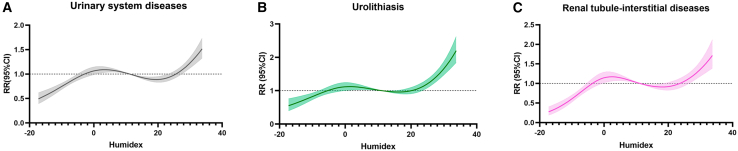
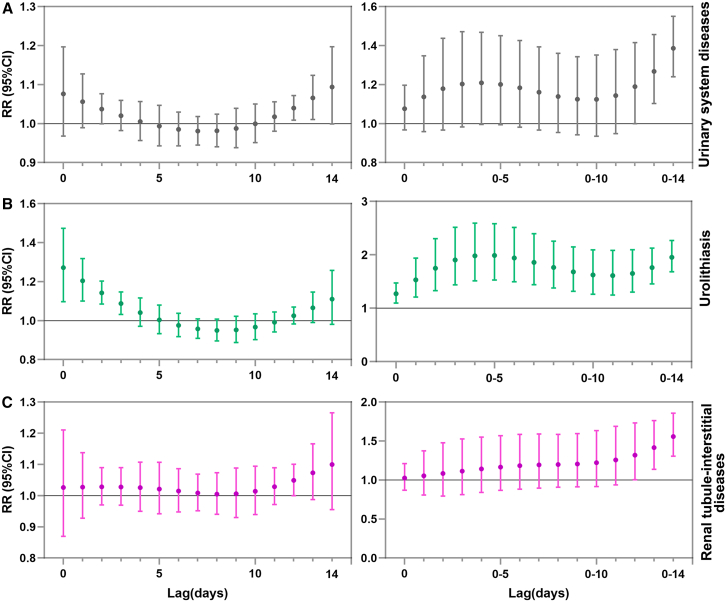
There is scant research on the association between humidex exposure and urinary system diseases. Hospitalization records from Lanzhou city were collected for the period 2015 to 2019, alongside daily meteorological and air pollution data for the study duration. Daily humidex was calculated using temperature and relative humidity indices. The study employed a combined approach of generalized additive models and distributed lag non-linear models (DLNMs) to estimate the exposure-lag-response relationship between humidex and hospital admissions for urinary system diseases, as well as for subgroups of diseases (urolithiasis and tubule-interstitial diseases). A total of 55,365 patients with urinary system diseases were included. The single lag effect of overall urinary system diseases was most significant on lag13 with the relative risk (RR) = 1.066 (95% confidence interval [CI]: 1.011, 1.124), while the cumulative lag effect over lag0-14 was most significant with RR = 1.387 (95% CI: 1.240, 1.550). The goal of this study was to establish an early warning system and allocate medical resources effectively to reduce hospital admissions for urinary system diseases.
Keywords: Climatology; Public health.
© 2025 The Author(s).
Conflict of interest statement
The authors declare no competing interests.
Figures
Similar articles
-
Nonlinear effects of humidex on risk of outpatient visit for allergic conjunctivitis among children and adolescents in Shanghai, China: A time series analysis.J Glob Health. 2023 Nov 3;13:04132. doi: 10.7189/jogh.13.04132. J Glob Health. 2023. PMID: 37921044 Free PMC article.
-
Association of Exposure to Humidex with Schizophrenia Admissions in Qingdao, China: A Time-Series Study.Neuropsychiatr Dis Treat. 2025 Apr 29;21:989-997. doi: 10.2147/NDT.S521191. eCollection 2025. Neuropsychiatr Dis Treat. 2025. PMID: 40322724 Free PMC article.
-
The exposure-response association between humidex and bacillary dysentery: A two-stage time series analysis of 316 cities in mainland China.Sci Total Environ. 2021 Nov 25;797:148840. doi: 10.1016/j.scitotenv.2021.148840. Epub 2021 Jul 2. Sci Total Environ. 2021. PMID: 34303970
-
Impacts of exposure to humidex on the risk of childhood asthma hospitalizations in Hefei, China: Effect modification by gender and age.Sci Total Environ. 2019 Nov 15;691:296-305. doi: 10.1016/j.scitotenv.2019.07.026. Epub 2019 Jul 3. Sci Total Environ. 2019. PMID: 31323575
-
Association of sudden sensorineural hearing loss with meteorological factors: a time series study in Hefei, China, and a literature review.Environ Sci Pollut Res Int. 2024 Jun;31(30):42970-42990. doi: 10.1007/s11356-024-33943-1. Epub 2024 Jun 17. Environ Sci Pollut Res Int. 2024. PMID: 38886269 Free PMC article. Review.
References
-
- Ferrelli F., Pontrelli Albisetti M., Brendel A.S., Casoni A.I., Hesp P.A. Appraisal of Daily Temperature and Rainfall Events in the Context of Global Warming in South Australia. Watermark. 2024;16:351. doi: 10.3390/w16020351. - DOI
-
- Shehaj L., Kazancioğlu R. The Impact of Climate Change on Chronic Kidney Disease. Bezmialem Science. 2023;11:460–465. doi: 10.14235/bas.galenos.2023.74436. - DOI
-
- Liu Z., Wang S., Zhang Y., Xiang J., Tong M.X., Gao Q., Zhang Y., Sun S., Liu Q., Jiang B., Bi P. Effect of temperature and its interactions with relative humidity and rainfall on malaria in a temperate city Suzhou, China. Environ. Sci. Pollut. Res. 2021;28:16830–16842. doi: 10.1007/s11356-020-12138-4. - DOI - PubMed
LinkOut - more resources
Full Text Sources
