Review
. 2025 Mar 7;15(10):7383-7471.
doi: 10.1039/d5ra00157a. eCollection 2025 Mar 6.

Thermally activated delayed fluorescence materials: innovative design and advanced application in biomedicine, catalysis and electronics

Affiliations
Review

Thermally activated delayed fluorescence materials: innovative design and advanced application in biomedicine, catalysis and electronics

Ehsan Ullah Mughal et al. RSC Adv. .

Abstract

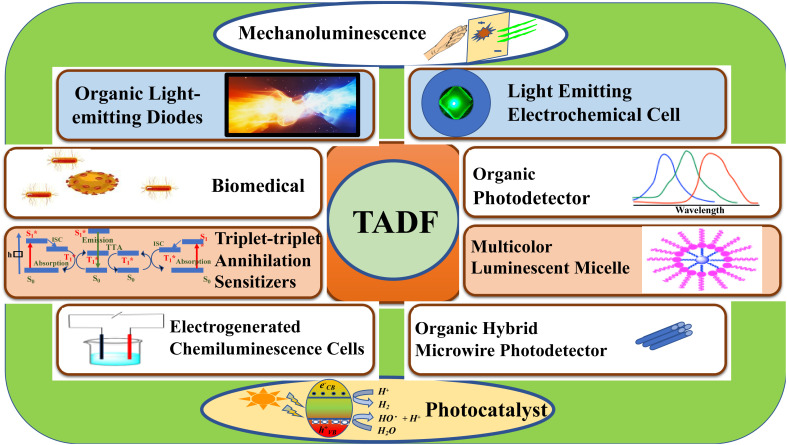
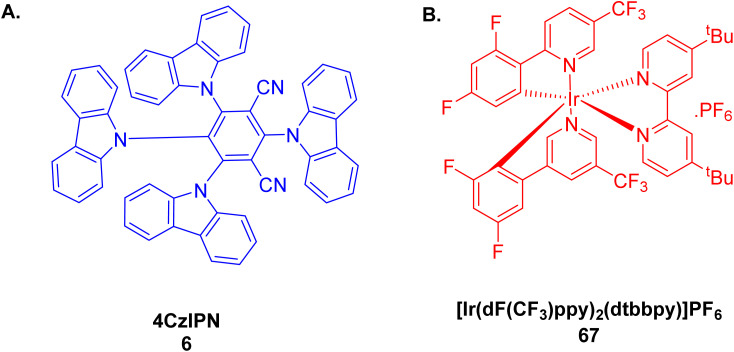
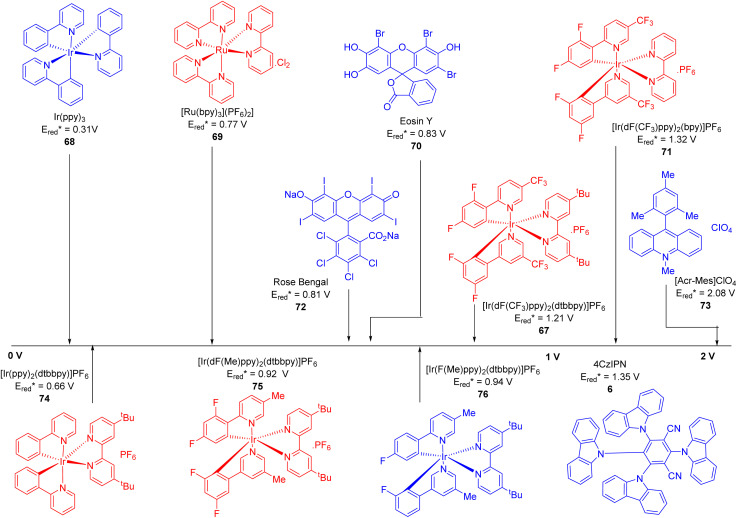
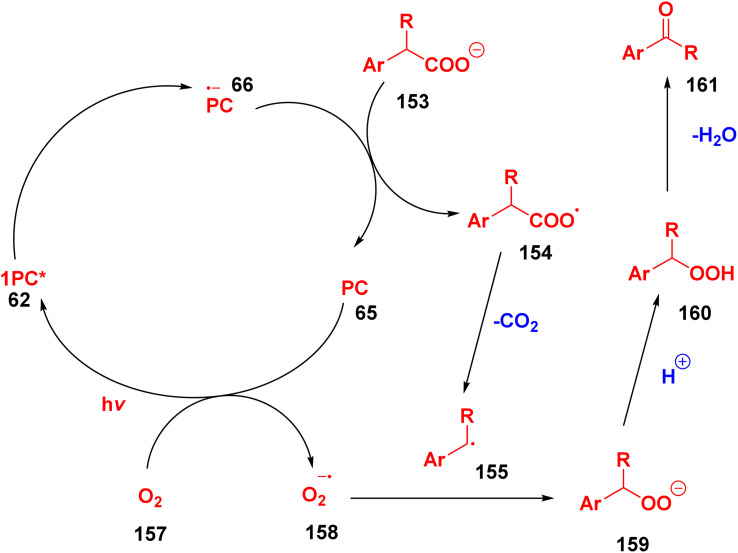
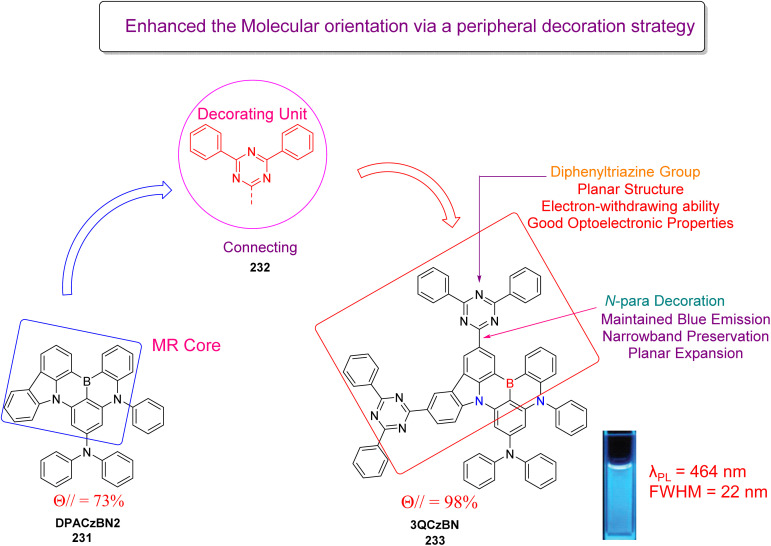
Thermally Activated Delayed Fluorescence (TADF) materials have emerged as a revolutionary class of functional compounds, driven by their unique ability to utilize excitons from both singlet and triplet states for efficient fluorescence emission. This manuscript provides an overview of recent innovations in TADF material design, focusing on molecular strategies to achieve optimal TADF properties, including small singlet-triplet energy gaps (ΔE ST) and high photoluminescence quantum yields. We explore the diverse applications of TADF materials, spanning OLEDs, biomedical imaging, photosensitizers, photocatalysis, UV photodetectors (UVOPDs), electrogenerated chemiluminescence, triplet-triplet annihilation (TTA) sensitizers, organic hybrid microwire radial heterojunctions, multicolor luminescent micelles, mechano-luminescence (ML), light-emitting electrochemical cells (LEECs), and fluorescent probes. The integration of TADF materials in these technologies highlights their potential to enhance performance and efficiency. Through this review, we aim to elucidate the fundamental principles governing TADF behavior and present a forward-looking perspective on the synthetic methodologies and new, versatile applications of materials.


Conflict of interest statement

The authors have no conflict of interest to declare.

Figures

Fig. 1
Fig. 1. Applications of TADF materials.
Fig. 2
Fig. 2. Process of transitions of photo-excited photons for different phenomena.
Fig. 3
Fig. 3. Principles for designing D–A system of TADF molecules.
Fig. 4
Fig. 4. Mechanism for generation of exciplexes by co-doping.
Fig. 5
Fig. 5. Electrically excited generation of exciplexes.
Fig. 6
Fig. 6. Biomedical application of metal-free TADF luminophores.
Fig. 7
Fig. 7. (A) Illustration of the synthesis of NFO nanoparticles (NFO-NPs) using the reprecipitation technique. (B) SEM image of the NFO-NPs and TEM images (C) Dynamic Light Scattering (DLS) measurements and polydispersity index (PDI) of the NFO-NPs. (D) Zeta potential measurement of NFO-NPs. (E) Photographs showing TPAAQ under UV light (e1) and NFO-NPs dispersed in water (e2 and e3). Reproduced from ref. with permission from the Royal Society of Chemistry.
Fig. 8
Fig. 8. (A) Schematic diagram for fabrication of blue/red/green fluorescent nanoprobe for cellular imaging in one- and two-photon imaging systems (B) one- and two-photon imaging showing fluorescence and cellular localization of the three-fluorescent organic nanoprobes (FONs) in A549 cells. Reproduced from ref. with permission from American Chemical Society, Copyright © 2016.
Fig. 9
Fig. 9. Chemical structures of molecules 6, 28, 29 and 30 used in the preparation of TADF-emitting glassy organic nanoparticles. Reproduced from ref. with permission from the Royal Society of Chemistry.
Fig. 10
Fig. 10. (A) Schematic representation of galactose-modified liposomes transport via GLUT. (B) Cell viability at various concentrations of Gal-PEG-DSPE- and Blank-PEG-DSPE-modified liposomes in HepG2 cells (C) UV-vis absorption spectra for absorbance (left) and fluorescence. (D) Confocal fluorescence images of HepG2 cells after incubation solely with Blank-PEG-DSPE and Gal-PEG-DSPE modified liposomes in PBS for 2 h. Adapted from ref. with permission from Elsevier, Copyright © 2020.
Fig. 11
Fig. 11. The fabrication process of TXO NPs through nanoprecipitation. Reproduced from ref. with permission from John Wiley & Sons, Copyright © 2018, Wiley-VCH Verlag GmbH & Co. KGaA, Weinheim.
Fig. 12
Fig. 12. Molecular structures of the luminogens and crystal structures of BP-2PXZ (31) and BP-PXZ (32). Reproduced from ref. with permission from the Royal Society of Chemistry.
Fig. 13
Fig. 13. (A) The synthesis of organelle-specific fluorescent probes 35 and 36. (B) The absorption and emission spectra of AI-Cz (33), AI-Cz-MT (35), and AI-Cz-LT (36). Reproduced from ref. with permission from American Chemical Society, Copyright © 2023.
Fig. 14
Fig. 14. The subcellular localization of AI-Cz-MT (35) (A) and AI-Cz-LT (36) (B) in HepG2 cells investigated using fluorescence microscopy. Reproduced from ref. with permission from American Chemical Society, Copyright © 2023.
Fig. 15
Fig. 15. Proposed mechanism for regulation of TADF using Zn2+. Reproduced from ref. , https://doi.org/10.1039/C8SC01485J, under the terms of the CC BY-NC 3.0 license, https://creativecommons.org/licenses/by-nc/3.0/.
Fig. 16
Fig. 16. HeLa cells incubated with 10 μM ZnPXZT1 visualized using (a–c) steady-state imaging, (d) luminescence lifetime imaging, and (e and f) time-gated imaging. Reproduced from ref. , https://doi.org/10.1039/C8SC01485J, under the terms of the CC BY-NC 3.0 license, https://creativecommons.org/licenses/by-nc/3.0/.
Fig. 17
Fig. 17. Structure of amphiphilic TADF monomer 39 and the synthesis of TADF nanoprobe AI-Cz-NP. Reproduced from ref. with permission from the Royal Society of Chemistry.
Fig. 18
Fig. 18. (A) Structures of TADF organic materials PXZ-NI (40), PTZ-NI (41), and Lyso-PXZ-NI (42). (B) Temperature-dependent TRPL signals for (a) PXZ-NI (40), (b) PTZ-NI (41), and (c) Lyso-PXZ-NI (42), and corresponding Arrhenius plots for the TRPL signals for (d) PXZ-NI (40), (e) PTZ-NI (41), and (f) Lyso-PXZ-NI (42). Reproduced from ref. with permission from American Chemical Society, Copyright © 2020.
Fig. 19
Fig. 19. (a) The molecular scaffold of M–1 showcases dual TADF emission in the monomeric and aggregated states. (b) Pretreatment involves encapsulating M–1 within NPs (c) TRLI imaging in HeLa cells (d) Integration of TRLI data from dual channels significantly reduces distortion by 30–40%, improving imaging precision. Reproduced from ref. with permission from John Wiley & Sons, Copyright © 2020, Wiley-VCH Verlag GmbH & Co. KGaA, Weinheim.
Fig. 20
Fig. 20. (a) Illustration of TAA emission mechanism involving TAER RISC processes. (b) Structure of DCzB. (c) DCzB NPs prepared by encapsulating DCzB. (d) DLS & TEM images of the DCzB NPs. (e) Treatment of PLIM and TRLI of cells in the presence of DCzB NPs. (f) Images of DCzB in powdered form after UV irradiation (365 nm) at various temperatures. Reproduced from ref. , https://doi.org/10.1038/s41467-020-14669-3, under the terms of the CC BY 4.0 license, https://creativecommons.org/licenses/by/4.0/.
Fig. 21
Fig. 21. (A) Two-photon absorption spectra of TePP, TPM, TPM-CL, 2TPA-DPM, and 2TPA-DPM-CL. (B) (a) One-photon absorption spectra, as well as (b) the one-photon absorption (Abs), fluorescence (FL), and phosphorescence (PH) spectra, with arrows showing the Stokes shift for compounds TPM and TPM-CL in various states. (C) Structures of the investigated compounds. Reproduced from ref. with permission from American Chemical Society, Copyright © 2022.
Fig. 22
Fig. 22. (A) Preparation of FAc-Py (45) and FAc-Py-Ester (48). (B) Time-gated imaging of carboxylesterase activity in HeLa cells incubated with varying concentrations of FAc-Py-Ester (48). Reproduced from ref. with permission from Elsevier, Copyright © 2022.
Fig. 23
Fig. 23. (A) Schematic illustration of the synthesis and β-gal sensing mechanism of HBT-PXZ-Ga. (B) Fluorescence lifetime imaging of HBT-PXZ-Ga-treated S. pneumoniae by (a) fluorescence intensity and (b) lifetime. Excitation wavelength λex = 405 nm (25 000 Hz) Reproduced from ref. with permission from American Chemical Society, Copyright © 2023.
Fig. 24
Fig. 24. (A) (a) Representation of TPAAQ/CBP/CPP TADF nanoparticles (b) DLS histograms showing the size of the nanoparticles and inset TEM images showing their morphology. (c) Photographs of the nanoparticle solutions under UV irradiation. (B) Time-gated emission spectra of the nanoparticles at various delay times. (C) Imaging of zebrafish incubated with TPAAQ/CBP/CPP nanoparticles, where the bright field is displayed on the left side of the figure, the steady-state luminescence is shown in the middle, and the time-gated luminescence is displayed on the right. Reproduced from ref. with permission from John Wiley & Sons, Copyright © 2024, Wiley-VCH Verlag GmbH & Co. KGaA, Weinheim.
Fig. 25
Fig. 25. (A) Design of aggregation-regulated TADF materials (B) diverse architectures of aggregation-regulated TADF materials (C) spectra for (a) one-photon absorption and (b) one-photon fluorescence (c) one-photon absorption and fluorescence of the fluorophores and (d) two-photon absorption. All investigated scaffolds were measured in aqueous solution. Reproduced from ref. with permission from American Chemical Society, Copyright © 2023.
Fig. 26
Fig. 26. (A) (Left) Synthetic procedure for g-Odots, showing a suspension of particles under 365 nm excitation in water (5.3 × 10⁹ particles per mL). (Right) SEM image of obtained particles: 2.00 kV accelerating voltage, 402 40× magnification, 300 nm scale bar (B) SEM images of (A) g-Odots synthesized by the standard oil-in-water emulsion method, (B) a-Odots prepared by nanoprecipitation, and (C) annealed a-Odots. Reproduced from ref. with permission from American Chemical Society, Copyright © 2024.
Fig. 27
Fig. 27. Absorption and emission spectra of (a) Pt(ii) and (b) Pd(ii) complexes. (c) Pd–O–S emission spectra in anoxic toluene. (d) Schematic illustration of the photoluminescence processes of the tested complexes. Reproduced from ref. with permission from American Chemical Society, Copyright © 2017.
Fig. 28
Fig. 28. (Left) TADF polymer dots (PDots) with the green-emitting PTZ-ODA0.15 (in green) and blue-emitting PSMA components (in blue). (Right) The emission intensity of PTZ-ODA0.15 at 516 nm relative to 396 nm was measured under varying oxygen concentrations. Reproduced from ref. with permission from American Chemical Society, Copyright © 2020.
Fig. 29
Fig. 29. (A) Illustration of the structure of NAI-based TADF polymers P14 and P15 and their colors at temperatures between 10–80 °C. (B) Emission spectra for polymers P14 and P15 at a range of temperatures. (C) The fluorescence intensity ratio I460/I660versus temperature for both P14 and P15. (D) CIE chromaticity plot for polymer P14. Reproduced from ref. with permission from American Chemical Society, Copyright © 2020.
Fig. 30
Fig. 30. Schematic diagram depicting synthesis and dual-mode detection of AI-Cz-Neo to image bacterial 16S rRNA in tissue samples. Adapted from ref. with permission from American Chemical Society, Copyright © 2020.
Fig. 31
Fig. 31. (Top) Design of TADF-3-based nanostructured membranes with varying cholesterol contents to self-assemble into micelles containing phospholipids (PLs) and cholesterol (Chol). (Bottom) A 3D plot diagram of sensing using TADF-3-based micelles within simulated membrane environments. Reproduced from ref. , https://doi.org/10.1038/s41467-019-08684-2, under the terms of the CC BY 4.0 license, https://creativecommons.org/licenses/by/4.0/.
Fig. 32
Fig. 32. Modified Jablonski diagram illustrating singlet oxygen production by (a) conventional photosensitization and (b) TADF photosensitization. Reproduced from ref. with permission from the Royal Society of Chemistry.
Fig. 33
Fig. 33. (A) Diagram depicting the design of TADF NPs for TPE fluorescence imaging and PDT (B) single-photon excitation and TPE penetration depth images of A549. Adapted from ref. with permission from American Chemical Society, Copyright © 2019.
Fig. 34
Fig. 34. (A) Diagram depicting TADF fluorescein scaffolds for fluorescence imaging and PDT. (B) PDT process of the TADF in theranostics molecule. (C) Structure of the chemical scaffolds of 50, 51, and 52. (D) PDT effectiveness of 51 in mice. Reproduced from ref. with permission from American Chemical Society, Copyright © 2019.
Fig. 35
Fig. 35. (A) Illustration of exciton dynamics in TADF-NPs. (B) Preparation of TADF nanoparticles (NPs). (C) SPE and TPE images. Reproduced from ref. , https://doi.org/10.1039/C9SC05817F, under the terms of the CC BY 4.0 license, https://creativecommons.org/licenses/by/4.0/.
Fig. 36
Fig. 36. Chemical structures and 1O2 generation process diagrams of AQCz and AQCzBr2. Adapted from ref. with permission from the Royal Society of Chemistry.
Fig. 37
Fig. 37. (a) Schematic representation of a TADF-based photosensitizer for the generation of 1O2. (b) Structure of the BCzSFB nanomolecule. (c) Computationally derived HOMO and LUMO distributions. Reproduced from ref. with permission from the Royal Society of Chemistry.
Fig. 38
Fig. 38. Illustration of the Type I PDT process. Reproduced from ref. with permission from American Chemical Society, Copyright © 2023.
Fig. 39
Fig. 39. Schematic representation of the TADF-based photocatalyst Zr(MesPDPPh)2 NPs and its use in PDT. Reproduced from ref. with permission from American Chemical Society, Copyright © 2023.
Fig. 40
Fig. 40. Molecular scaffold of NPs, absorption spectra of PEKB-244 and PEKB-064, and an illustration depicting PEKB-244 NP development and phototheranostic uses. Reproduced from ref. with permission from American Chemical Society, Copyright © 2023.
Fig. 41
Fig. 41. Determination of the 1O2 quantum yield of Pdot-PEG-B: (A) diagram illustrating the photoexcitation of the Pdots and the subsequent degradation of an anthracene-based chemical acceptor (ABMM); (B) UV/vis spectra of a mixture of ABMM and Pdot-PEG-B in water after various irradiation times; (C) comparison of the first-order kinetics of ABMM degradation (λmax = 379 nm) in the presence of either Pdot-PEG-B or Rose Bengal. Reproduced from ref. , https://doi.org/10.1002/anie.202400712, under the terms of the CC BY 4.0 license, https://creativecommons.org/licenses/by/4.0/.
Fig. 42
Fig. 42. Synthesis of CrCz and ECrCz starting from 9H-carbazole: (i) 4F-Ph-CHO, K2CO3, N,N-dimethylformamide (DMF), 130 °C (ii) CH2(CN)2, EtOH, reflux; (iii) ethyl cyanoacetate, EtOH, reflux; (iv) 4-hydroxycoumarin, Ni–Np, EtOH.
Fig. 43
Fig. 43. Photocatalytic cycles of a typical PC with general donor D and acceptor A. Reproduced from ref. , https://doi.org/10.1039/D1CS00198A, under the terms of the CC BY-NC 3.0 license, https://creativecommons.org/licenses/by-nc/3.0/.
Fig. 44
Fig. 44. Jablonski-type graph along Morse potentials illustrating the photophysical mechanism in TADF molecules. Reproduced from ref. , https://doi.org/10.1039/D1CS00198A, under the terms of the CC BY-NC 3.0 license, https://creativecommons.org/licenses/by-nc/3.0/.
Fig. 45
Fig. 45. Jablonski diagram and potential photochemical pathways for excited states of luminescent compounds such as TADF materials. Reproduced from ref. , https://doi.org/10.1039/D1CS00198A, under the terms of the CC BY-NC 3.0 license, https://creativecommons.org/licenses/by-nc/3.0/.
Fig. 46
Fig. 46. Chemical scaffold of (A) 4CzIPN and (B) [Ir(dF(CF3)ppy)2(dtbbpy)]PF6.
Fig. 47
Fig. 47. Photocatalytic cycle comparison of redox and photophysical properties of 4CzIPN. Adapted from ref. , https://doi.org/10.1039/D1CS00198A, under the terms of the CC BY-NC 3.0 license, https://creativecommons.org/licenses/by-nc/3.0/.
Fig. 48
Fig. 48. of common visible light PCs. Reproduced from ref. , https://doi.org/10.1039/D1CS00198A, under the terms of the CC BY-NC 3.0 license, https://creativecommons.org/licenses/by-nc/3.0/.
Fig. 49
Fig. 49. of common visible light PCs. Reproduced from ref. , https://doi.org/10.1039/D1CS00198A, under the terms of the CC BY-NC 3.0 license, https://creativecommons.org/licenses/by-nc/3.0/.
Fig. 50
Fig. 50. The catalytic cycle for photoinduced oxidative decarboxylation via a radical addition mechanism.
Fig. 51
Fig. 51. The synthesis of arylhydroxylamines via photoredox catalysis. Reproduced from ref. with permission from Georg Thieme Verlag KG, Copyright © 2018.
Fig. 52
Fig. 52. Synthesis of γ-amino boronic esters.
Fig. 53
Fig. 53. 1,2-Amidoalkynylation of alkenes. Adapted from ref. with permission from John Wiley & Sons, Copyright © 2018, Wiley-VCH Verlag GmbH & Co. KGaA, Weinheim.
Fig. 54
Fig. 54. Derivatization of amino acids.
Fig. 55
Fig. 55. Hydrosilylation of alkene.
Fig. 56
Fig. 56. Reaction illustration for the functionalization of amines and amides.
Fig. 57
Fig. 57. Generalized cycle for group transfer in C–H functionalization and decarboxylation.
Fig. 58
Fig. 58. Synthetic approach for acetalation of alkynyl bromides.
Fig. 59
Fig. 59. Synthetic approach for the photocatalytic acetalation of alkynyl bromides.
Fig. 60
Fig. 60. Schemes for cyclization reactions involving photoinduced decarboxylation mechanism used to synthesize (A) functionalized cyclopropanes, (B) synthesis of intramolecularly alkylated arenes and (C) synthesis of 2-substituted piperazines.
Fig. 61
Fig. 61. Synthetic approach by oxidative decarboxylation of oxamic acids.
Fig. 62
Fig. 62. Oxidative decarboxylation of oxamic acids using photocatalysis.
Fig. 63
Fig. 63. Minisci reaction in the use of carboxylic acids in the presence of NAPs.
Fig. 64
Fig. 64. Nucleophilic fluorination of redox-active esters.
Fig. 65
Fig. 65. Detailed mechanism of nucleophilic fluorination of redox-active esters using a photocatalyst.
Fig. 66
Fig. 66. Examples of different photocatalytic reactions: (A) synthesis of aldehydes and ketones, (B) δ-fluorination, (C) dearomatization of indoles, (D) dearomatization of naphthalene, and (E) synthesis of 1,4-amino alcohols.
Fig. 67
Fig. 67. Photocatalytic formation of ketones and aldehydes in the presence of carboxylic acids.
Fig. 68
Fig. 68. Fluorination of carboxylic acid scaffolds in a photocatalytic reaction.
Fig. 69
Fig. 69. Non-dearomative and dearomative intramolecular [2 + 2] photocycloaddition reactions.
Fig. 70
Fig. 70. (A) TADF PC for cobalt-mediated allylations and (B) its proposed mechanism.
Fig. 71
Fig. 71. Investigated photocatalysis reactions including energy transfer, oxidative quenching, dual metallaphotocatalysis and reductive quenching via Ni(ii) cocatalyst.
Fig. 72
Fig. 72. (A) Oxidation of sulfide to sulfoxide via photocatalysis using white light. (B) Oxidation of sulfides via FL-DNS. (C) Photocatalytic mechanism of oxidation of sulfide into sulfoxide via FL-DNS.
Fig. 73
Fig. 73. (A) Reaction [2 + 2] cycloaddition. (B) Reaction scheme for disulfide–ene and (C) amination in the presence of IPTZ PCs. (D) Esterification, (E) etherification, and (F) generalized mechanism for energy transfer occurring in the Ni-catalyzed cross-coupling reaction.
Fig. 74
Fig. 74. (A–C) Optimizing Ni cross-coupling reactions (D) Ni-catalyzed amination through SACR-IPTZ with reduced loading of catalyst.
Fig. 75
Fig. 75. Production of α-fluoracrylates (226) via a redox photocatalytic process.
Fig. 76
Fig. 76. Participation of confined CMCCDs@SiO2 (ConCDs) in a metal-free photopolymerization following (a) an oxidative mechanism or (b) a reductive mechanism in an ATRP setup. (c) The addition of Cu2+ to ConCDs.
Fig. 77
Fig. 77. (A) Chemical structures of PAB, Me-PABCZ, and Me-PABDPA (B) EL characteristics of Me-PABCZ based OLEDs using different doping concentrations: current JVL characteristics; EQE–luminance curves; current efficiency–luminance–power efficiency curves; normalized EL spectra at 6 V.
Fig. 78
Fig. 78. The molecular structures of green emissive B/N type MR emitters and designed polycyclo-heteraborin MR-TADF materials BpIC-DPA and BpIC-Cz.
Fig. 79
Fig. 79. Synthetic route of CzDBA and tBuCzDBA and along with external quantum efficiency versus luminance electroluminescent spectra.
Fig. 80
Fig. 80. Different diboron-based D–A TADF systems.
Fig. 81
Fig. 81. (A) Device structure and energy level diagram. (B) EL spectra of devices A and D. (C) Luminance–voltage, current density–voltage, and (D) EQE–current density curves of devices A and D.
Fig. 82
Fig. 82. Characterization of OLED device with different thicknesses of inkjet printed tBuCzDBA film as the active layer (A) device architecture and energy level diagram of the prepared OLEDs (B) current density versus voltage, (C) luminance versus voltage, and (D) efficiency versus luminance characteristics.
Fig. 83
Fig. 83. Chemical structure of (A) device architecture and energy level diagram of the prepared OLEDs (B) current density versus voltage, (C) luminance versus voltage, and (D) current efficiency–luminance–power efficiency characteristics (CE–L–PE) (E) external quantum efficiency luminance plots (F) summary of the EQE versus EL peak wavelength and FWHM plots for the reported narrowband emissive TADF polymer OLEDs.
Fig. 84
Fig. 84. Green MR-TADF and its attachment with MR emitting moiety acts as a pendant to an acceptor triphenyltriazine and simultaneously embeds acceptor moiety into polycarbazole backbone.
Fig. 85
Fig. 85. Chemical structure and molecular design strategy of 3QCzBN.
Fig. 86
Fig. 86. Molecular design strategy of BN-Cz-based MR-TADF emitters and chemical structures of BN-R1, BN-R2 and BN-R3.
Fig. 87
Fig. 87. The energy levels, molecular structures in the device, and device performance. (a) energy levels of the device; (b) molecular structures; (c) EL spectra of the devices; (d) EQE–current density curves. (Inset) The images of the devices (left is DPS-m-bAc, and right is DPS-p-bAc).
Fig. 88
Fig. 88. Chemical representation and advantages of 4FICzBN and EQE electroluminescence characteristics of the material.
Fig. 89
Fig. 89. Chemical representation of Pd–B-2 and tetradentate Pd(ii) emitters.
Fig. 90
Fig. 90. Molecular representation and design concept of PICZ2F along with EL characteristics.
Fig. 91
Fig. 91. Chemical representation of MeBN and di-nuclear Au(ii) complexes (A) electroluminescence curve (B) CIEy coordinate vs. emission wavelength which indicates deep blue phosphorescent and MR-TADF OLEDs.
Fig. 92
Fig. 92. Chemical representation of different TADF emitters.
Fig. 93
Fig. 93. Diagram depicting the TTA upconversion process between the TADF photosensitizer DMACPDO (254) and the annihilator DPA (255). Adapted from ref. with permission from the Royal Society of Chemistry.
Fig. 94
Fig. 94. Molecular representation of 3,4′-SOAD (256).
Fig. 95
Fig. 95. Diagram showing room-temperature energy transfer mechanisms in device B1 without a CzDBA sensitizer. Schematic illustration of low-temperature energy transfer mechanisms in device B1 without a CzDBA sensitizer. Adapted from ref. , with the permission of AIP Publishing.
Fig. 96
Fig. 96. (A) Molecular structure of An-MCz (257a), An-MCz (257b), and An-tBCz (257c) (B) (a) PL decay curves of the films (b) diagram illustrating the electronic states and transitions of the molecules (c) a photograph of the films of the compounds produced by deposition on drop casting on FTO substrates (d) PL spectra with varying delays. Reproduced from ref. , https://doi.org/10.1021/acsaelm.4c00533, under the terms of the CC BY 4.0 license, https://creativecommons.org/licenses/by/4.0/.
Fig. 97
Fig. 97. (a) Molecular structure of o-BTH-DMF. (b) Theoretical calculations showing the HOMO and LUMO distributions of o-BTH-DMF. (c) UV-vis absorption and PL spectra along with phosphorescent spectra of o-BTH-DMF/PMMA doped thin film. (d and e) Delayed fluorescence lifetime measurements of o-BTH-DMF (d) nitrogen conditions and (e) oxygen conditions. (f) Simplified photophysical diagram illustrating the photophysical processes in o-BTH-DMF, including PF, DF, and phosphorescence. Reproduced from ref. with permission from American Chemical Society, Copyright © 2024.
Fig. 98
Fig. 98. Visible light-assisted charge extraction in high bandgap SrTiO3 through the integration of triplet sensitizer-emitter thin film. Reproduced from ref. with permission from American Chemical Society, Copyright © 2024.
Fig. 99
Fig. 99. (a) Absorption spectra of PVK:2CzPN, PVK:4CzPN, and PVK:4CzIPN blend films. (b) Molecular scaffolds of 2CzPN, 4CzPN, and 4CzIPN and device architecture. Reproduced from ref. © IOP Publishing. Reproduced with permission. All rights reserved.
Fig. 100
Fig. 100. Molecular structures of the employed materials.
Fig. 101
Fig. 101. (a) Diagram of the device structure and (b) energy level diagram in PBTTT-C14 polymer and 4CzIPN bulk heterojunction phototransistor. Reproduced from ref. with permission from John Wiley & Sons, Copyright © 2024, Wiley-VCH Verlag GmbH & Co. KGaA, Weinheim.
Fig. 102
Fig. 102. Molecular structures of four TADF molecules with ECL emission.
Fig. 103
Fig. 103. (a) Photographs for emission of light and emissions of light from DPA, 4CzIPN, rubrene and DBP-doped rubrene in simple ECL cells (b) ECL spectra from the simple-structured ECL cells. Reproduced from ref. with permission from Elsevier, Copyright © 2014.
Fig. 104
Fig. 104. Molecular representation of 2CzPN (29) and Ir(BT)2(acac) (262) along with the microfluidic ECL cell with a schematic cross-section. Reproduced from ref. , https://doi.org/10.5796/electrochemistry.23-00147, under the terms of the CC BY 4.0 license, https://creativecommons.org/licenses/by/4.0/.
Fig. 105
Fig. 105. (top) Diagram representing the process for the synthesis of ternary radial heterojunction microwires and (below) photoconductivity process in TCTA/PCBM/4CzIPN. Reproduced from ref. with permission from the Royal Society of Chemistry.
Fig. 106
Fig. 106. Synthetic route of micellar ensemble P-M, with the encasement of the block copolymer P by diphenyl-diacetylene monomer M to form oligodiacetylene trimers (P-T) and dimers (P-DT and P-DT2). Reproduced from ref. , https://doi.org/10.1039/C5SC04253D, under the terms of the CC BY 4.0 license, https://creativecommons.org/licenses/by/4.0/.
Fig. 107
Fig. 107. PL spectrum of OPC in the solid state before and after grinding. Reproduced from ref. with permission from John Wiley & Sons, Copyright © 2015, Wiley-VCH Verlag GmbH & Co. KGaA, Weinheim.
Fig. 108
Fig. 108. Chemical structure and photographs of the material in different states. Adapted from ref. with permission from the Royal Society of Chemistry.
Fig. 109
Fig. 109. Schematic diagram of a general LEEC device.
Fig. 110
Fig. 110. The chemical structure of the TADF compound superimposed on a photograph of its LEEC. Reproduced from ref. , https://doi.org/10.1021/acs.chemmater.5b03245, under the terms of the CC BY 4.0 license, https://creativecommons.org/licenses/by/4.0/.
Fig. 111
Fig. 111. Chemical structures of the TADF host (5), PD molecules (264–266), morphology modifier (267), and electrolyte (268) along with emission mechanisms in TADF-LEECs. Reproduced from ref. , https://doi.org/10.1038/s41598-017-01812-2, under the terms of the CC BY 4.0 license, https://creativecommons.org/licenses/by/4.0/.
Fig. 112
Fig. 112. Chemical structure of first-generation carbazole (Cz)-based ionic host material (270).
Fig. 113
Fig. 113. Voltammograms were recorded on thin films of the host compounds (a and b), the blend host (c), and the guest compounds (d–f), as identified in the insets. (g) Structure of three TADF guest emitters. (h) Energy levels of host and guest compounds. (i) Normalized absorbance of the guest compound (left y-axis) and normalized PL of the host (right y-axis) for various films. Reproduced from ref. , https://doi.org/10.1038/s41598-017-01812-2https://doi.org/10.1038/s41467-019-13289-w, under the terms of the CC BY 4.0 license, https://creativecommons.org/licenses/by/4.0/.
Fig. 114
Fig. 114. Molecular structure of CPC (271).
Fig. 115
Fig. 115. Chemical structure of phosphorescent complex 272 and APDC-DTPA (273).
Fig. 116
Fig. 116. (top) Chemical structure of tBuCAZ and (bottom) (a) peak EL intensity, (b) time-dependent brightness and (c) time-dependent voltage. Adapted from ref. with permission from Elsevier, Copyright © 2022.
Fig. 117
Fig. 117. Chemical structure of Pym-CZ (275a) and Pym-tBuCZ (276b).
Fig. 118
Fig. 118. (A) Normalized PL spectra of the three host systems and the normalized absorption spectra of the two MR-TADF emitters (B) electron energy diagram of the three host compounds and the two MR-TADF emitters (C) normalized EL spectra and (D) temporal evolution of luminance and the voltage of the host-free triphenylphosphine oxide (TPPO)-tBu-DiKTa LECs (0.5 wt%). (E) Normalized EL spectra and (F) temporal evolution of the luminance and the voltage of the host-free triphenylamine (TPA)-tBu-DiKTa LECs (0.5 wt%). Reproduced from ref. , https://doi.org/10.1002/agt2.571https://doi.org/10.1038/s41598-017-01812-2, under the terms of the CC BY 4.0 license, https://creativecommons.org/licenses/by/4.0/.
None
Ehsan Ullah Mughal
None
Syeda Fariha Kainat
None
Nafeesa Naeem
None
Amina Sadiq
None
Alaa S. Abd-El-Aziz
None
Saleh A. Ahmed

References

    1. Gao R. Kodaimati M. S. Yan D. Chem. Soc. Rev. 2021;50:5564–5589. - PubMed
    1. Armaroli N. Bolink H. J. Top. Curr. Chem. 2016;374:1–3. - PubMed
    1. Santra B. Pal S. Kanjilal A. ACS Appl. Opt. Mater. 2024;2:687–696.
    1. Hölsä J. Electrochem. Soc. Interface. 2009;18:42. - PMC - PubMed
    1. Mesaros A. Appl. Sci. 2023;13:11221.

LinkOut - more resources