. 2025 Mar 5:13:e18939.
doi: 10.7717/peerj.18939. eCollection 2025.

Determining population structure from k-mer frequencies

Affiliations

Determining population structure from k-mer frequencies

Yana Hrytsenko et al. PeerJ. .

Abstract

Background: Understanding population structure within species provides information on connections among different populations and how they evolve over time. This knowledge is important for studies ranging from evolutionary biology to large-scale variant-trait association studies. Current approaches to determining population structure include model-based approaches, statistical approaches, and distance-based ancestry inference approaches.

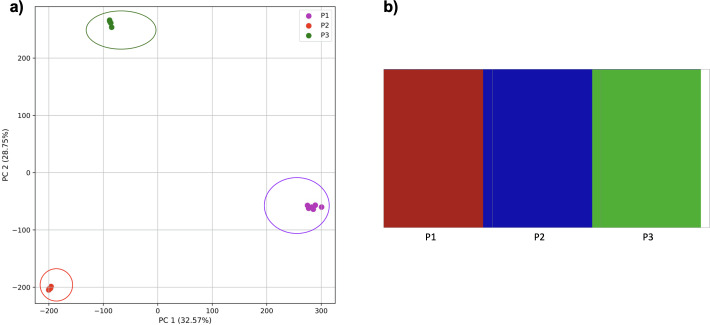
Methods: In this work, we identify population structure from DNA sequence data using an alignment-free approach. We use the frequencies of short DNA substrings from across the genome (k-mers) with principal component analysis (PCA). K-mer frequencies can be viewed as a summary statistic of a genome and have the advantage of being easily derived from a genome by counting the number of times a k-mer occurred in a sequence. In contrast, most population structure work employing PCA uses multi-locus genotype data (SNPs, microsatellites, or haplotypes). No genetic assumptions must be met to generate k-mers, whereas current population structure approaches often depend on several genetic assumptions and can require careful selection of ancestry informative markers to identify populations. We compare our k-mer based approach to population structure estimated using SNPs with both empirical and simulated data.

Results: In this work, we show that PCA is able to determine population structure just from the frequency of k-mers found in the genome. The application of PCA and a clustering algorithm to k-mer profiles of genomes provides an easy approach to detecting the number and composition of populations (clusters) present in the dataset. Using simulations, we show that results are at least comparable to population structure estimates using SNPs. When using human genomes from populations identified by the 1000 Genomes Project, the results are better than population structure estimates using SNPs from the same samples, and comparable to those found by a model-based approach using genetic markers from larger numbers of samples.

Conclusions: This study shows that PCA, together with the clustering algorithm, is able to detect population structure from k-mer frequencies and can separate samples of admixed and non-admixed origin. Using k-mer frequencies to determine population structure has the potential to avoid some challenges of existing methods and may even improve on estimates from small samples.

Keywords: Population differentiation; Population stratification; Population structure; k-mer frequencies; k-mers.


Conflict of interest statement

The authors declare there are no competing interests.

Figures

Figure 1
Figure 1. Evaluating cluster determination in superpopulations by K-means based on the number of PCs.
Comparison of (A) Scree plot showing the non-deterministic number of clusters (no “elbow point”) determined by K-means using 21 PCs (80% of the variance) from k-mer frequencies of five superpopulations. (B) Scree plot showing a deterministic number of clusters = 3 (“elbow point”) determined by K-means using 2 PCs (14.5% of the variance) from k-mer frequencies of five superpopulations.
Figure 2
Figure 2. PCA of human superpopulations based on k-mers.
PCA generated using k-mer frequencies from a single population from each of five human superpopulations. Samples are colored by population. K-means algorithm identified three clusters (circled) present in the data: two in Africa (AFR) and one including all other populations, Americas (AMR), East Asia (EAS), Europe (EUR), and South Asia (SAS).
Figure 3
Figure 3. Distinct superpopulation clusters in non-admixed superpopulations.
PCA generated using k-mer frequencies from four superpopulations of non-admixed origin (America (AMR), East Asia (EAS), Europe (EUR), South Asia (SAS), but excluding Africa (AFR)) using 2PCs. Samples are colored by population. K-means algorithm identified four clusters present in the data (circled).
Figure 4
Figure 4. Identification of distinct clusters on a superpopulation level and a single cluster on a population level.
(A) PCA generated using k-mer frequencies from four superpopulations (America (AMR), East Asia (EAS), Europe (EUR), South Asia (SAS)) including samples of single origin and multiple origin in EAS and EUR using 2PCs. Samples are colored by population. K-Means algorithm identified four clusters present in the data (circled). (B–D) fastStructure assignment of individuals to two populations with K = 2, 3, 4 respectively determined as optimal K by the chooseK method. (E) fastStructure assignment of individuals to a single population for K = 5.
Figure 5
Figure 5. Identification of clusters on a population level.
PCA generated using k-mer frequencies from the EAS superpopulation including samples of single and multiple origin (CDX, CHB, and JPT) using 2PCs. Samples are colored by population. K-means algorithm identified three clusters present in the data (circled) corresponding closely to the expected populations.
Figure 6
Figure 6. Identification of clusters on a population level in samples of single and multiple origins.
PCA generated using k-mer frequencies from the EUR superpopulation including samples of single and multiple origin (CEU, FIN, and TSI) using two PCs. Samples are colored by population. K-means algorithm identified three clusters present in the data (circles). Populations appear to separate along PC 1; however, K-means clustering differentiates the two single-origin populations (FIN and TSI) but mixes samples of CEU and TSI, as well as CEU and FIN.
Figure 7
Figure 7. Comparison of population stratification approaches using simulated data.
Comparison of population stratification approaches using three simulated populations loosely based on the human out-of-Africa population model of Gravel et al. (2011). (A) PCA generated using k-mer frequencies from samples. Samples are colored by simulated population. K-means algorithm accurately identified three clusters present in the data (circled) corresponding to the three simulated populations. (B) The same three populations accurately identified from SNPs using fastStructure. Samples are colored by the assigned population.
Figure 8
Figure 8. Comparison of population stratification approaches using simulated data with reduced time to population establishment.
Comparison of population stratification approaches three simulated populations loosely based on the human out-of-Africa population model of Gravel et al. (2011) as in Fig. 7; however, with reduced time between the establishment of the third population and sampling using simulations. (A) PCA generated using k-mer frequencies from samples. Samples are colored by population. K-means algorithm accurately identified three clusters present in the data (circled). (B) The same three populations accurately identified from SNPs using fastStructure. Samples are colored by the assigned population.
Figure 9
Figure 9. Comparison of population stratification approaches using simulated data with exponential growth of the populations after the establishment.
Comparison of population stratification approaches using three simulated populations loosely based on the human out-of-Africa population model of Gravel et al. (2011), with exponential growth in populations 2 and 3 following establishment. (A) PCA generated using k-mer frequencies from samples. Samples are colored by population. K-means algorithm inaccurately identified three clusters present in the data (circled), with one including populations 2 and 3 combined, and the other separating two groups from population 1. (B) Two populations identified from SNPs using fastStructure. fastStructure assigned population 2 (pop2) and population 3 (pop3), to the same population. Samples are colored by the assigned population while simulated populations are identified along the x axis.
Figure 10
Figure 10. Comparison of population stratification approaches using simulated data reflecting the effect of the exponential growth in populations.
Comparison of population stratification approaches using the simulated samples from the two populations clustered in Fig. 9. Because analysis of all three populations separated grouped populations 2 and 3 together, these populations were analyzed separately to determine whether they could be separated from each other when population 1 was excluded. (A) PCA generated using k-mer frequencies from samples. Samples are colored by population. K-means algorithm inaccurately identified three clusters present in the data (circled). (B) Two populations accurately identified from SNPs using fastStructure. Samples are colored by the assigned population.
Figure 11
Figure 11. Comparison of population stratification approaches using simulated data reflecting the effect of the mixed origin of a population.
Comparison of population stratification approaches using four simulated populations, where 1–3 are loosely based on the human out-of-Africa population model of Gravel et al. (2011), and population 4 originated as a mixture of populations 2 and 3. (A) PCA generated using k-mer frequencies from samples. Samples are colored by population. K-means algorithm identified either three or four clusters (based on the scree plot) present in the data (circled). (B) fastStructure identified either two or three clusters from SNPs. (C) In the two-population case, fastStructure assigned population 2 (pop2), population 3 (pop3), and population 4 (pop4), to the same population. In the three-population case, fastStructure assigned population 3 (pop3) and population 4 (pop4), to the same population. Samples are colored by the assigned population.
Figure 12
Figure 12. Comparison of population stratification approaches with simulated data reflecting effect of hybrid-origin population isolation.
Starting with two larger and one smaller population, the smaller population initially experienced migration from the larger, and this was then reduced. (A) PCA generated using k-mer frequencies from samples. Samples are colored by population. K-means algorithm accurately identified three clusters present in the data (circled). (B) Three populations identified from SNPs using fastStructure. Samples are colored by the assigned population.
Figure 13
Figure 13. Comparison of population stratification approaches with simulated data reflecting effect of increase in population migration.
Starting with two larger and one smaller population, the smaller population initially experienced migration from the larger, and this was then reduced (although to a lesser degree than Fig. 12). (A) PCA generated using k-mer frequencies. Samples are colored by population. K-means algorithm identified three clusters present in the data (circled), which corresponded closely, but not exactly, to expectation based on sampling origin. (B) In the three-population case, fastStructure mostly assigned populations correctly with one individual assigned incorrectly as in the PCA. (C) In the four-population case, fastStructure primary assigned individuals correctly, with one exception; additional population 1 was divided into two clusters. Samples are colored by the assigned population.
Figure 14
Figure 14. Comparison of population stratification approaches from simulated data reflecting effect of further increase in population migration.
Starting with two larger and one smaller population, the smaller population initially experienced migration from the larger, and this was then reduced (although to a lesser degree than Fig. 13). (A) PCA generated using k-mer frequencies from samples. Samples are colored by population. K-means algorithm identified three clusters present in the data (circled), but at this level of migration they did not correspond to sampling location. Under two- (B) and three-population (C) scenarios, admixed populations did not correspond to the original simulations using SNPs and fastStructure.
Figure 15
Figure 15. Heatmap plot showing variation in the ability of mash to detect monophyly of human superpopulations.
Phylogenies were built from pairwise mash distances for different k-mer length and sketch size parameters.

References

    1. Alexander DH, Novembre J, Lange K. Fast model-based estimation of ancestry in unrelated individuals. Genome Research. 2009;19:1655–1664. doi: 10.1101/gr.094052.109. - DOI - PMC - PubMed
    1. Alhusain L, Hafez AM. Nonparametric approaches for population structure analysis. Human Genomics. 2018;12:25. doi: 10.1186/s40246-018-0156-4. - DOI - PMC - PubMed
    1. Altshuler D, Donnelly P, The International HapMap Consortium A haplotype map of the human genome. Nature. 2005;437:1299–1320. doi: 10.1038/nature04226. - DOI - PMC - PubMed
    1. Andam CP, Challagundla L, Azarian T, Hanage WP, Robinson DA. Genetics and evolution of infectious diseases. Elsevier; 2017. Population structure of pathogenic bacteria; pp. 51–70. - DOI
    1. Andrews CA. Natural selection, genetic drift, and gene flow do not act in isolation in natural populations. Nature Education Knowledge. 2010;3:5.

LinkOut - more resources