

osl-ephys: a Python toolbox for the analysis of electrophysiology data
- PMID: 40061258
- PMCID: PMC11885225
- DOI: 10.3389/fnins.2025.1522675
osl-ephys: a Python toolbox for the analysis of electrophysiology data
Abstract
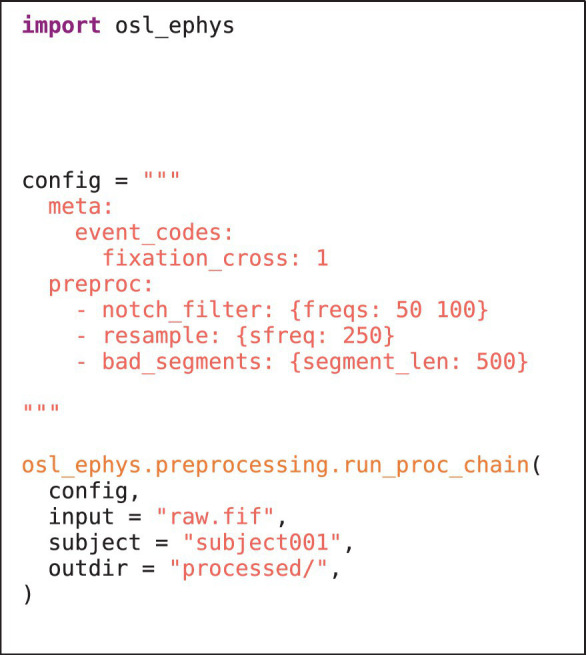
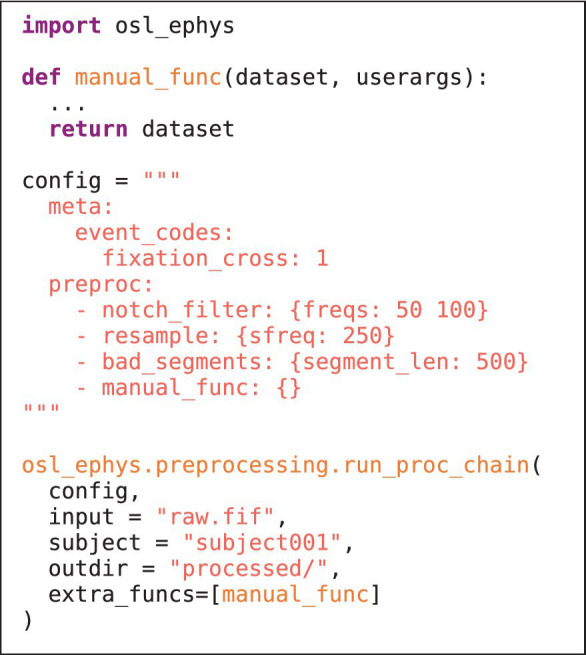
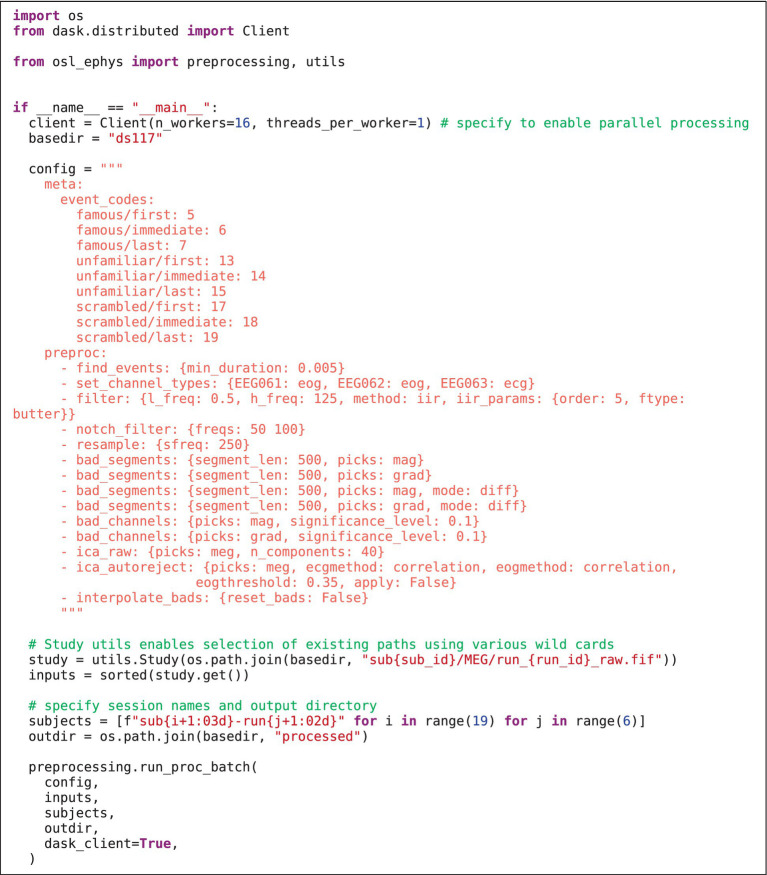
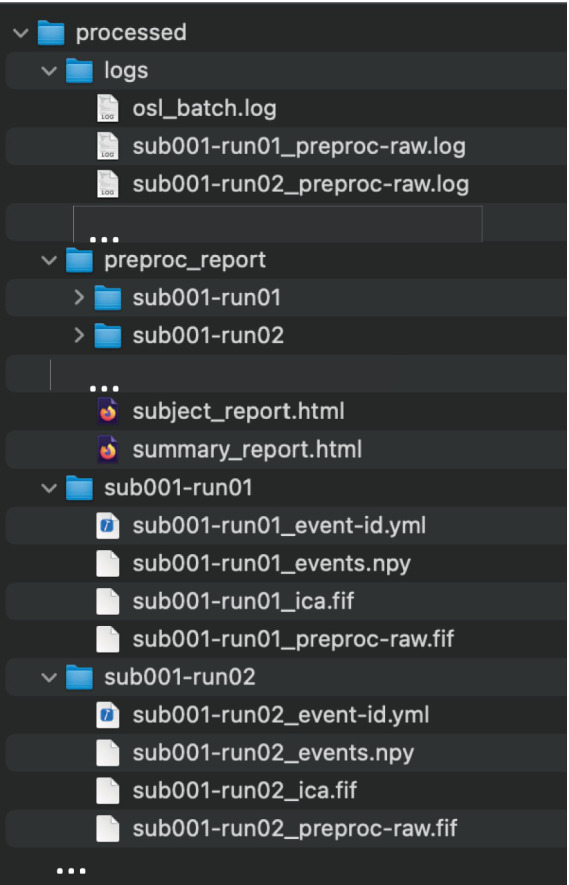
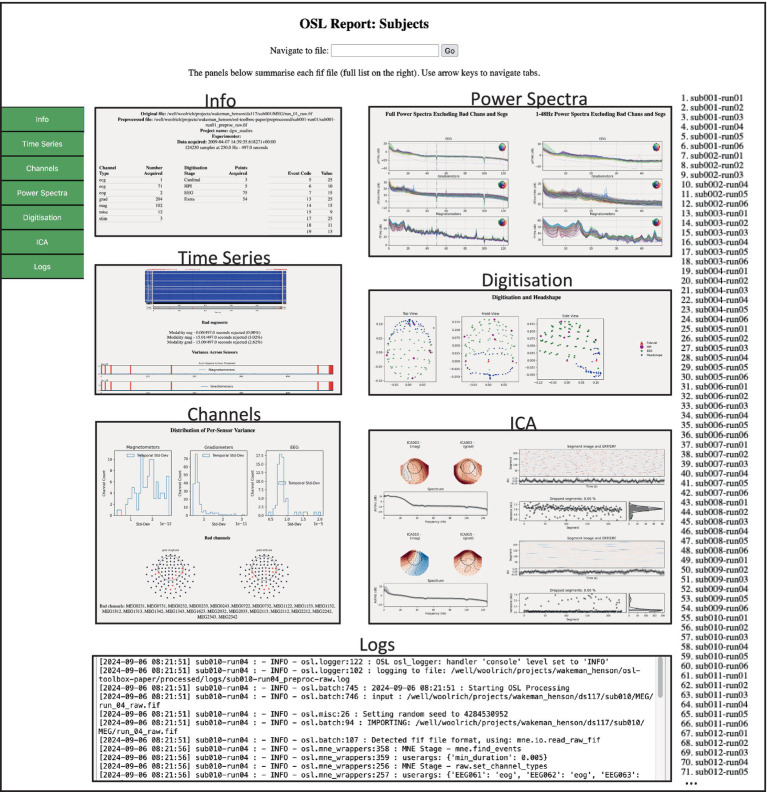
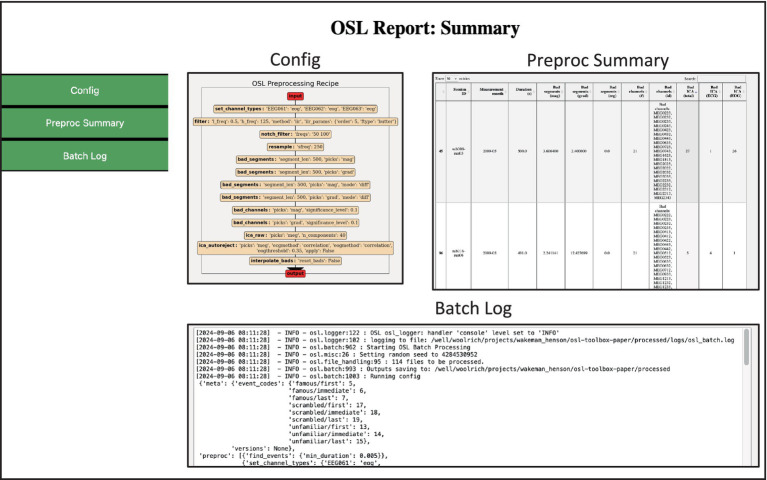
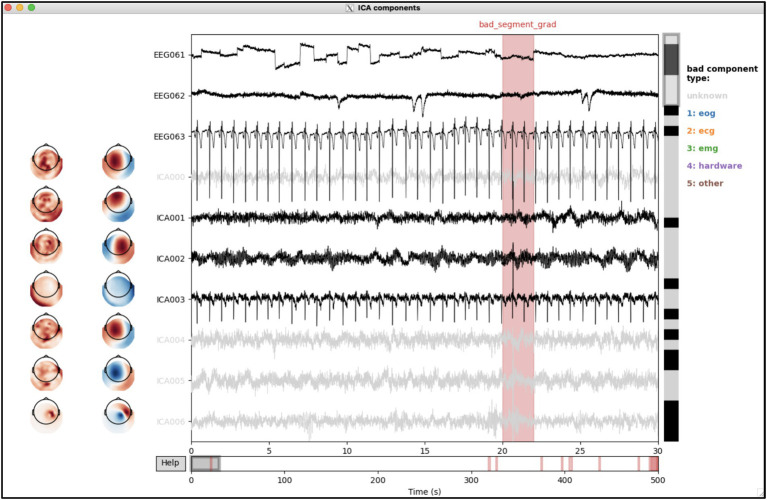
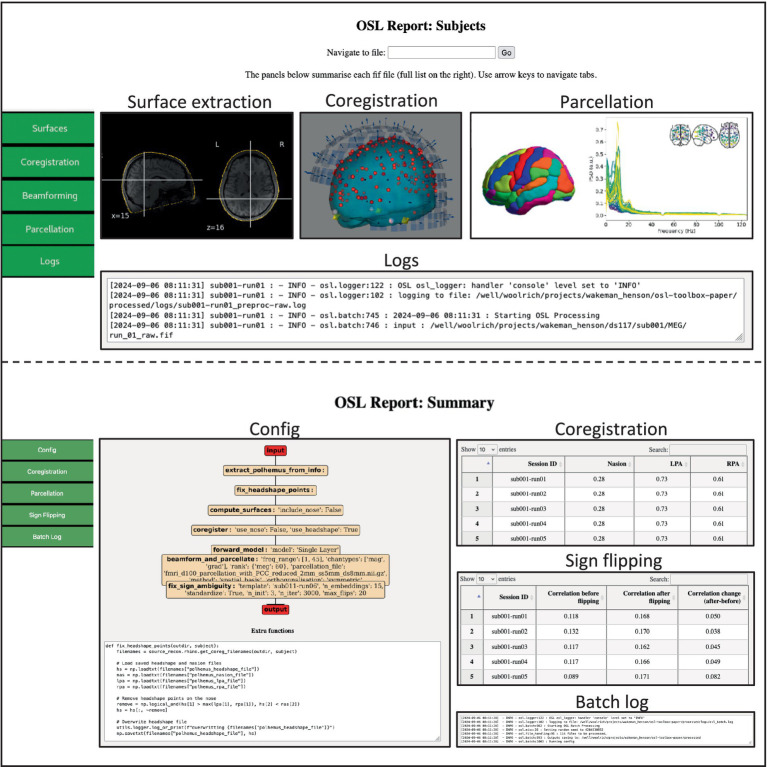
We describe OHBA Software Library for the analysis of electrophysiology data (osl-ephys). This toolbox builds on top of the widely used MNE-Python package and provides unique analysis tools for magneto-/electro-encephalography (M/EEG) sensor and source space analysis, which can be used modularly. In particular, it facilitates processing large amounts of data using batch parallel processing, with high standards for reproducibility through a config API and log keeping, and efficient quality assurance by producing HTML processing reports. It also provides new functionality for doing coregistration, source reconstruction and parcellation in volumetric space, allowing for an alternative pipeline that avoids the need for surface-based processing, e.g., through the use of Fieldtrip. Here, we introduce osl-ephys by presenting examples applied to a publicly available M/EEG data (the multimodal faces dataset). osl-ephys is open-source software distributed on the Apache License and available as a Python package through PyPi and GitHub.
Keywords: M/EEG; MNE-Python; analysis; electroencephalography (EEG); electrophysiology; magnetoencephalography (MEG); python; toolbox.
Copyright © 2025 van Es, Gohil, Quinn and Woolrich.
Conflict of interest statement
The authors declare that the research was conducted in the absence of any commercial or financial relationships that could be construed as a potential conflict of interest.
Figures
Similar articles
-
NeuroPycon: An open-source python toolbox for fast multi-modal and reproducible brain connectivity pipelines.Neuroimage. 2020 Oct 1;219:117020. doi: 10.1016/j.neuroimage.2020.117020. Epub 2020 Jun 6. Neuroimage. 2020. PMID: 32522662
-
MEG and EEG data analysis with MNE-Python.Front Neurosci. 2013 Dec 26;7:267. doi: 10.3389/fnins.2013.00267. eCollection 2013 Dec 26. Front Neurosci. 2013. PMID: 24431986 Free PMC article.
-
Open Ephys electroencephalography (Open Ephys + EEG): a modular, low-cost, open-source solution to human neural recording.J Neural Eng. 2017 Jun;14(3):035002. doi: 10.1088/1741-2552/aa651f. Epub 2017 Mar 7. J Neural Eng. 2017. PMID: 28266930 Free PMC article.
-
Systems Neuroscience Computing in Python (SyNCoPy): a python package for large-scale analysis of electrophysiological data.Front Neuroinform. 2024 Nov 20;18:1448161. doi: 10.3389/fninf.2024.1448161. eCollection 2024. Front Neuroinform. 2024. PMID: 39635648 Free PMC article.
-
A Reproducible MEG/EEG Group Study With the MNE Software: Recommendations, Quality Assessments, and Good Practices.Front Neurosci. 2018 Aug 6;12:530. doi: 10.3389/fnins.2018.00530. eCollection 2018. Front Neurosci. 2018. PMID: 30127712 Free PMC article.
Cited by
-
Distinct Alpha Networks Modulate Different Aspects of Perceptual Decision-Making.bioRxiv [Preprint]. 2025 Mar 14:2025.03.14.643170. doi: 10.1101/2025.03.14.643170. bioRxiv. 2025. PMID: 40161801 Free PMC article. Preprint.
References
-
- Ågren W. (2023). Neurocode. Available at: https://github.com/neurocode-ai/neurocode/tree/main?tab=MIT-1-ov-file (Accessed February, 2025).
-
- Brodbeck C., Das P., Brooks T. L., Reddigari S. (2023). Eelbrain. Available at: https://pypi.org/project/eelbrain/ (Accessed February 2025).
-
- Dask Development Team (2016). Dask: library for dynamic task scheduling. Available at: http://dask.pydata.org (Accessed February, 2025).
LinkOut - more resources
Full Text Sources