Early Detection of Ventilator-Associated Pneumonia in a Neurosurgical Patient: Do Biomarkers Help Us?
- PMID: 40062056
- PMCID: PMC11888789
- DOI: 10.7759/cureus.78567
Early Detection of Ventilator-Associated Pneumonia in a Neurosurgical Patient: Do Biomarkers Help Us?
Abstract
Background: Ventilator-associated pneumonia (VAP) remains a significant complication in patients undergoing mechanical ventilation. It is particularly prevalent in neurosurgical patients, contributing to high morbidity and healthcare costs. Early diagnosis and timely treatment are crucial for preventing the progression of VAP. However, diagnosing VAP remains challenging because no diagnostic tool or biomarker can reliably confirm the condition. Nevertheless, biomarkers remain the most frequently used surrogates for VAP. Therefore, this study aimed to evaluate the predictive value of interleukin-6 (IL-6), procalcitonin (PCT), and C-reactive protein (CRP) and look at relevant clinical markers for the early detection of VAP. Additionally, the impact of the use of IL-6 or PCT/CRP on clinical decision-making in the diagnosis and management of VAP in neurosurgical patients was explored.
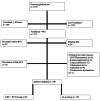
Methods: In this retrospective single-center study, we screened 1,817 neurosurgical intensive care patients between January 2020 and December 2023. In the first step, the ability of IL-6, PCT, and CRP to predict VAP was tested. We distinguished microbiologically confirmed VAP (mcVAP), suspected VAP (suspVAP ), and non-VAP. In the second step, two cohorts were compared: patients monitored with IL-6 alone and those monitored with PCT and CRP. Here, we compared the relevance of these markers for treatment decisions, antibiotic usage, and clinical parameters.
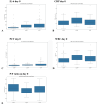
Results: A total of 240 neurosurgical patients fulfilled the eligibility criteria: 155 in the IL-6 group and 85 in the PCT/CRP group. The IL-6 level on the day of mcVAP and suspVAP was 106 pg/mL (IQR: 58.3-259.0) and 112 pg/mL (IQR: 58.3-259), respectively, whereas it was 33.55 ng/L (IQR: 19.6-59.2) in non-VAP patients (p<0.001; η² = 0.14, AUC 0.82 and 0.81, respectively). PCT also showed significant differences, although with a small effect size (η² = 0.008, p = 0.010). For CRP, no significant differences were observed (p = 0.317). In the IL-6 group, the start of treatment did not differ from that in the PCT/CRP group. The duration of antibiotic administration was slightly shorter in the IL-6 group than in the control group, although the differences were not statistically significant (6.25 (±3.73) and 5.9 (±2.23) days versus 7.37 (±4.95) and 7.67 (±2.65) days; p = 0.339 and p = 0.214, respectively).
Conclusion: While PCT has diagnostic value, IL-6 has superior predictive value for VAP, which is reflected in its high effect size and shorter duration of antibiotic treatment, although the difference was not significant. This study suggests that incorporating IL-6 as a routine biomarker may improve the early recognition of VAP, potentially optimizing treatment strategies in the neurosurgical ICU setting. However, the major limitation lies in the study's retrospective design, which limits its generalizability.
Keywords: interleukin (il)-6; neurosurgical intensive care unit; procalcitonin (pct); serum biomarkers; ventilator-associated pneumonia (vap).
Copyright © 2025, Bexten et al.
Conflict of interest statement
Human subjects: Consent for treatment and open access publication was obtained or waived by all participants in this study. Ethics Committee II of Heidelberg University, Medical Faculty Mannheim; Chairperson: Prof. Dr. Med. Harald Klüter issued approval 2022-839. Animal subjects: All authors have confirmed that this study did not involve animal subjects or tissue. Conflicts of interest: In compliance with the ICMJE uniform disclosure form, all authors declare the following: Payment/services info: All authors have declared that no financial support was received from any organization for the submitted work. Financial relationships: All authors have declared that they have no financial relationships at present or within the previous three years with any organizations that might have an interest in the submitted work. Other relationships: All authors have declared that there are no other relationships or activities that could appear to have influenced the submitted work.
Figures


References
-
- Attributable mortality of ventilator-associated pneumonia: a meta-analysis of individual patient data from randomised prevention studies. Melsen WG, Rovers MM, Groenwold RH, et al. Lancet Infect Dis. 2013;13:665–671. - PubMed
-
- Attributable mortality of ventilator-associated pneumonia: respective impact of main characteristics at ICU admission and VAP onset using conditional logistic regression and multi-state models. Nguile-Makao M, Zahar JR, Français A, et al. Intensive Care Med. 2010;36:781–789. - PubMed
-
- Outcome and attributable cost of ventilator-associated pneumonia among intensive care unit patients in a suburban medical center. Warren DK, Shukla SJ, Olsen MA, et al. Crit Care Med. 2003;31:1312–1317. - PubMed
-
- Health care-associated infections: a meta-analysis of costs and financial impact on the US health care system. Zimlichman E, Henderson D, Tamir O, et al. JAMA Intern Med. 2013;173:2039–2046. - PubMed
LinkOut - more resources
Full Text Sources
Research Materials
Miscellaneous
