. 2025 May 5;222(5):e20241148.
doi: 10.1084/jem.20241148. Epub 2025 Mar 10.

Transient inhibition of type I interferon enhances CD8+ T cell stemness and vaccine protection

Affiliations

Transient inhibition of type I interferon enhances CD8+ T cell stemness and vaccine protection

Benjamin J Broomfield et al. J Exp Med. .

Abstract

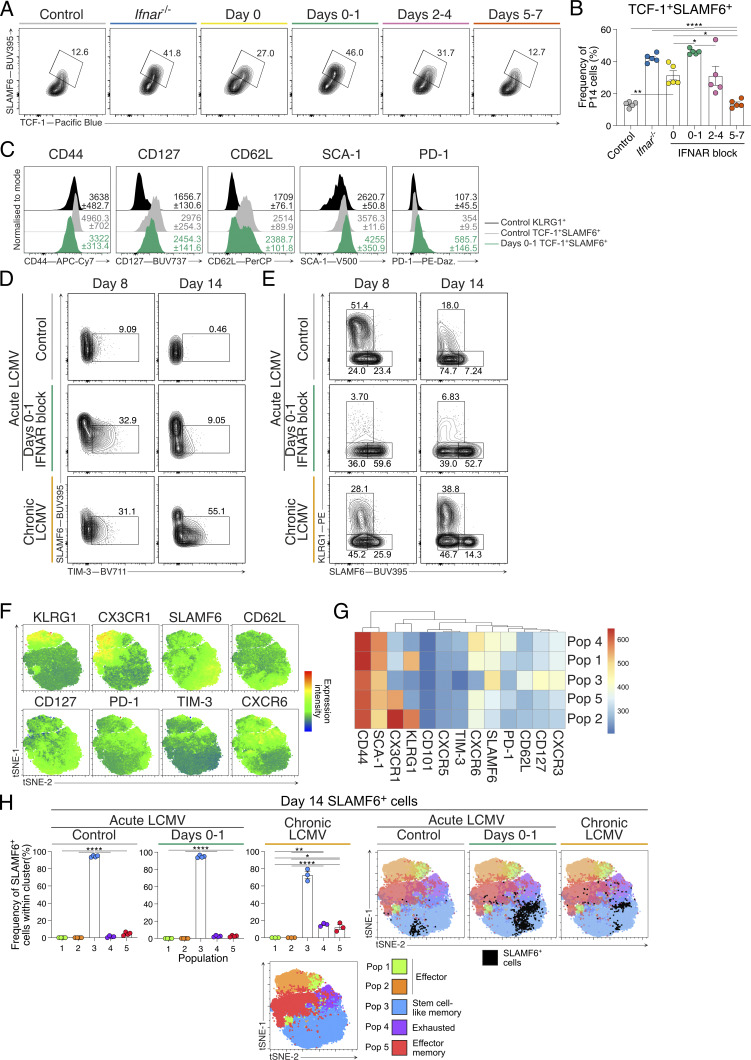
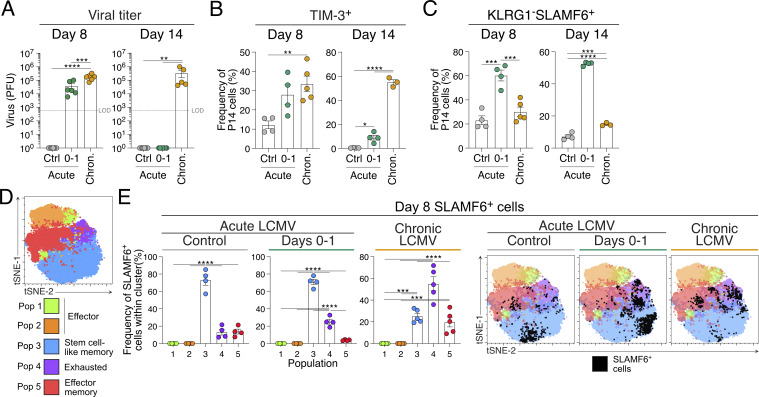
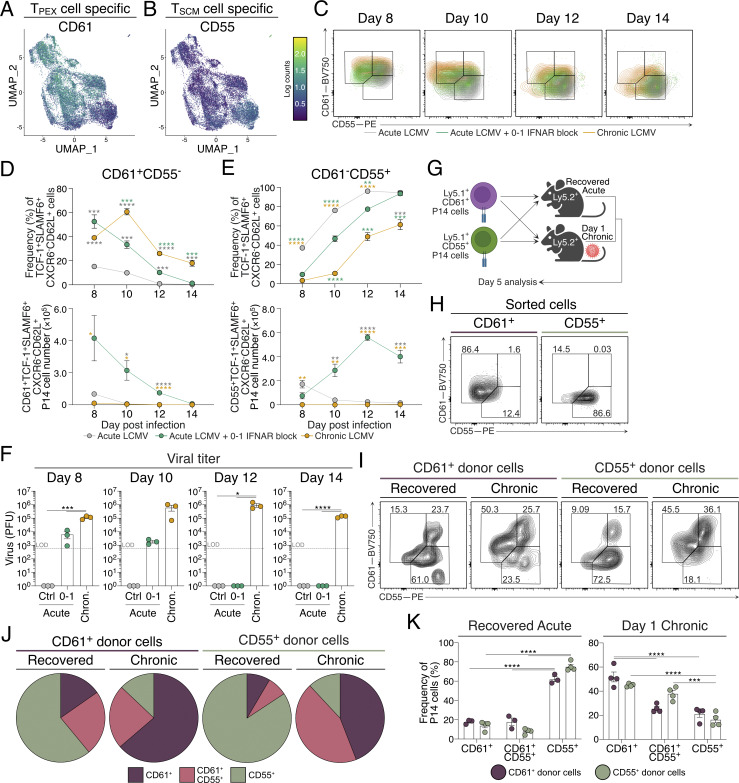
Developing vaccines that promote CD8+ T cell memory is a challenge for infectious disease and cancer immunotherapy. TCF-1+ stem cell-like memory CD8+ T (TSCM) cells are important determinants of long-lived memory. Yet, the developmental requirements for TSCM cell formation are unclear. Here, we identify the temporal window for type I interferon receptor (IFNAR) blockade to drive TSCM cell generation following viral infection and mRNA-lipid nanoparticle vaccination. We reveal a reversible developmental trajectory where transcriptionally distinct TSCM cells emerged from a transitional precursor of exhausted T cellular state concomitant with viral clearance. TSCM cell differentiation correlated with T cell retention within the lymph node paracortex due to disrupted CXCR3 chemokine gradient formation. These effects were linked to increased antigen load and a counterintuitive increase in IFNγ, which controlled cell location. Vaccination with the IFNAR blockade promoted TSCM cell differentiation and enhanced protection against chronic infection. These findings propose an approach to vaccine design whereby modulation of inflammation promotes memory formation and function.


Conflict of interest statement

Disclosures: W.J. Moon reported being employed by Acuitas Therapeutics, company developing LNP delivery systems for mRNA therapeutics. J.R. Groom reported a patent to AU2023901721 pending “WEHI.” No other disclosures were reported.

Figures

Figure 1.
Figure 1.
IFNAR blocking at d0–1 of acute LCMV infection directs stem-like T cell differentiation. (A–E) Analysis of P14 cells generated in groups indicated in A. Data are representative of two independent experiments with five mice per group in each experiment. Each dot in C–E represents a single mouse. Data are the mean ± SEM. Statistical differences were analyzed using one-way ANOVA tests. (A) Experimental scheme. P14 cells were transferred into wild-type hosts prior to infection with acute LCMV Armstrong and treated with indicated schedules (d0, d0–1, d2–4, d5–7) of IFNAR blocking monoclonal antibodies. Peripheral lymph node P14 cells were analyzed at d8 of infection. (B) Representative flow cytometry plots of P14 cells showing KLRG1+TCF-1 effector T (TEFF) and KLRG1TCF-1+ stem-like T cell populations. (C) Graphs summarizing frequencies in B. (D) Graphs summarizing total P14 cell numbers of TEFF and stem-like T cell subsets. (E) Graph summarizing total P14 cell number of TCF-1+SLAMF6+ stem-like T cells as shown in Fig. S1 A. (F and G) IFNAR detection of peripheral lymphocytes following acute LCMV infection and IFNAR blocking as indicated, or control Ifnar−/− hosts. Data are representative of three independent experiments with four mice per group in each experiment. Average geometric mean fluoresence intensity (gMFI) ± SEM for each group are indicated. (F) Representative histograms of IFNAR expression. (G) Graph summarizing IFNAR gMFI. Statistical differences were analyzed using one-way ANOVA tests. The dashed line indicates anti-IFNAR staining LOD. *P < 0.05, **P < 0.01, ***P < 0.001, ****P < 0.0001. Fig. S1 shows additional supporting data. LOD, limit of detection.
Figure S1.
Figure S1.
IFNAR blocking at d0–1 of acute LCMV infection directs stem-like T cell differentiation without establishing chronic infection and exhaustion. Related to Figs. 1 and 2. (A–C) P14 cells generated in groups indicated in Fig. 1 A. Data are representative of two independent experiments with five mice per group in each experiment. Each dot in B represents a single mouse. Data are the mean ± SEM. Statistical differences were analyzed using one-way ANOVA tests. Data are representative of three independent experiments with four mice per group in each experiment. Average gMFI ± SEM for each graph are indicated. (A) Representative plots of P14 cells showing stem-like (TCF-1+SLAMF6+) T cell populations. (B) Graph summarizing frequencies in A. (C) Representative histograms of TEFF (KLRG1+; black histograms) and stem-like (TCF-1+SLAMF6+; gray histograms) P14 cell populations from treated control mice and stem-like (TCF-1+SLAMF6+; green histograms) P14 cells from d0–1 IFNAR-blocked mice for expression of CD44, CD127, CD62L, SCA-1, and PD-1. (D–H) Analysis of P14 cells from peripheral lymph nodes of mice at d8 or d14 of acute LCMV Armstrong with or without IFNAR block at d0–1, or chronic LCMV Docile infection. Data are representative of three independent experiments with four mice per group in each experiment. Each dot in H represents a single mouse. Data are the mean ± SEM. Statistical differences were analyzed using one-way ANOVA tests. (D) Representative plots of TIM-3 expression on P14 cells within each infection condition. (E) Representative flow cytometry plots of TEFF (KLRG1+SLAMF6) and stem-like (KLRG1SLAMF6+) T cell populations within P14 cells from each group. (F) Overlay of marker expression heat maps on t-distributed stochastic neighbor embedding (tSNE) plot generated by FlowSOM. (G) FlowSOM heat map determining distinction of discreet populations. (H) Frequency of each FlowSOM population within d14 SLAMF6+ P14 cells for each infection condition, and corresponding representative overlay of SLAMF6+ P14 cells displayed in tSNE plots. *P < 0.05, **P < 0.01, ****P < 0.0001.
Figure 2.
Figure 2.
Early IFNAR blocking skews stem-like T cell differentiation without establishing chronic infection and exhaustion. (A–E) Analysis of P14 cells at d8 or d14 of acute LCMV infection, with or without IFNAR blocking at d0–1, or chronic LCMV Docile infection. Data are representative of three independent experiments with three to six mice per group in each experiment. Each dot in A–C and E represents a single mouse. Data are the mean ± SEM. Statistical differences were analyzed using one-way ANOVA tests. (A) Graphs summarizing the PFU from viable virus in spleens of mice in each infection condition. The dashed line indicates viral plaque LOD. (B) Graphs summarizing average frequencies of TIM-3 expression on P14 cells in each indicated group. (C) Graphs summarizing frequencies of stem-like cell populations within P14 cells in each group. (D and E) FlowSOM dimensionality reduction analysis of P14 cells generated in each infection condition. (D) FlowSOM dimensionality reduction analysis. tSNE plot displaying five FlowSOM-defined cell populations and denoted identities generated from differential surface antigen expression. (E) Frequency of each FlowSOM population within d8 SLAMF6+ P14 cells for each infection condition, and corresponding representative overlay of SLAMF6+ P14 cells displayed in tSNE plots. **P < 0.01, ***P < 0.001, ****P < 0.0001. Fig. S1 shows additional supporting data. LOD, limit of detection.
Figure 3.
Figure 3.
Early IFNAR inhibition promotes transitional T PEX cell formation prior to establishing the T SCM cell population. (A–H) scRNAseq analysis of 17629 P14 cells from peripheral lymph nodes at d8 acute LCMV, d8 chronic LCMV, and d8 and d14 IFNAR-blocked acute LCMV infection conditions. Data show three to four biological replicates per condition. (A and B) UMAPs of CD8+ T cells (A) based on infection condition and (B) prominence of each condition per cluster. (C) Module scores of TSCM-, TPEX-, and TEX-associated genes in prominent populations from each condition. (D) Normalized mean expression heat map of classed marker genes in selected clusters, normalized as z-scored log counts across conditions. (E and F) NES plots of enrichment of (E) TPEX cell, exhausted progenitor (TPROG) cell, and TEX cell gene programs from published datasets, and (F) enrichment of hallmark Wnt signaling and stemness signatures. (G) Venn diagram reflecting distinct and intersecting GEX in selected clusters. (H) MA plot of log fold change versus mean expression between C2 (comprising cells from chronic LCMV and d8 IFNAR-blocked acute LCMV) and C0+C8 (comprising cells from d14 IFNAR-blocked acute LCMV and control acute LCMV). Marked genes represent intersections of the Venn diagram in G, genes shared by each cluster (green), genes shared in C2 (orange), genes shared in C0+C8 (purple). DE genes identified in G came from analysis using the voom-limma pipeline with duplication correlation and P <0.05. *P < 0.05, **P < 0.01, ***P < 0.001, ****P < 0.0001. Fig. S2 shows additional supporting data. HSC-LT, long-term hematopoietic stem cells. YF, Yellow Fever.
Figure S2.
Figure S2.
Application of novel surface markers CD61 and CD55 to track the reversible transition of T PEX to T SCM cells. Related to Figs. 3 and 4. (A–D) Sequencing analysis of P14 cells as described and clustered in Fig. 3 A. (A) Anchor genes and reference list used to define TSCM, TPEX, and TEX cell states. (B) Module scores of TSCM, TPEX, and TEX cell genes within each defined cluster. Prominent clusters in each experimental setting are indicated with arrows. Clusters without arrows indicate clusters comprised of mixed conditions (as in Fig. 3 B). (C) Normalized mean expression heat map of key marker genes in selected clusters. (D) Pearson’s correlation analysis of all genes expressed in pseudobulk samples from indicated clusters and conditions. Each row/column is an independent biological replicate. (E) Surface protein sequencing analysis of P14 cells as described in Fig. 3. Surface expression of CD62L and CXCR6 on UMAPs of CD8+ T cells. (F–J) Analysis of CD61 and CD55 markers on the surface of antigen-specific CD8+ T cells from d8 to d14 of acute LCMV with or without d0–1 IFNAR block, and chronic LCMV infection. Data are representative of three independent experiments with three mice per infection setting per time point. Each dot in G–K represents a single mouse. Data are the mean ± SEM. Statistical differences were analyzed using a one-way ANOVA test. (F) Gating strategy to identify TCF-1+SLAMF6+CXCR6CD62L+CD61+CD55 TPEX cells and TCF-1+SLAMF6+CXCR6CD62L+CD61CD55+ TSCM cells. Pre-gated on P14 cells. (G and H) Graphs summarizing frequencies of (G) CD61+ TPEX and (H) CD55+ TSCM cells throughout infection. (I and J) Graphs summarizing the cell numbers of (I) CD61+ TPEX and (J) CD55+ TSCM cells throughout infection. (K and L) Surface protein expression frequency (left panels) and gMFI (right panels) on CD61+ TPEX and CD55+ TSCM cells. Data are the mean ± SEM. Data are representative of three independent experiments with three mice per group. Statistics was determined by unpaired t tests. (K) Frequency and gMFI of PD-1 and TIM-3 on CD61+ TPEX cells. (L) Frequency and gMFI of PD-1 and TIM-3 on CD55+ TSCM cells. Data are the mean ± SEM. Data are representative of three independent experiments with three to four mice per group. *P < 0.05, **P < 0.01, ***P < 0.001, ****P < 0.0001.
Figure 4.
Figure 4.
Identification of novel cell surface markers to identify transitional stem-like CD8 + T cell states that align with antigen load. (A and B) Surface protein sequencing analysis of P14 cells as described in Fig. 3. (A) Surface expression of CD61 on UMAPs of CD8+ T cells. (B) Surface expression of CD55 on UMAPs of CD8+ T cells. (C–E) Flow cytometry analysis of P14 cell frequency and numbers at d8 to d14 of acute LCMV, with or without IFNAR blocking at d0–1, or chronic LCMV infection. Data are representative of two independent experiments with three mice per infection setting per time point. Data are the mean ± SEM. Statistical differences were analyzed using a one-way ANOVA test. (C) Overlayed representative flow cytometry plots from d8 to d14 in each experimental group. (D and E) Graphs summarizing the frequencies and total cell numbers of (D) CD61+CD55 (TPEX) and (E) CD61CD55+ (TSCM) cells throughout each infection condition. Each cell population was pre-gated on TCF-1+SLAMF6+CXCR6CD62L+ P14 cells as shown in Fig. S2 F. (F) Graphs summarizing the PFU from viable virus in spleens of mice in each infection condition over the time course. The dashed line indicates viral plaque LOD. (G–K) Isolation, adoptive cell transfer, and analysis of CD61+ TPEX and CD55+ TSCM cell surface marker expression in either antigen-free or antigen-rich host mice. Data are representative of three independent experiments with three to four mice per group. Each dot in F and K represents a single mouse. Data are the mean ± SEM. Statistical differences were analyzed using a one-way ANOVA test. (G) Experimental scheme. CD61+ TPEX and CD55+ TSCM cells were sorted from d8 chronic LCMV– and day 10 acute LCMV–infected mice, respectively. Isolated cells were individually transferred into either recovered (from acute infection, antigen-free) or d1 chronically infected host mice. Mice were maintained for 5 days before subsequent cell surface marker analysis. (H) Flow cytometry plots analyzing the expression of CD61 and CD55 on sorted single-positive cell populations prior to adoptive cell transfer. (I) Representative flow cytometry plots of CD61+ and CD55+ donor T cells isolated from host mice 5 days following cell transfer. (J) Graphs summarizing the frequencies of CD61+CD55 TPEX, CD61+CD55+, and CD61CD55+ TSCM cells shown in I. (K) Pie charts summarizing I and J. *P < 0.05, **P < 0.01, ***P < 0.001, ****P < 0.0001. Fig. S2 shows additional supporting data. LOD, limit of detection.
Figure 5.
Figure 5.
IFNAR blocking increases DC expression of CXCR3 ligands following immune challenge. (A–C) Analysis of intrinsic IFNAR signaling on the differentiation of CD8+ T cells. Data are representative of two individual experiments with five mice in each group. Each dot in C represents a single mouse. (A) Experimental scheme. Wild-type or Ifnar−/− P14 cells were transferred into Ifnar−/− host mice prior to acute LCMV infection and analysis at d8. (B) Representative flow cytometry plots. (C) Average frequency ± SEM of TSCM cell populations. (D–G) REX3 reporter expression in cDC1, cDC2, and moDC populations during acute LCMV infection in control and d0–1 IFNAR-blocked mice. Data are representative of three individual experiments with three to four mice in each group in each experiment. Data are the mean ± SEM. (D and F) (D) d4 and (F) d8 post infection representative plots showing Cxcl9-RFP and Cxcl10-BFP reporter expression in indicated DC subsets. (E and G) Graphs summarizing graded frequencies of Cxcl9-RFP and Cxcl10-BFP expression from D and F, respectively. Graded expression summarized in key. (H) LSFM micrographs of intact REX3 lymph nodes at d8 of acute LCMV infection in control and d0–1 IFNAR-blocked conditions. Images are 200-μm longitudinal slices through the lymph node center. Scale bars represent 100 μm. The dashed line indicates the lymph node outline. Pseudocolor FIRE LUT heat maps for each REX3 reporter (left and middle panels). Merged images (right panels) show Cxcl9-RFP (magenta), Cxcl10-BFP (cyan), B220 (B cells; yellow), and CD31 (vessels; white). Images are representative of two individual experiments with four mice in each group in each experiment. (I) Detection of CXCL9 and CXCL10 protein staining in cDC1, cDC2, and moDC populations at d4 of acute LCMV infection. Graphs show average gMFI ± SEM. The dashed line indicates chemokine protein detection in indicated DC subsets from Cxcl9−/− and Cxcl10−/− mice. Data are representative of three individual experiments with at least three mice in each group in each experiment. Each dot represents a single mouse. Statistics was determined using unpaired t tests. *P < 0.05, **P < 0.01, ***P < 0.001. Fig. S3 shows additional supporting data.
Figure S3.
Figure S3.
DC gating strategy and increased CXCR3 ligand expression and T SCM cell differentiation during live and heat-inactivated acute LCMV infection following IFNAR blocking. Related to Fig. 5. (A) Gating strategy to identify cDC1, cDC2, and moDC cell populations. Colored boxes indicate the final gate and REX3 expression for each subset. (B) Frequency and total cell number of Cxcl9-RFP+ and Cxcl10-BFP+ DC subsets at d4 and d8 after LCMV Armstrong infection. Data are representative of three individual experiments with three to four mice in each group. Data are the mean ± SEM. Each dot represents a single sample. Statistical differences were analyzed using unpaired t tests. (C) Images from Fig. 5 H. LSFM micrographs of intact REX3 lymph nodes at d8 of infection in control and d0–1 IFNAR-blocked conditions. Images are 200-µm longitudinal slices through the lymph node center. Scale bars represent 100 µm. The dashed line indicates the lymph node outline. Individual REX3 reporters and merge images show Cxcl9-RFP (magenta) and Cxc10-BFP (cyan). Images are representative of three individual experiments with at least four mice in each group in each experiment. (D and E) Analysis of Cxcl9-RFP and Cxcl10-BFP expression in DC subsets within peripheral lymph nodes of mice at d8 following challenge with either live or heat-inactivated (inactive) LCMV Armstrong. Half of each group received d0–1 treatments of IFNAR block. Data are representative of three individual experiments with three mice per group per experiment. Data are the mean ± SEM. (D) Graphs summarizing the graded frequencies of Cxcl9-RFP+ and Cxcl10-BFP+ DC subsets at d8 following acute LCMV Armstrong infection. (E) Frequency and total cell numbers and gMFI of chemokine reporter expression in each immune challenge condition. Each dot represents a single mouse. Data are the mean ± SEM. Statistical differences were analyzed using unpaired t tests. (F) Graphs summarizing the mean frequencies ± SEM of TEFF and TSCM cells in each condition. Data are representative of three independent experiments with three to four mice in each group. Statistical differences were analyzed using unpaired t tests. *P < 0.05, **P < 0.01, ***P < 0.001, ****P < 0.0001.
Figure 6.
Figure 6.
CD8 + T cell retention in the lymph node center is associated with CXCR3 desensitization. (A–C) P14 cell positioning in lymph nodes at d8 of acute LCMV infection in control and d0–1 IFNAR-blocked mice. Images and graphs are representative of three individual experiments with four to five mice in each group per experiment. (A) LSFM micrographs of intact lymph nodes. Images are 200-µm longitudinal slices through the lymph node center. Scale bars represent 200 µm. Images show GFP-P14 cells (yellow), B220 (B cells; cyan), and CD31 (vessels; magenta). (B) Graph summarizing density of P14 cells within the 3D lymph node, from periphery (EVF = 0) to center (EVF = 1). The black dashed line indicates multiple t tests between P14 cell density in the two treatment conditions for each EVF value. The red dashed line indicates P = 0.05. Data are the mean ± SEM. (C) Graphs summarizing average density ± SEM of P14 cells within indicated regions, IFRs (EVF 0.1–0.3), and T cell paracortex (EVF 0.7–0.9). (D–F) Analysis of P14 cells at d8 of acute LCMV infection in control and d0–1 IFNAR-blocked mice. Data are representative of two independent experiments with four to five mice per group in each experiment. Each dot in D and E represents a single mouse. Data are the mean ± SEM. Statistical differences were analyzed using one-way ANOVA. (D) Graph summarizing the gMFI of P14 cell CXCR3 expression. (E) Graph summarizing the upregulation of CXCR3 on P14 cell surface at different time points following cell isolation. (F) Migratory capacity of P14 cells at different concentrations of CXCL10. **P < 0.01, ***P < 0.001, ****P < 0.0001.
Figure 7.
Figure 7.
Compensatory IFNγ drives increased CXCR3 ligands in the absence of IFNAR signaling. (A) NES plot of hallmark type I and II interferon, and inflammation responses. Data are generated as indicated in Fig. 3. NES represents the fold change of all cells analyzed in each condition, relative to expression in all other conditions. (B) Concentration of IFNγ in lysates of lymph nodes at d8 following acute LCMV infection. Each dot represents a single mouse sample. Data are the mean ± SEM. Statistical differences were analyzed using one-way ANOVA tests. (C and D) Expression of Cxcl9-RFP and Cxcl10-BFP in cDC1, cDC2, and moDC populations from REX3 hosts crossed to indicated IFN-deficient mice at d8 of acute LCMV infection. 2xIFN−/− = Ifnar−/−Ifng−/−. Data are representative of three individual repeats with at least three mice in each group in each experiment. (C) Representative flow cytometry plots. (D) Graphs summarizing graded frequencies of Cxcl9-RFP and Cxcl10-BFP expression from C. Graded expression summarized in key. (E) LSFM micrographs of intact wild-type, Ifnar−/−, Ifng−/−, or 2xIFN−/− mouse REX3 lymph nodes. Images are 200-µm longitudinal slices through the lymph node center. Scale bars represent 100 µm. Images show Cxcl9-RFP (magenta), Cxcl10-BFP (cyan), B220 (B cells; yellow), and CD31 (vessels; white). Images are representative of three individual experiments with at least three mice in each group in each experiment. **P < 0.01. Fig. S4 shows additional supporting data.
Figure S4.
Figure S4.
Absence of IFN-I and IFN-II signaling promotes T SCM cell differentiation during acute LCMV Armstrong infection. Related to Figs. 7 and 8. (A) Total lymph node IFNγ+ of indicated cells from control-treated and d0–1 IFNAR-blocked mice at d4 of acute LCMV Armstrong infection. (B) Expression of Cxcl9-RFP and Cxcl10-BFP in cDC1, cDC2, and moDC populations from REX3 hosts crossed to indicated IFN-deficient mice. (C) Images from Fig. 7 E. LSFM micrographs of intact wild-type, Ifnar−/−, Ifng−/−, and 2xIFN−/− mouse REX3 lymph nodes. Images are 200-µm longitudinal slices through the lymph node center. Scale bars represent 100 µm. The dashed line indicates the lymph node outline. Pseudocolor FIRE LUT heat maps for each REX3 reporter. Images are representative of three individual experiments with at least three mice in each group in each experiment. (D) Total P14 cell number in each wild-type or IFN-deficient host mouse. (E) Representative plots of P14 cells showing TEFF (KLRG1+SLAMF6), TSCM (KLRG1SLAMF6+), and TEX (KLRG1SLAMF6) cells. (F) Model of IFN control of chemokine production and CD8+ T cell position within lymph nodes and how this correlates with in vitro migration assay chemokine concentration. Lymph nodes indicate P14 cell location and chemokine receptor expression in Ifng−/− and 2xIFN−/− (left), wild-type (middle), and Ifnar−/− and d0–1 IFNAR-blocked (right) settings. Dotted lines indicate correlation to chemokine concentration and the bell curve of the cell migration index in in vitro assays. The wild-type setting correlates with optimal CXCL9 (red) and CXCL10 (blue) gradient formation to facilitate the generation of both TEFF (green) and TSCM (purple) cells. Ifng−/− and 2xIFN−/− settings exhibit low CXCL9 and CXCL10 expression to promote cell retention in the paracortex, increasing the generation of TSCM cells and reducing TEFF cells. In Ifnar−/− and d0–1 IFNAR-blocked settings, increased CXCL9 and CXCL10 expression causes downregulation of surface CXCR3, preventing cell migration and increased TSCM cell and reduced TEFF cell differentiation. Each dot in A, B, and D represents a single sample. *P < 0.05, **P < 0.01, ***P < 0.001, ****P < 0.0001.
Figure 8.
Figure 8.
Interplay of type I and II interferons promotes T SCM cell differentiation via multiple mechanistic pathways. (A–C) P14 cell positioning at d8 of acute LCMV infection in wild-type, Ifnar−/−, Ifng−/−, or 2xIFN−/− mice. Images and graphs are representative of three individual experiments with three to five mice in each group per experiment. (A) LSFM micrographs of intact lymph nodes. Images are 200-µm longitudinal slices through the lymph node center. Scale bars represent 200 µm. Images show GFP-P14 cells (yellow), B220 (B cells; cyan), and CD31 (vessels; magenta). (B) Graph summarizing density of P14 cells within the 3D lymph node, from periphery (EVF = 0) to center (EVF = 1). The colored dashed line indicates multiple t tests between P14 cell density in the three experimental conditions against the wild type for each EVF value. The black dashed line indicates P = 0.05. Data are the mean ± SEM. (C) Graphs summarizing density of P14 cells within indicated regions, IFRs (EVF 0.1–0.3) and T cell paracortex (EVF 0.7–0.9). Data are the mean ± SEM. Statistical differences were analyzed using an unpaired t test. (D) Graphs summarizing TEFF (KLRG1+SLAMF6) and TSCM (KLRG1SLAMF6+) cell populations in each of the four conditions. (E) Graph summarizing the PFU from viable virus in spleens of mice in each genotype. The dashed line indicates viral plaque LOD. Each dot in D and E represents a single mouse. Data are the mean ± SEM. Statistical differences were analyzed using one-way ANOVA tests. *P < 0.05, **P < 0.01, ***P < 0.001, ****P < 0.0001. Fig. S4 shows additional supporting data. LOD, limit of detection.
Figure S5.
Figure S5.
IFNAR inhibition alongside mRNA-LNP vaccination promotes exclusive generation of T SCM cells, driving increased proliferation of specific T cells upon viral rechallenge. Related to Fig. 9. (A–D) Draining lymph node P14 cells from mice d8 following GP33-encoding mRNA-LNP vaccination in combination with IFNAR and/or IFNγ blockade at d0–1. Data are representative of two independent experiments with four to five mice per group in each experiment. Each dot in C represents a single mouse. Data are the mean ± SEM. Statistical differences were analyzed using one-way ANOVA tests. (A) Experimental scheme. Naïve P14 cells were adoptively transferred into wild-type host mice 24 h prior to mRNA-LNP vaccines, which encode the GP33 epitope. Cohorts did not receive further treatment or received treatments of either IFNAR blocking, IFNγ blocking, or a combination at d0–1 following vaccination. (B) Representative flow cytometry plots showing TSCM (TCF-1+SLAMF6+) cell populations of P14 cells within each condition. (C) Graph summarizing frequencies in B. Each dot represents a single mouse sample. (D) Representative histograms of TEFF (KLRG1+SLAMF6), TSCM (KLRG1SLAMF6+), and TEX (KLRG1SLAMF6) P14 cell populations from control, IFNAR-blocked, IFNγ-blocked, or combined IFNAR- and IFNγ-blocked mice for expression of CD127, CD62L, PD-1, and TIM-3. Average gMFI ± SEM for each graph are indicated. (E and F) Graphs summarizing (E) CD61+CD55 and (F) CD61CD55+ P14 cell frequencies. Analysis of P14 cells from days 4 to 12 following mRNA-LNP vaccination. Data are the mean ± SEM. Each dot represents a single mouse. Data are representative of two independent experiments with five to six mice per group. Statistical differences were analyzed using unpaired t tests at each time point after vaccination. (G) Graphs summarizing the total P14 cell and TSCM (TCF-1+SLAMF6+) cell numbers within control and d0–1 IFNAR-blocked mice 28 days following mRNA-LNP vaccination. (H–O) Comparison of P14 cell response to chronic LCMV infection rechallenge in mice that received d0–1 IFNAR blocking following mRNA-LNP vaccination with unvaccinated mice and mice that received only vaccination as described in Fig. 9 I. (H) Representative plots of P14 cells showing TEFF (KLRG1+SLAMF6) and TSCM (KLRG1SLAMF6+) cell populations. (I) Graphs summarizing population frequencies in H. (J) Cell counts of TEFF (KLRG1+SLAMF6) and TSCM (KLRG1SLAMF6+) cell populations in each experimental condition. (K) Representative flow cytometry plots of TSCM (TCF-1+SLAMF6+) P14 cell populations. (L) Graph summarizing frequencies in K. (M) TSCM (TCF-1+SLAMF6+) cell counts. (N) Representative flow cytometry plots of TIM-3 expression on P14 cells within each condition. (O) TIM-3+ P14 cell counts. *P < 0.05, **P < 0.01, ***P < 0.001, ****P < 0.0001.
Figure 9.
Figure 9.
IFNAR blocking in combination with mRNA-LNP vaccination promotes T SCM differentiation conferring enhanced protective capacity. (A and B) P14 cells from mice that received intramuscular vaccinations of GP33-encoding mRNA-LNP and d0–1 treatment of IFNAR and/or IFNγ blocking. Draining lymph node P14 cells were analyzed at d8 following vaccination. Data are representative of two independent experiments with four to five mice per group in each experiment. Each dot in B represents a single mouse. Data are the mean ± SEM. Statistical differences were analyzed using one-way ANOVA tests. (A) Representative plots of P14 cells showing TEFF (KLRG1+SLAMF6), TSCM (KLRG1SLAMF6+), and TEX (KLRG1SLAMF6TIM-3+) populations. (B) Graphs summarizing frequencies in A. (C) Graph summarizing the persistence of antigen (NLuc) within draining lymph nodes from NLuc-encoding mRNA-LNP–vaccinated mice with or without d0–1 IFNAR blocking treatments over time. Data are the mean ± SEM. The dashed line indicates NLuc LOD from blank tissue. (D–H) Analysis of antigen-specific P14 cells from days 4 to 12 following mRNA-LNP vaccination. Data are the mean ± SEM. Data are representative of two independent experiments with five to six mice per group. Statistical differences were analyzed using unpaired t tests at each time point after vaccination. (D and E) Graphs summarizing (D) CX3CR1+SLAMF6 (TEFF) cells and (E) CX3CR1SLAMF6+ (TSCM) cells. (F) Representative flow cytometry plots of gating CD61+ TPEX cells and CD55+ TSCM cells. Cells are pre-gated on TCF-1+SLAMF6+CXCR6CD62L+ cells as per Fig. S2 F. (G and H) Graphs summarizing (G) CD61+CD55 and (H) CD61CD55+ cell frequencies. (I–M) Comparison of response to chronic LCMV infection rechallenge in mice that received d0–1 IFNAR blocking following mRNA-LNP vaccination with unvaccinated mice and mice that received only vaccination. Data are the mean ± SEM. Each dot in K–M represents a single mouse. Data are representative of three independent experiments with four to five mice per group. Statistical differences were analyzed using one-way ANOVA. (I) Schematic illustration of the experiment timeline. P14 cells were transferred into wild-type hosts prior to intramuscular vaccination of GP33-encoding mRNA-LNP. Half of the vaccinated mice immediately received IFNAR blocking followed by secondary treatment a day later. Mice were left for 30 days to establish memory. Another cohort of naïve mice received adoptive cell transfer of naïve P14 cells a day prior to all mice being infected with chronic LCMV. Mice were weighed daily following rechallenge, and lymph nodes were collected at d8. (J) Graph summarizing average proportion of weight change over the course of chronic LCMV infection within each group. (K) Graph of total P14 cell count in each indicated experimental group. (L) Expression of exhaustion marker TIM-3 on the surface of P14 cells. (M) Graph summarizing the PFU from viable virus in spleens of mice in each experimental group. The dashed line indicates viral plaque LOD. *P < 0.05, **P < 0.01, ***P < 0.001, ****P < 0.0001. Fig. S5 show additional supporting data. LOD, limit of detection.

Update of

References

    1. Ahmed, R., and Akondy R.S.. 2011. Insights into human CD8(+) T-cell memory using the yellow fever and smallpox vaccines. Immunol. Cell Biol. 89:340–345. 10.1038/icb.2010.155 - DOI - PubMed
    1. Akondy, R.S., Fitch M., Edupuganti S., Yang S., Kissick H.T., Li K.W., Youngblood B.A., Abdelsamed H.A., McGuire D.J., Cohen K.W., et al. . 2017. Origin and differentiation of human memory CD8 T cells after vaccination. Nature. 552:362–367. 10.1038/nature24633 - DOI - PMC - PubMed
    1. Alameh, M.G., Tombácz I., Bettini E., Lederer K., Sittplangkoon C., Wilmore J.R., Gaudette B.T., Soliman O.Y., Pine M., Hicks P., et al. . 2021. Lipid nanoparticles enhance the efficacy of mRNA and protein subunit vaccines by inducing robust T follicular helper cell and humoral responses. Immunity. 54:2877–2892.e7. 10.1016/j.immuni.2021.11.001 - DOI - PMC - PubMed
    1. Alexandre, Y.O., Schienstock D., Lee H.J., Gandolfo L.C., Williams C.G., Devi S., Pal B., Groom J.R., Cao W., Christo S.N., et al. . 2022. A diverse fibroblastic stromal cell landscape in the spleen directs tissue homeostasis and immunity. Sci. Immunol. 7:eabj0641. 10.1126/sciimmunol.abj0641 - DOI - PubMed
    1. Alfei, F., Kanev K., Hofmann M., Wu M., Ghoneim H.E., Roelli P., Utzschneider D.T., von Hoesslin M., Cullen J.G., Fan Y., et al. . 2019. TOX reinforces the phenotype and longevity of exhausted T cells in chronic viral infection. Nature. 571:265–269. 10.1038/s41586-019-1326-9 - DOI - PubMed

MeSH terms

LinkOut - more resources