. 2025 Aug 1;31(15):3259-3275.
doi: 10.1158/1078-0432.CCR-24-1256.

The Spectrum of IDH- and H3-Wildtype High-Grade Glioma Subgroups Occurring across Teenage and Young Adult Patient Populations

Affiliations

The Spectrum of IDH- and H3-Wildtype High-Grade Glioma Subgroups Occurring across Teenage and Young Adult Patient Populations

Rita Pereira et al. Clin Cancer Res. .

Abstract

Purpose: High-grade gliomas (HGG) occur in any central nervous system location and at any age. HGGs in teenagers/young adults (TYA) are understudied. This project aimed to characterize these tumors to support accurate stratification of patients.

Experimental design: 207 histone/IDH wild-type tumors from patients aged 13 to 30 years were collected. DNA methylation profiling [Illumina EPIC BeadArrays, brain tumor classifier (MNPv12.8 R package)] classified cases against reference cohorts of HGG. Calibrated scores guided characterization workflows [RNA-based ArcherDx fusion panel (n = 92), whole-exome sequencing (n = 107), and histology review).

Results: 53.4% (n = 86) matched as pediatric-type subgroups [pedHGG_RTK1A/B/C (31.7%, n = 51, PDGFRA, CDKN2A/B, SETD2, and NF1 alterations), pedHGG_MYCN (8.1%, n = 13, MYCN/ID2 amplifications), and pedHGG_RTK2A/B (7.5%, n = 12, TP53, BCOR, ATRX, and EGFR alterations)]. Eighteen percent (n = 29) classified as adult-type subgroups [GBM_MES (15.5%, n = 25, enriched for RB1, PTEN, and NF1 alterations) and GBM_RTK1/2 (2.5%, n = 4, CDK4 amplifications)]. Twenty-three cases (14.7%) classified as novel, poorly characterized subgroups with distinct methylation profiles and molecular features [pedHGG_A/B (n = 10 6.2%), HGG_E (n = 6 3.7%), HGG_B (n = 2 1.0%), and GBM_CBM (n = 5 3.1%)] with variable histologic morphology. Eight cases (5.1%) showed hypermutator phenotypes, enriched in HGG_E, one of which was associated with constitutional mismatch repair deficiency, and their sibling, who was diagnosed with the same syndrome, was diagnosed with a tumor that classified as a pedHGG_RTK1B. HGGs that have developed on a background of previous treatment for a childhood cancer are detected in the TYA population, classifying most frequently as pedHGG_RTK1 and contributing to the poor prognosis of this subgroup. Age distribution/molecular profile comparisons using publicly available methylation/sequencing data (and from local diagnostic cohorts) for HGG_B (n = 19), GBM_CBM (n = 35), and GBM_MES_ATYP (n = 102), irrespective of age, show that HGG_B is a TYA-specific subgroup (median age 29 years) and that GBM_CBM and GBM_MES_ATYP show a peak of distribution in the TYA population but also have a wider age distribution (median age 35.7 and 50.5 years, respectively), with the latter showing distinct differences in copy-number profiles compared with older adults in the same subgroup and containing fewer chr7 gains, chr10 losses, more CDKN2A/B deletions and MET amplifications, and a worse survival compared with adult-specific GBM_MES_TYP.

Conclusions: TYA HGGs comprise novel methylation subgroups with distinct methylation and molecular profiles. Accurate stratification of these patients will open opportunities to more effective treatments, including immune checkpoint, MAPK pathway, and PDGFRA inhibitors. See related commentary by Ritzmann et al., p. 3110.


Conflict of interest statement

J. Sidpra reports grants and personal fees from Cancer Research UK, grants from Olivia Hodson Foundation, and personal fees from University College London outside the submitted work. D.S. Ziegler reports grants from Accendatech and personal fees from Medison Pharma, Roche, Novartis, Alexion, FivepHusion, Amgen, AstraZeneca, Bayer, and Day One Therapeutics outside the submitted work. T.S. Jacques reports grants from the National Institute for Health and Care Research during the conduct of the study as well as grants from The Brain Tumor Charity, Cancer Research UK, Chan Zuckerberg Initiative, Children with Cancer UK, and Olivia Hodson Cancer Fund and other support from Repath Ltd, Neuropath Ltd, and Neuropathology and Applied Neurobiology outside the submitted work. D. Hargrave reports personal fees and nonfinancial support from Day One Therapeutics and Novartis; grants, personal fees, and nonfinancial support from AstraZeneca; and personal fees from Ipsen and Biodexa outside the submitted work. L. Marshall reports personal fees from Bayer, Eisai, and Merck outside the submitted work. No disclosures were reported by the other authors.

Figures

Figure 1.
Figure 1.
Defining an intrinsic set of TYA HGGs. A, Flow diagram providing an overview of the inclusion and exclusion criteria for the assembled cohort of 207 samples from patients aged >13 to ≤30 years. B, Anatomic location of TYA HGG after exclusion of non-glioma entities by methylation profiling (n = 189). Left, sagittal section showing internal structures; right, external view highlighting cerebral lobes. Each circle represents the proportion of cases occurring in this location and is colored by the generic locations for hemispheric (brown), midline (red), and brainstem (pink). C, Pie chart showing the proportion of different methylation subclasses within the cohort before exclusion of non-glioma entities (n = 195). Each subgroup is represented by a different color, as indicated by the key. Cases that scored <0.5 using the MNP classifier v12.8 were classed as “NOS.” Twelve cases were excluded based on poor scoring QC parameters of the methylation data.
Figure 2.
Figure 2.
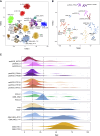
DNA methylation array profiling of the TYA HGG cohort. A, Methylation array profiling and analysis by the Heidelberg classifier excluded 12 cases that failed QC and identified 34 with a calibrated score of <0.5 that were assigned as NOS. t-SNE projection of the remaining 158 cases highlighted cohorts that clustered with both adult and pediatric-type HGG subgroups, including some novel methylation-defined subgroups. Cases then underwent further histopathologic assessment and in-depth sequencing to either confirm the methylation assignment or to further characterize the different subgroups. B, t-SNE projection of the collected cohort of 158 TYA cases alone, without the glioma reference set cases. Samples are represented by dots colored by subtype. C, Age–density plot showing the age distribution and peak incidences of different HGG subtypes by DNA methylation profiling, comprising 1,704 cases derived from the collected TYA cohort and published datasets. Tumors are grouped according to methylation subclasses and predicted age distribution according to the WHO classification. Dotted lines define the age cut-off for the TYA group in this project (13 and 30 years).
Figure 3.
Figure 3.
DNA copy number profiling of TYA HGG. A, Heatmap representation of segmented DNA copy number for 434 cases of TYA glioma profiled on the Illumina 450k or EPIC BeadArray platform (dark red, amplification; red, gain; dark blue, deletion; and blue, loss). Samples are arranged in columns clustered by contiguous categorical copy number states based upon log ratio thresholds of ±0.1 for gain/loss and ±0.5 for amplification and deletion and organized by their DNA methylation subgroups. Clustering used Euclidean distance and a Ward algorithm. Methylation annotations are provided as a bar according to the included key. B, Frequency bar plot showing the most frequent amplifications identified from the copy number profiles across the cohort (n = 434). C, Frequency bar plot showing the most frequent deletions identified from copy number profiles across the cohort (n = 434). Amp, amplification; Del, deletion. NC, no change.
Figure 4.
Figure 4.
Mutations in TYA gliomas. OncoPrint representation of an integrated annotation of single-nucleotide variants, DNA copy-number changes, and structural variants for TYA gliomas (n = 107). Samples are arranged in columns with genes labeled along rows and are grouped by methylation subclass and landscape of variants. Clinicopathologic and molecular annotations are provided as bars according to the included key. Amp, amplification; Del, deletion; NA, not available; NC, no change.
Figure 5.
Figure 5.
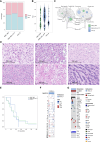
Characterization of a true TYA HGG subgroup using the collected cohort and publicly available cases with DNA methylation profiling data. A, Gender bar plots showing the gender distribution of the available cases for GBM_CBM, HGG_B, and GBM_MES_ATYP subgroups. B, Violin plots showing the age distribution and median age of the available cases for GBM_CBM, HGG_B, and GBM_MES_ATYP subgroups. C, Anatomic location of poorly characterized HGG subgroups irrespective of age. Left, sagittal section showing internal structures; right, external view highlighting cerebral lobes. Each circle represents proportion of cases occurring in this location and is colored by the tumor subgroups. D, Representative hematoxylin and eosin images of the HGG_B subgroup. E, Kaplan–Meier showing OS available by methylation subclass (line color as per key) for TYA-specific subgroups (n = 12). F, Heatmap representation of segmented DNA copy number for the HGG_B subgroup (dark red, amplification; red, gain; dark blue, deletion; and blue, loss). Samples are arranged in columns clustered by contiguous categorical copy-number states based upon log ratio thresholds of ±0.1 for gain/loss and ±0.5 for amplification and deletion. Clustering used Euclidean distance and a Ward algorithm. Methylation annotations are provided as a bar according to the included key. G, OncoPrint representation of an integrated annotation of single-nucleotide variants, DNA copy-number changes, and structural variants for the HGG_B subgroup. Samples are arranged in columns with genes labeled along rows and are grouped by methylation subclass. Clinicopathologic and molecular annotations are provided as bars according to the included key. Amp, amplification; Del, deletion; NC, no change.
Figure 6.
Figure 6.
Tumor predisposition syndromes and treatment for childhood malignancies within the TYA cohort. A, Hematoxylin and eosin images showing different cytologic and architectural features of the two cases. B, t-SNE projection of selected subgroups from the glioma reference cohort. Samples are represented by dots colored by subtype. The sibling cases are highlighted by the black circles and labeled. C, OncoPrint representation of an integrated annotation of single-nucleotide variants, DNA copy-number changes, and structural variants for the sibling cases. Samples are arranged in columns with genes labeled along rows. Clinicopathologic and molecular annotations are provided as bars according to the included key. D, Circos plots demonstrating the hypermutator phenotypes of the sibling cases. Chromosomal locations are represented by ideograms arranged around the circle. E, Patient timelines for five patients identified within the cohort who were treated for a childhood malignancy. Gender is annotated using symbols, and a sagittal brain image demonstrates the location of the tumor. A timeline provides details of key events throughout the course of treatment. F, Kaplan–Meier showing OS available for HGG_E, pedHGG_RTK1B, and pedHGG_RTK1A cases, (line color as per key) for the collected cohort (n = 34). Amp, amplification; Del, deletion; TMZ, temozolomide.

References

    1. Guerreiro Stucklin AS, Ryall S, Fukuoka K, Zapotocky M, Lassaletta A, Li C, et al. Alterations in ALK/ROS1/NTRK/MET drive a group of infantile hemispheric gliomas. Nat Commun 2019;10:4343. - PMC - PubMed
    1. Clarke M, Mackay A, Ismer B, Pickles JC, Tatevossian RG, Newman S, et al. Infant high-grade gliomas comprise multiple subgroups characterized by novel targetable gene fusions and favorable outcomes. Cancer Discov 2020;10:942–63. - PMC - PubMed
    1. Ostrom QT, Cioffi G, Gittleman H, Patil N, Waite K, Kruchko C, et al. CBTRUS statistical report: primary brain and other central nervous system tumors diagnosed in the United States in 2012–2016. Neuro Oncol 2019;21:V1–100. - PMC - PubMed
    1. Giangaspero F, Gianno F, Antonelli M, Ferretti E, Massimino M, Arcella A. Pediatric high-grade glioma: a heterogeneous group of neoplasms with different molecular drivers. Glioma 2018;1:117.
    1. Ostrom QT, Cote DJ, Ascha M, Kruchko C, Barnholtz-Sloan JS. Adult glioma incidence and survival by race or ethnicity in the United States from 2000 to 2014. JAMA Oncol 2018;4:1254–62. - PMC - PubMed