. 2025 Mar 10;16(1):2119.
doi: 10.1038/s41467-025-57383-8.

Liver fibrosis negatively impacts in vivo gene transfer to murine hepatocytes

Affiliations

Liver fibrosis negatively impacts in vivo gene transfer to murine hepatocytes

Chiara Simoni et al. Nat Commun. .

Abstract

Liver fibrosis occurs in several genetic and acquired disease conditions, leading to alterations of the tissue and metabolism, which may adversely affect viral vector-mediated gene therapy. Here, we assessed the impact of liver fibrosis on in vivo gene transfer to hepatocytes mediated by lentiviral vectors or adeno-associated viral vectors. We exploited two chemically induced fibrosis mouse models characterized by tissue damage in different areas of the liver lobule. Moreover, we used Abcb11-/- and Agl-/- mice, recapitulating features of inherited cholestasis and glycogen storage disease, as representative models of genetic disorders characterized by liver fibrosis. We report a general negative influence of liver fibrosis on hepatocyte transduction and alteration of the vector distribution within the liver lobule, with different outcomes according to the viral vector used and the state of the liver at the time of vector administration. This study bears implications for future developments and applications of in vivo liver-directed gene therapy.


Conflict of interest statement

Competing interests: A.C. is an inventor on patent applications submitted by Fondazione Telethon or San Raffaele Scientific Institute on LV technology for in vivo use related to the work presented in this manuscript. The remaining authors declare no competing interests.

Figures

Fig. 1
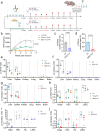
Fig. 1. CCl4-induced liver fibrosis negatively affects LV but not AAV vector transduction.
a Representative histological image of a liver section from mice (n = 12) treated with CCl4 for 6 weeks (bar = 600 µm). Picrosirius red staining. b Schematics of experimental design with timeline (green arrows indicate CCl4 administrations, red drops indicate blood collections). LV.hFIX and LV.mCherry 3.5 × 1010 transducing units (TU)/kg. AAV.hFIX 5 × 1011 vector genomes (vg)/kg. AAV.mCherry 1 × 1011 vg/kg. Created with BioRender (https://BioRender.com/x47z362). c Individual values with mean of hFIX concentration in the plasma of experimental mice at the indicated time after vector administration (Mann–Whitney test at the last time point). Gray symbols indicate mice treated with LV only (n = 8), and green symbols indicate mice treated with CCl4 and LV (n = 8). d Individual values and mean ± SEM of percentage (%) of mCherry-positive liver area expressed over the total area analyzed (Mann–Whitney test). Gray symbols indicate mice treated with LV only (n = 7), and green symbols indicate mice treated with CCl4 and LV (n = 8). e Individual values with mean of hFIX concentration in the plasma of experimental mice at the indicated time after vector administration. Light blue symbols indicate male (M) mice treated with AAV only (n = 4), blue symbols indicate male mice treated with CCl4 and LV (n = 3), orange symbols indicate female (F) mice treated with AAV only (n = 4), red symbols indicate female mice treated with CCl4 and LV (n = 4). f Individual values and mean ± SEM of percentage (%) of the mCherry-positive liver area expressed over the total area analyzed. Orange symbols indicate female mice treated with AAV only (n = 4), red symbols indicate female mice treated with CCl4 and LV (n = 4), Light blue symbols indicate male mice treated with AAV only (n = 4), blue symbols indicate male mice treated with CCl4 and LV (n = 3). Source data are provided as a Source Data file.
Fig. 2
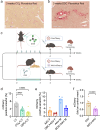
Fig. 2. DDC-induced biliary fibrosis negatively affects both LV and AAV vector transduction.
a Histological image of liver section from mice (n = 10) fed with a DDC-supplemented diet for 5 weeks (bar = 300 µm). Picrosirius red staining. b Schematics of experimental design (green bar indicates DDC diet) created with BioRender (https://BioRender.com/k46g488). LV.hFIX 5 × 1010 TU/kg. LV.mCherry 3.5 × 1010  TU/kg. AAV.hFIX 2 × 1011 vg/kg. AAV.mCherry 1 × 1011 vg/kg. c Individual values with mean of hFIX concentration in the plasma. (Mann–Whitney test at the last time point). Gray and green symbols indicate mice treated with LV only (n = 8) or with DDC and LV (n = 8), respectively. d Individual values and mean ± SEM of percentage (%) of mCherry-positive liver area over the total area analyzed (Mann–Whitney test). Gray and green symbols indicate mice treated with LV only (n = 8) or with DDC and LV (n = 8), respectively. e Individual values with mean of hFIX concentration in the plasma. Orange symbols indicate female mice treated with AAV only (n = 4), red symbols indicate female mice treated with DDC and LV (n = 4), light blue symbols indicate male mice treated with AAV only (n = 3), blue symbols indicate male mice treated with DDC and LV (n = 4). f Individual values and mean ± SEM of percentage (%) of mCherry-positive liver area over the total area analyzed. AAV F and AAV M are the same data displayed in Fig. 1f, shown here for comparison. Orange symbols indicate female mice treated with AAV only (n = 4), red symbols indicate female mice treated with DDC and LV (n = 4), light blue symbols indicate male mice treated with AAV only (n = 4), blue symbols indicate male mice treated with DDC and LV (n = 4). g, h Individual values with mean ± SEM of hFIX concentration at the last time point analyzed (g row data displayed in (e)) or % of mCherry-positive liver area (h row data displayed in (f)) expressed as fold on the mean of each respective control group (Mann–Whitney test). Brown and purple symbols indicate mice treated with AAV only (for hFIX n = 7, for mCherry n = 8) or with DDC and AAV (n = 8), respectively. Source data are provided as a Source Data file.
Fig. 3
Fig. 3. Liver fibrosis impacts LV transduction of hepatocytes without major alteration of LV biodistribution.
a Experimental design scheme (green arrows and bar indicate CCl4 administration or DDC diet, respectively) created with BioRender (https://BioRender.com/m06f740). LV.hFIX 5 × 1010 TU/kg. LV.mCherry in CCl4 experiment 1.5 × 1010 TU/kg, in DDC experiment 4 × 1010 TU/kg. b Individual values with mean of hFIX concentration. (Mann–Whitney test at the last time point). Gray, green, and orange symbols indicate mice treated with LV (n = 5), with CCl4 and LV (n = 5), or with DDC and LV (n = 4), respectively. c, d Individual values and mean ± SEM of percentage (%) of mCherry-positive hepatocytes (hepa; Mann–Whitney test). c Gray and purple symbols indicate mice treated with LV (n = 6) or with CCl4 and LV (n = 6), respectively. d Light blue and red symbols indicate mice treated with LV (n = 5) or DDC and LV (n = 5), respectively. e Individual values and mean ± SEM of VCN in indicated organs of mice administered with LV.hFIX (Mann–Whitney test). Gray, green, and orange symbols indicate mice treated with LV (n = 5), with CCl4 and LV (n = 5), or with DDC and LV (n = 4), respectively. f, g Individual values and mean ± SEM of VCN in indicated organs of mice administered with LV.mCherry (Mann–Whitney test). f Gray and purple symbols indicate mice treated with LV (n = 6) or with CCl4 and LV (n = 6), respectively. g light blue and red symbols indicate mice treated with LV (n = 5) or DDC and LV (n = 5), respectively. h Individual values and mean ± SEM of VCN in indicated liver cells of mice administered with LV.hFIX (Mann–Whitney test). Gray, green, and orange symbols indicate mice treated with LV (n = 5), with CCl4 and LV (n = 5), or with DDC and LV (n = 4), respectively. i, j Individual values and mean ± SEM of VCN in indicated liver cells of mice administered with LV.mCherry (Mann–Whitney test). i gray and purple symbols indicate mice treated with LV (n = 6) or with CCl4 and LV (n = 6), respectively. j light blue, and red symbols indicate mice treated with LV (n = 5) or DDC and LV (n = 5), respectively. Source data are provided as a Source Data file.
Fig. 4
Fig. 4. Milder fibrosis, induced by CCl4 or DDC, reduces LV and AAV vector transduction efficiency.
a, b Representative histological images of liver sections from mice treated with CCl4 (n = 6) or fed with a DDC-supplemented diet (n = 8) for 3 weeks (a, bar = 600 µm, b bar = 300 µm). Picrosirius red staining. c Schematics of experimental design with timeline (green arrows indicate CCl4 administrations, green bar indicates DDC diet). LV.mCherry 1 × 1010 TU/kg. AAV.mCherry 1 × 1011 vg/kg. Created with BioRender (https://BioRender.com/t54x010). d, e Individual values and mean ± SEM of percentage (%) of the mCherry-positive liver area expressed over the total area analyzed (d Kruskal–Wallis test). d Gray symbols indicate mice treated with LV only (n = 6), green symbols indicate mice treated with CCl4 and LV (n = 8), and yellow symbols indicate mice treated with DDC and LV (n = 8). e orange symbols indicate female mice treated with AAV only (n = 4), red symbols indicate female mice treated with DDC and LV (n = 5), light blue symbols indicate male mice treated with AAV only (n = 5), blue symbols indicate male mice treated with DDC and LV (n = 5). f Individual values with mean ± SEM of mCherry-positive liver area percentage (%) expressed as fold on the mean of each respective control group (Mann–Whitney test; row data displayed in (e)). Brown symbols indicate mice treated with AAV only (n = 9), and purple symbols indicate mice treated with DDC and AAV (n = 10). Source data are provided as a Source Data file.
Fig. 5
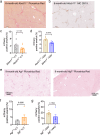
Fig. 5. Liver fibrosis due to Abcb11 deficiency slightly reduces LV and AAV vector transduction, while LV and AAV vector transduction is not significantly impaired in Agl−/− mice.
a, b Representative histological images of liver sections from 6-month-old Abcb11−/− mice (bar = 500 µm). Picrosirius red staining (a) and IHC CK19 (b). c, d Individual values and mean ± SEM of percentage (%) of the mCherry-positive liver area expressed over the total area analyzed (two-tailed Mann–Whitney test). LV.mCherry 3.5 × 1010 TU/kg. AAV.mCherry 1 × 1011 vg/kg. c Gray symbols indicate Abcb11+/+ mice treated with LV (n = 10), and orange symbols indicate Abcb1−/− mice treated with LV (n = 11). d brown symbols indicate Abcb11+/+ mice treated with AAV (n = 6), and blue symbols indicate Abcb1−/− mice treated with AAV (n = 5). e Representative histological images of liver sections from 9-month-old Agl−/− (left) and age-matched Agl+/+ male mice (right) (bar = 500 µm). Picrosirius red staining. f, g Individual values and mean ± SEM of percentage (%) of the mCherry-positive liver area expressed over the total area analyzed (Mann–Whitney test). LV.mCherry 5 × 1010 TU/kg. AAV.mCherry 1 × 1011 vg/kg. f Gray symbols indicate Agl+/+ mice treated with LV (n = 5), and orange symbols indicate Agl−/− mice treated with LV (n = 5). g Brown symbols indicate Agl+/+ mice treated with AAV (n = 5), and blue symbols indicate Agl−/− mice treated with AAV (n = 5). Source data are provided as a Source Data file.
Fig. 6
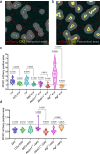
Fig. 6. Liver fibrosis modifies the distribution of gene transfer within the liver lobule.
a, b Representative images of zonation analysis, based on immunofluorescence staining of liver sections from control mice administered with LV.mCherry. Gray circles indicate the analyzed periportal (a) or pericentral (b) areas. a Anti-mCherry antibody (red), anti-CK7 antibody (yellow), and periportal area (gray). b Anti-mCherry antibody (red), anti-GS antibody (yellow), and pericentral area (gray). c, d Violin plot with individual values, median, and quartiles of the fold between periportal (PP) over pericentral (PC) mCherry-positive liver area of mice treated with LV.mCherry (c) or AAV.mCherry (d) (Wilcoxon signed-rank test against 1, Kruskal–Wallis test, or Mann–Whitney test between test and control groups). The dotted line represents fold = 1. Row data are displayed in Supplementary Fig. 7. Source data are provided as a Source Data file.

References

    1. Roehlen, N., Crouchet, E. & Baumert, T. F. Liver fibrosis: mechanistic concepts and therapeutic perspectives. Cells9, 875 (2020). - PMC - PubMed
    1. Scorza, M. et al. Genetic diseases that predispose to early liver cirrhosis. Int J. Hepatol.2014, 1–11 (2014). - PMC - PubMed
    1. Alam, S. & Lal, B. B. Recent updates on progressive familial intrahepatic cholestasis types 1, 2 and 3: Outcome and therapeutic strategies. World J. Hepatol.14, 98 (2022). - PMC - PubMed
    1. Parola, M. & Pinzani, M. Liver fibrosis: pathophysiology, pathogenetic targets and clinical issues. Mol. Asp. Med.65, 37–55 (2019). - PubMed
    1. Nathwani, A. C., McIntosh, J. & Sheridan, R. Liver gene therapy. Hum. Gene Ther.33, 879–888 (2022). - PubMed

MeSH terms

Substances

LinkOut - more resources