. 2025 Mar 10;16(1):2383.
doi: 10.1038/s41467-025-57655-3.

Age-associated differences in mucosal and systemic host responses to SARS-CoV-2 infection

Affiliations

Age-associated differences in mucosal and systemic host responses to SARS-CoV-2 infection

Jillian H Hurst et al. Nat Commun. .

Abstract

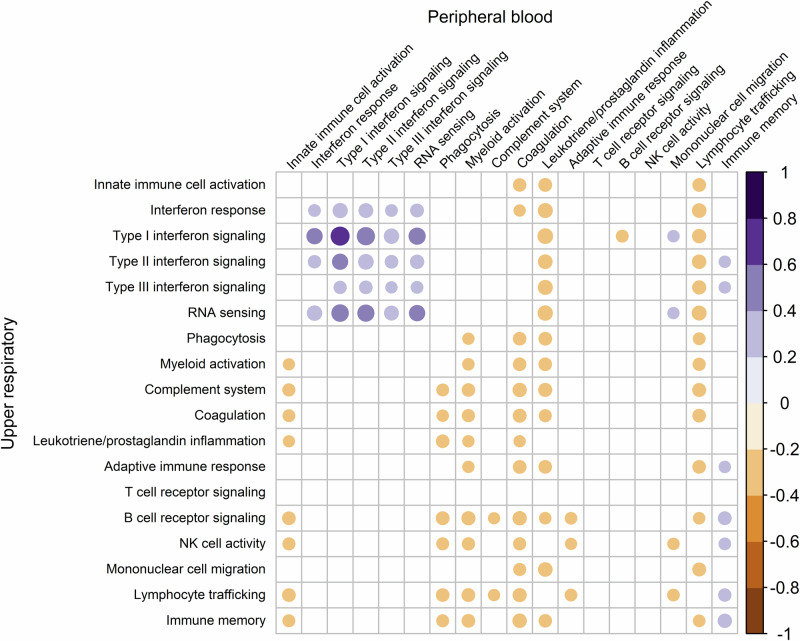
Age is among the strongest risk factors for severe outcomes from SARS-CoV-2 infection. Here we describe upper respiratory tract (URT) and peripheral blood transcriptomes of 202 participants (age range of 1 week to 83 years), including 137 non-hospitalized individuals with mild SARS-CoV-2 infection and 65 healthy individuals. Among healthy children and adolescents, younger age is associated with higher URT expression of innate and adaptive immune pathways. SARS-CoV-2 infection induces broad upregulation of URT innate and adaptive immune responses among children and adolescents. Peripheral blood responses among SARS-CoV-2-infected children and adolescents are dominated by interferon pathways, while upregulation of myeloid activation, inflammatory, and coagulation pathways is observed only in adults. Among SARS-CoV-2-infected individuals, fever is associated with blunted URT immune responses and more pronounced systemic immune activation. These findings demonstrate that immune responses to SARS-CoV-2 differ across the lifespan, from distinct signatures in childhood and adolescence to age-associated alterations in adults.


Conflict of interest statement

Competing interests: T.W.B. is a consultant for and owns equity in Biomeme, Inc. K.M.W. held a sponsored research project from Moderna Therapeutics, Inc. on immune correlates of congenital CMV infection. C.W.W. is a consultant for and owns equity in Biomeme, Inc. M.S.K. is a consultant for Merck & Co, Inc. and Invivyd. N.A.T. has received research contracts with PDI, Purio, and Basilea as well as consulting for Techspert. A.M. is a consultant for Merck, Pfizer, Moderna, Astra-Zeneca, Enanta, and Sanofi-Pasteur. O.R. has received research grants from the Bill & Melinda Gates Foundation, Merck, and Janssen; fees for participation in advisory boards from Merck, Sanofi-Pasteur, Pfizer, and Moderna; and fees for lectures from Pfizer, AstraZeneca, Merck, and Sanofi-Pasteur. All other authors declare that they have no competing interests.

Figures

Fig. 1
Fig. 1. Transcriptional profiles within the upper respiratory tract and peripheral blood of healthy children, adolescents, and adults.
Bulk RNA sequencing was used to compare the transcriptional profiles of healthy young children (0–5 years), school-age children (6–13 years), adolescents (14–20 years), and adults (≥21 years, peripheral blood samples only). a, b Box and whisker plots depict proportions of transcripts attributed to different immune cell populations in the upper respiratory tract and peripheral blood of healthy children and adolescents, with cell proportions imputed using CIBERSORT. Note that the proportions of cell types predicted by CIBERSORT do not reflect their absolute proportions within a given sample type. Lines splitting the boxes correspond to median values while box edges represent the 25th and 75th percentiles with outliers shown as single points. Proportions of immune cell populations were compared by age (modeled as a continuous variable) using beta regression, with all analyses corrected for multiple comparisons (*, padj < 0.05; **, padj < 0.01; ***, padj < 0.001; ****, padj < 0.0001). Only immune cell populations identified in at least 25% of samples are shown. Differential expression of gene modules in upper respiratory and peripheral blood samples from pediatric age groups (c) and in peripheral blood samples from children and adolescents compared to adults (d). Below each column, the age group listed first represents the group of interest while the age group listed second is the reference group. Numbers within each circle indicate the normalized enrichment score (NES) calculated through gene set enrichment analysis. Colored circles indicate differential expression (padj < 0.05) of immune modules across the comparison groups (red, upregulation in the age group of interest; blue, downregulation in the age group of interest). Gene set enrichment analyses were adjusted for sex, sequencing batch, and imputed sample immune cell proportions (peripheral blood only). Source data are provided as a Source Data file. (TNF tumor necrosis factor, NK natural killer, Treg, and regulatory T).
Fig. 2
Fig. 2. Differential host gene expression in upper respiratory and peripheral blood samples associated with SARS-CoV-2 infection among children, adolescents, and adults.
Bulk RNA sequencing was used to compare the upper respiratory and peripheral blood transcriptional profiles of young children (0–5 years), school-age children (6–13 years), adolescents (14–20 years), and adults (≥21 years, peripheral blood only) by SARS-CoV-2 infection status. a Volcano plot depicting differential expression of genes in the upper respiratory tracts of SARS-CoV-2-infected compared to healthy children and adolescents (padj < 0.05). The ten most differentially upregulated and 5 most downregulated genes in SARS-CoV-2-infected participants based on log2-fold change are labeled. b Volcano plot depicting differential expression of gene modules in upper respiratory samples by SARS-CoV-2 infection status. The ten modules with the highest normalized enrichment scores (NES; upregulated in SARS-CoV-2 infection) are labeled; no modules were downregulated in SARS-CoV-2-infected participants. c Volcano plot depicting differential expression of genes in the peripheral blood of SARS-CoV-2-infected compared to healthy children, adolescents, and adults. The 10 most differentially upregulated and 5 most downregulated genes in SARS-CoV-2-infected participants based on log2-fold change are labeled. d Volcano plot depicting differential expression of gene modules in peripheral blood by SARS-CoV-2 infection status. The 10 modules with the highest NES (upregulated in SARS-CoV-2-infected participants) are labeled; no modules were downregulated in SARS-CoV-2-infected participants. All analyses shown were adjusted for sex, sequencing batch, age group, and imputed sample immune cell proportions (peripheral blood only). Source data are provided as a source data file. (MHC major histocompatibility complex).
Fig. 3
Fig. 3. Transcriptional profiles associated with SARS-CoV-2 infection by age group.
Bulk RNA sequencing was used to compare the upper respiratory and peripheral blood transcriptional profiles of young children (0–5 years) school-age children (6–13 years), adolescents (14–20 years), and adults (≥21 years; peripheral blood only). a, b Box and whisker plots depict proportions of transcripts attributed to different immune cell populations in the upper respiratory tract and peripheral blood of SARS-CoV-2-infected participants, with cell proportions imputed using CIBERSORT. Note that the proportions of cell types predicted by CIBERSORT do not reflect their absolute proportions within a given sample type. Lines splitting the boxes correspond to median values while box edges represent the 25th and 75th percentiles with outliers shown as single points. Proportions of immune cell populations were compared by age (modeled as a continuous variable) using beta regression, with all analyses corrected for multiple comparisons (*, padj < 0.05; **, padj < 0.01; ***, padj < 0.001; ****, padj < 0.0001). Only immune cell populations identified in at least 25% of samples are shown. c Differential expression of gene modules in the upper respiratory tract and peripheral blood associated with SARS-CoV-2 infection by age group. Within each age group listed below the columns, module expression among SARS-CoV-2-infected participants was compared to that of healthy participants in that same age group. Numbers within each circle indicate the normalized enrichment score (NES) calculated through gene set enrichment analysis. Colored circles indicate differential expression (padj < 0.05) of gene modules by SARS-CoV-2 infection status (red, upregulated in SARS-CoV-2-infected participants; blue, downregulated in SARS-CoV-2-infected participants). Gene set enrichment analyses were adjusted for sex, sequencing batch, and imputed sample immune cell proportions (peripheral blood only). Source data are provided as a Source Data file. (TNF tumor necrosis factor; NK natural killer; Treg and regulatory T).
Fig. 4
Fig. 4. Differential expression of immune modules in SARS-CoV-2 infection by symptom presence.
Heatmaps depict results of gene set enrichment analysis of upper respiratory (children and adolescents) and peripheral blood (children, adolescents, and adults) bulk RNA sequencing data comparing gene expression among SARS-CoV-2-infected participants who reported a symptom to infected participants who did not report that symptom. Each column corresponds to a gene module comprised of co-expressed genes that share a similar function. The numbers within blocks represent normalized enrichment scores (NES) for comparisons of gene module expression that were statistically significant (padj < 0.05). The color of each block indicates the direction of the change in expression (red, upregulated in the condition of interest; blue, downregulated in the condition of interest). Analyses were adjusted for age group, sex, sequencing batch, and imputed sample immune cell proportions (peripheral blood only). Source data are provided as a source data file. (TNF tumor necrosis factor; NK natural killer; Treg regulatory T).
Fig. 5
Fig. 5. Correlations between immune module expression in the upper respiratory tract and peripheral blood of SARS-CoV-2-infected children and adolescents.
Single-sample gene set enrichment analysis was used to calculate enrichment scores for gene modules in paired upper respiratory and peripheral blood samples from SARS-CoV-2-infected children and adolescents. Pearson’s correlation coefficients were then calculated to evaluate for linear relationships between expression of these modules in the upper respiratory tract and peripheral blood of the same individual. Positive correlations are displayed in purple and negative correlations are displayed in orange. The size and color of each circle correspond to the strength of the correlation; only statistically significant correlations after adjustment for multiple comparisons (padj < 0.05) are shown. Source data are provided as a source data file. (NK, natural killer).

References

    1. Verity, R. et al. Estimates of the severity of coronavirus disease 2019: a model-based analysis. Lancet Infect. Dis.20, 669–677 (2020). - PMC - PubMed
    1. Centers for Disease Control and Prevention (CDC), United States COVID-19 Cases and Deaths by State over Time (available at https://data.cdc.gov/Case-Surveillance/United-States-COVID-19-Cases-and-... (2024).
    1. CDC, Cases, Data, and SurveillanceCenters for Disease Control and Prevention (available at https://www.cdc.gov/coronavirus/2019-ncov/covid-data/investigations-disc...) (2020).
    1. Centers for Disease Control and Prevention, COVID-NET: COVID-19-associated hospitalization surveillance network (available at https://gis.cdc.gov/grasp/covidnet/COVID19_3.html).
    1. Molteni, E. et al. Illness duration and symptom profile in symptomatic UK school-aged children tested for SARS-CoV-2. Lancet Child Adolesc. Health5, 708–718 (2021). - PMC - PubMed