. 2025 Mar 10;16(1):2365.
doi: 10.1038/s41467-025-57539-6.

Suppression of stress granule formation is a vulnerability imposed by mutant p53

Affiliations

Suppression of stress granule formation is a vulnerability imposed by mutant p53

Elizabeth Thoenen et al. Nat Commun. .

Abstract

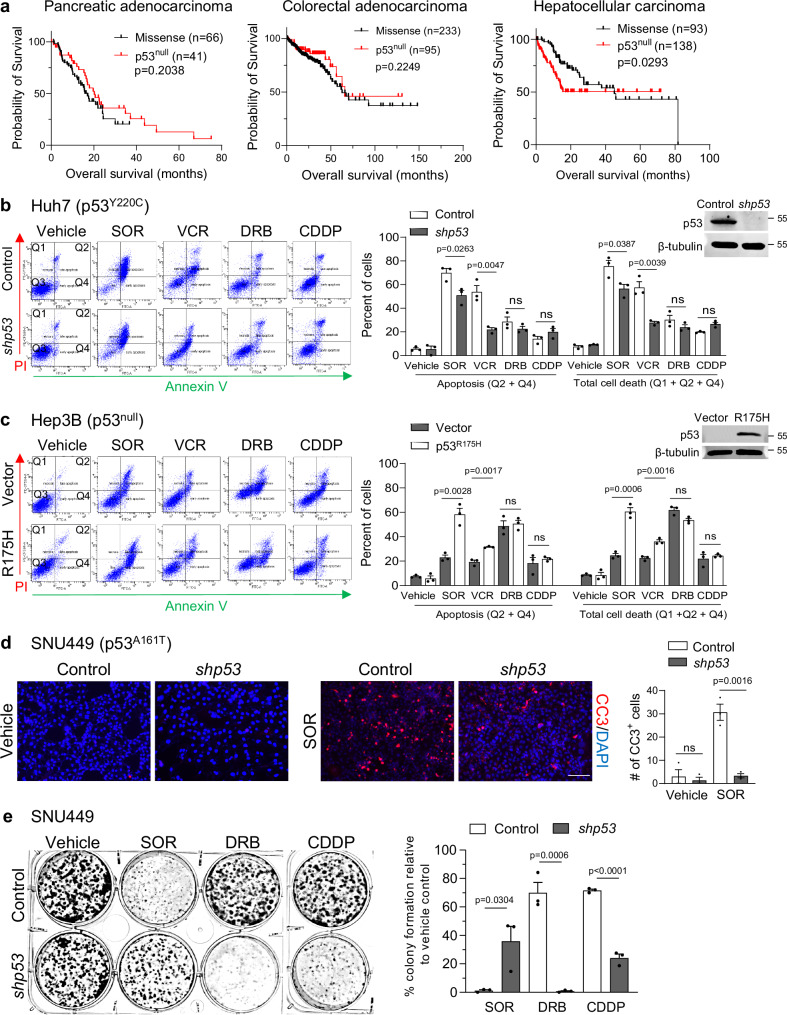
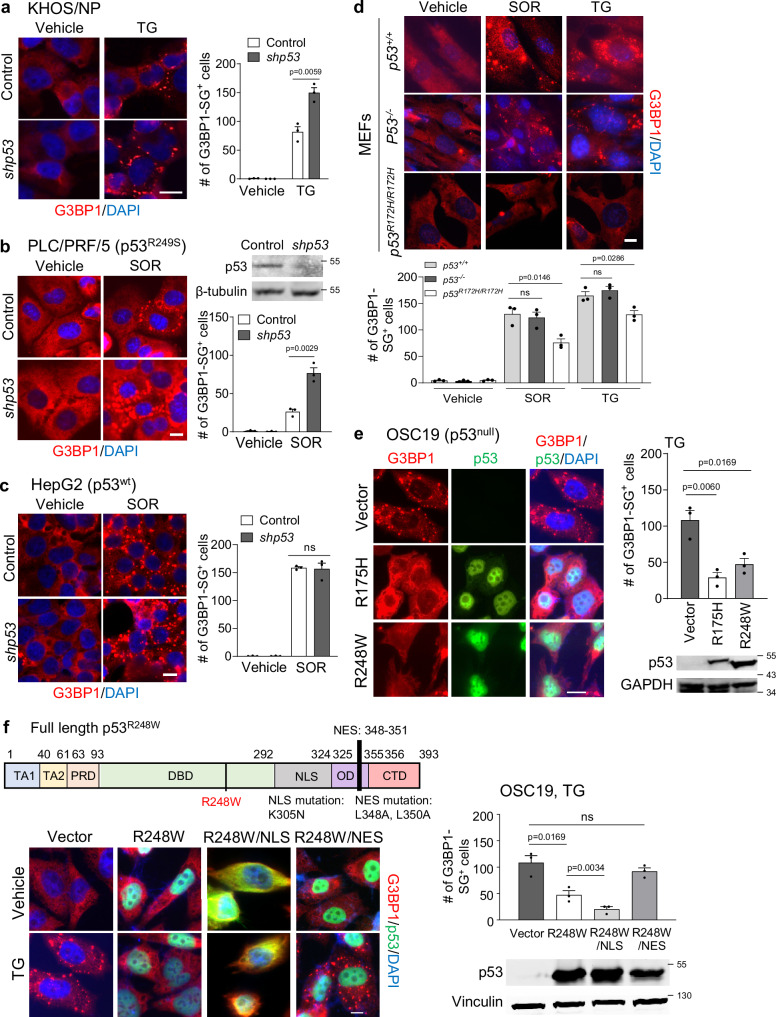
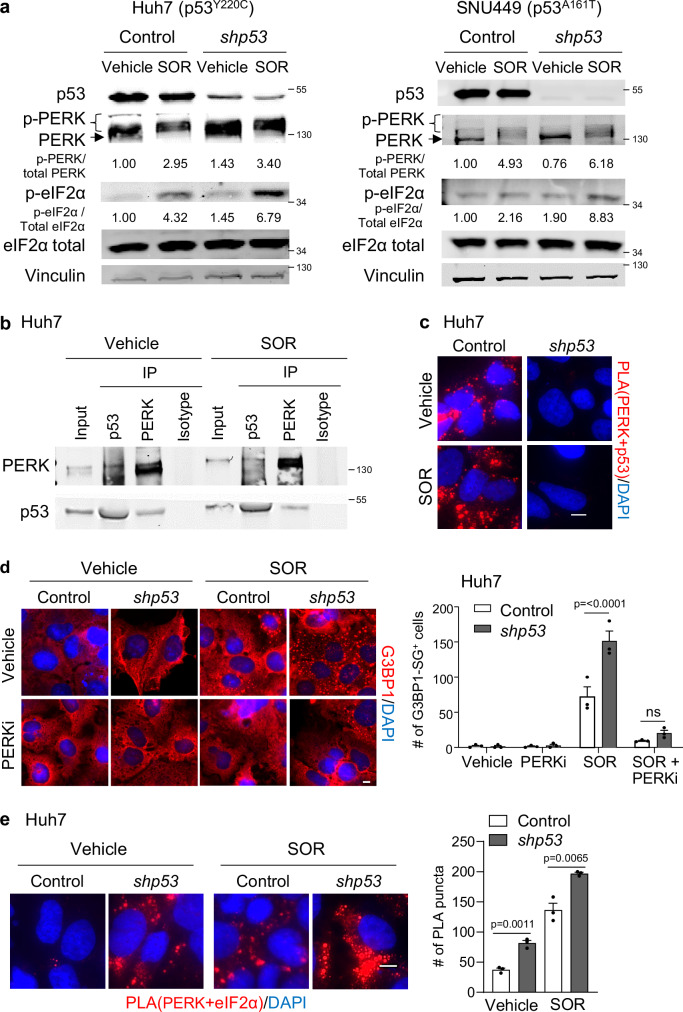
Missense mutations in the TP53 (p53) gene have been linked to malignant progression. However, our in-silico analyses reveal that hepatocellular carcinoma (HCC) patients with mutant p53 (mutp53) have better overall survival compared to those with p53-null (p53null) HCC, unlike other cancer types. Given the historical use of sorafenib (SOR) monotherapy for advanced HCC, we hypothesize that mutp53 increases sensitivity to SOR, a multikinase inhibitor that induces endoplasmic reticulum (ER) stress. Here we show that mutp53 inhibits stress granule (SG) formation by binding to an ER stress sensor, PKR-like ER kinase (PERK), and a key SG component, GAP SH3 domain-binding protein 1 (G3BP1), contributing to increased sensitivity of SG-competent cells and xenografts to ER stress inducers including SOR. Our study identifies a unique vulnerability imposed by mutp53, suggesting mutp53 as a biomarker for ER stress-inducing agents and highlighting the importance of SG inhibition for cancer treatment.


Conflict of interest statement

Competing interests: The authors declare no competing interests.

Figures

Fig. 1
Fig. 1. The potential benefit of p53 mutations in HCC for increased SOR sensitivity.
a Kaplan-Meier curves of indicated TCGA datasets. Overall survival of patients with missense mutp53 and p53null tumors. P-values were calculated using logrank test. b, c Annexin V/PI staining and flow cytometry using Huh7 (p53Y220C) cells with and without p53 knockdown (shp53 targeting p53 exon 7/8) or Hep3B cells with and without 3xFLAG-tagged p53R175H overexpression, treated with vehicle, SOR (25 µM for Huh7, 8 µM for Hep3B), VCR (25 µM), DRB (6 µM for Huh7, 1 µM for Hep3B), or CDDP (6 µM for Huh7, 12 µM for Hep3B) for 48 h. Graphs showing the percent of apoptosis (Q2 + Q4) and total cell death (Q1 + Q2 + Q4) with representative WB for p53, and β-tubulin using untreated cells (n = 3). The molecular weight markers (kDa) are shown on the right. d Immunofluorescence for cleaved caspase-3 (CC3, red) and DAPI (blue) using SNU449 (p53A161T) cells with and without p53 knockdown, treated with 12 µM SOR for 48 h. Graph showing the number of CC3+ cells in 200 randomly selected cells following SOR treatment (n = 3). Scale: 100 µm. e Colony formation assays using control and mutp53-knockdown SNU449 cells. Colonies were treated with SOR (12 µM), DRB (1 µM), or CDDP (12 µM) for 48 h and stained with crystal violet 4 days later. Graphs showing a percentage of the number of colonies relative to that in the vehicle control (n = 3). All experiments in (be) are from three independent experiments (n = 3). Mean ± S.E.M., two-tailed Student’s t-test. ns not significant. Source data are provided as a Source Data file.
Fig. 2
Fig. 2. Mutp53 enhances the sensitivity of HCC and other types of cancer cells to ER stress.
a WB for p53 and GAPDH and Annexin V/PI and flow cytometry using control vector and mutp53-knockdown (shp53) KHOS/NP cells, treated with 25 µM VCR, 3 µM DRB, or 1.5 µM CDDP for 72 h. A graph showing the percent of apoptosis and total cell death (n = 3). Immunofluorescence for CC3 using control and mutp53-knockdown KHOS/NP cells, treated with 25 µM VCR (b) or 1 µM TG (e) for 48 h. Graphs showing the number of CC3+ cells in 200 cells (n = 3). Scale: 100 µm. Colony formation assays using control and mutp53-knockdown KHOS/NP cells, treated with 25 µM VCR for 48 h (c) or increasing concentrations of TG for 1 h (f). Graphs showing a percentage of the number of colonies compared to that in the vehicle control (n = 3). Annexin V/PI and flow cytometry using KHOS/NP cells with and without mutp53 knockdown (d) and Hep3B cells with and without p53R175H overexpression (g), following treatment with 1 µM TG for 48 h. Graphs showing the percent of apoptosis and total cell death (n = 3). All experiments are from three independent experiments. Mean ± S.E.M., two-tailed Student’s t-test. ns not significant. Source data are provided as a Source Data file.
Fig. 3
Fig. 3. Mutp53 inhibits formation of SGs.
Immunofluorescence for G3BP1 and DAPI using control and p53-knockdown KHOS/NP (a), PLC/PRF/5 (b), or HepG2 (c) cells treated with vehicle, TG (1 µM, 1 h, a), or SOR (25 μM, 2 h, b, c). Scale: 10 µm. All graphs in this figure showing numbers of cells with G3BP1+ SGs out of 200 randomly selected cells. Cells were counted as being G3BP1-SG+ when they contained at least 5 cytoplasmic SGs (n = 3). WB for p53 and β-tubulin using untreated PLC/PRF/5 cells (b). d Immunofluorescence for G3BP1 and DAPI and a summarized graph (n = 3), using MEFs with different p53 status (p53+/+, p53-/-, p53R172H/R172H) treated with 50 µM SOR for 2 h or 15 µM TG for 1 h. Scale: 10 µm. e Immunofluorescence for G3BP1, p53, and DAPI and a summarized graph (n = 3) in p53null OSC19 cells expressing p53R175H and p53R248W (no tag), following treatment with TG (10 µM) for 1 h. Scale: 10 µm. WB of untreated cells for p53 and GAPDH. f Structure and domains of human p53, including transactivation (TA) domains, a proline rich domain (PRD), a DNA binding domain (DBD), a mutation at p53R248W, NLS and a mutation at p53K305N, NES and mutations at p53L348A/L350A, an oligomerization domain (OD), and a C-terminal domain (CTD). Immunofluorescence for G3BP1, p53, and DAPI and a summarized graph (n = 3) using OSC19 cells expressing vector, p53R248W, p53R248W/NLS, and p53R248W/NES treated with TG (10 µM) for 1 h. WB of untreated cells for p53 and Vinculin. Unmerged images are in Supplementary Fig. S3i. All experiments are from three independent experiments. Mean ± S.E.M., two-tailed Student’s t-test. ns not significant. Source data are provided as a Source Data file.
Fig. 4
Fig. 4. Mutp53’s binding to PERK prevents the PERK-eIF2α interaction, inhibits phosphorylation of eIF2α, and contributes to the suppression of SG formation.
a WB for the indicated proteins using control and p53-knockdown Huh7 and SNU449 (p53A161T) HCC cells treated with vehicle control or SOR. Mean values of densitometric analyses for p-PERK/total PERK and p-eIF2α/total eIF2α below images (n = 3). b Co-IP studies for p53 and PERK using Huh7 cells treated with vehicle or SOR. c PLA (red) for p53 and PERK, using control and p53-knockdown (shp53) Huh7 cells treated with vehicle or SOR. Scale: 10 µm. d Immunofluorescence for G3BP1 and DAPI and a summarized graph (n = 3) using Huh7 cells treated with or without SOR and/or a PERK inhibitor, GSK2606414 (PERKi, 800 nM, 2 h). Scale: 10 µm. e PLA (red) for PERK and eIF2α, using control and p53-knockdown (shp53) Huh7 cells treated with vehicle or SOR. Scale: 10 µm. Graph quantifying the number of cells positive for PERK-eIF2α interaction puncta out of 200 randomly selected cells (n = 3). Scale: 10 µm. All experiments are from three independent experiments. Mean ± S.E.M., two-tailed Student’s t-test. ns not significant. Source data are provided as a Source Data file.
Fig. 5
Fig. 5. Mutp53’s binding to G3BP1 inhibits G3BP1 oligomerization and SG formation, which contributes to increased sensitivity to ER stress inducers.
a Co-IP studies for p53, followed by WB for the indicated SG core proteins, using KHOS/NP cells treated with TG. MWM: molecular weight marker. b Co-IP studies for p53 and G3BP1 using SNU449 cells treated with SOR. c PLA (red) for G3BP1 and p53, using control and p53-knockdown (shp53) Huh7 cells treated with vehicle or SOR. Scale: 10 µm. d Co-IP studies for FLAG and p53 using Huh7 cells expressing FLAG-tagged full-length (Full) or ΔRGG G3BP1, followed by WB for FLAG and p53. e Immunofluorescence and WB (untreated) for the indicated proteins, using control, G3BP1-knockdown (shG3BP1), p53-knockdown (shp53), and G3BP1/p53-knockdown SNU449 cells treated with SOR. Graph showing the number of PABP-SG+ cells in 200 cells (n = 3). Scale: 10 µm. f Annexin V/PI staining using control, G3BP1-knockdown, p53-knockdown, and G3BP1/p53-knockdown SNU449 cells treated with vehicle or SOR. Graph showing the percentage of apoptotic cells. g Immunofluorescence for G3BP, A11 (anti-amyloid oligomer), and DAPI using control and mutp53-knockdown Huh7 cells treated with vehicle or SOR. Insets showing co-localization of G3BP+-SGs and A11-positive puncta (n = 3). Scale: 10 µm. Graph showing area of colocalization of A11-positive large puncta and G3BP-positive SGs (n = 75 across three independent experiments). Bar in (g) indicates median. h Oligomerization assays for G3BP1 using control and p53-knockdown Huh7 cells treated with vehicle or SOR. For protein crosslinking, cell lysates were treated with vehicle or BMH (1 mM, 30 min), followed by WB for G3BP1 and GAPDH. All experiments are from three independent experiments. Mean ± S.E.M., two-tailed Student’s t-test. ns not significant. Source data are provided as a Source Data file.
Fig. 6
Fig. 6. The oligomerization domain of mutp53 is required for binding to G3BP1, inhibiting SG formation, and enhancing ER stress-mediated apoptosis.
a Deletion mutants of p53R175H in the NLS, OD, and CTD with 3xFLAG tags. b WB for p53 and GAPDH in untreated Hep3B (p53null) cells expressing vector control or each p53 construct. c PLA (red) for G3BP1 and mutp53 using Hep3B cells expressing vector, full-length p53R175H, and different p53R175H deletion mutants, following treatment with vehicle or SOR. Scale: 10 µm. d Immunofluorescence for G3BP1 (red), p53 (green), and DAPI (blue) and a summarized graph using Hep3B cells with different p53R175H deletion mutants, treated with SOR (n = 3). Scale: 10 µm. Unmerged images are in Supplementary Fig. S6a. e Immunofluorescence for CC3 and a summarized graph using Hep3B cells expressing vector, full-length (p53R175H), or OD-deleted p53R175H (ΔOD), treated with vehicle or SOR for 48 h (n = 3). Scale: 100 µm. f Annexin V/PI & flow cytometry using the same set of Hep3B cells as in (e), treated with vehicle, SOR (8 µM, 48 h) or VCR (25 µM, 48 h). Graph showing the percentage of apoptosis (n = 3). All experiments are from three independent experiments. Mean ± S.E.M, two-tailed Student’s t-test. ns: not significant. Source data are provided as a Source Data file.
Fig. 7
Fig. 7. Mutp53 enhances the sensitivity of HCC xenografts to SOR, accompanied by reduced SG formation and increased apoptosis.
a Tumor growth curve of control and mutp53-knockdown Huh7 xenografts with representative tumor images. NSG mice bearing Huh7 tumors (~60 mm3) were treated with vehicle or 100 mg/kg SOR for once daily, 3 days/week for ~3 weeks. Mean ± S.E.M. (n = 6), Two-way ANOVA with Geisser-Greenhouse correction. b IHC for p53 and CC3 using Huh7 tumors at experimental endpoints. Graphs showing IHC scores, which were measured as the sum of average intensity and average extensity of CC3 (n = 3). *p < 0.05; unpaired student’s t-test. Scale: 100 µm. c Representative images of immunofluorescence for PABP and G3BP1 to detect SGs, using Huh7 tumors from (a). Scale: 10 µm. Graphs showing the number of PABP-SG+ or G3BP1-SG+ cells in 200 cells (n = 3). d Tumor growth curve of control and mutp53-knockdown PLC/PRF/5 xenografts with representative tumor images. The same set of experiments were done as in (a). Mean ± S.E.M. (n = 7), Two-way ANOVA with Geisser-Greenhouse correction. e Analyses of TCGA datasets of HCC. Overall survival of HCC patients with missense mutp53 and p53null was stratified according to G3BP1 mRNA expression levels (below or above the mean). Logrank test. All experiments in (b, c) are from three independent experiments. Mean ± S.E.M., two-tailed Student’s t-test. ns not significant. Source data are provided as a Source Data file.
Fig. 8
Fig. 8. A proposed model of SG suppression and increased SOR sensitivity by mutp53.
Mutp53 inhibits ER stress-mediated formation of SGs by interacting with PERK and G3BP1, which contributes to enhanced sensitivity to ER stress inducers like SOR. Created in BioRender. Iwakuma, T. (2025) https://BioRender.com/h97c210.

References

    1. Zhan, Y. et al. Understanding the roles of stress granule during chemotherapy for patients with malignant tumors. Am. J. Cancer Res.10, 2226–2241 (2020). - PMC - PubMed
    1. Arimoto, K., Fukuda, H., Imajoh-Ohmi, S., Saito, H. & Takekawa, M. Formation of stress granules inhibits apoptosis by suppressing stress-responsive MAPK pathways. Nat. Cell Biol.10, 1324–1332 (2008). - PubMed
    1. Kim, W. J., Back, S. H., Kim, V., Ryu, I. & Jang, S. K. Sequestration of TRAF2 into stress granules interrupts tumor necrosis factor signaling under stress conditions. Mol. Cell Biol.25, 2450–2462 (2005). - PMC - PubMed
    1. Khong, A., Matheny, T., Huynh, T. N., Babl, V. & Parker, R. Limited effects of m(6)A modification on mRNA partitioning into stress granules. Nat. Commun.13, 3735 (2022). - PMC - PubMed
    1. Buttgereit, F. & Brand, M. D. A hierarchy of ATP-consuming processes in mammalian cells. Biochem. J.312, 163–167 (1995). - PMC - PubMed

MeSH terms