. 2025 Mar 10;16(1):2401.
doi: 10.1038/s41467-025-57588-x.

DNA lesions can frequently precede DNA:RNA hybrid accumulation

Affiliations

DNA lesions can frequently precede DNA:RNA hybrid accumulation

Raphaël M Mangione et al. Nat Commun. .

Abstract

While DNA:RNA hybrids contribute to multiple genomic transactions, their unscheduled formation is a recognized source of DNA lesions. Here, through a suite of systematic screens, we rather observed that a wide range of yeast mutant situations primarily triggering DNA damage actually leads to hybrid accumulation. Focusing on Okazaki fragment processing, we establish that genic hybrids can actually form as a consequence of replication-born discontinuities such as unprocessed flaps or unligated Okazaki fragments. Strikingly, such "post-lesion" DNA:RNA hybrids neither detectably contribute to genetic instability, nor disturb gene expression, as opposed to "pre-lesion" hybrids formed upon defective mRNA biogenesis, e.g., in THO complex mutants. Post-lesion hybrids similarly arise in distinct genomic instability situations, triggered by pharmacological or genetic manipulation of DNA-dependent processes, both in yeast and human cells. Altogether, our data establish that the accumulation of transcription-born DNA:RNA hybrids can occur as a consequence of various types of natural or pathological DNA lesions, yet do not necessarily aggravate their genotoxicity.


Conflict of interest statement

Competing interests: The authors declare no competing interests.

Figures
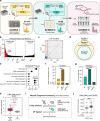
Fig. 1
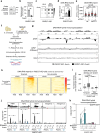
Fig. 1. Systematic screens reveal novel sources of DNA:RNA hybrids.
a Principle of hyper-recombination and DNA:RNA hybrid detection assays in systematic screens. Reporter genes are positioned opposite to the unique plasmid replication origin (red dot) and can be replicated in both directions with respect to transcription. b Mutant strains assessed in Screen I (n = 4460) were divided along the x-axis according to recombination indices (left, hyper-rec; right, hypo-rec) and ranked according to their divergence from wt (p-value). Hashed lines indicate cutoff by p = 0.05. c Interaction densities between top-ranked hyper-recombinant strains from Screen I, as assessed by CLIK. Numbers (1,2,3): interaction densities significantly above background; red line: CLIK cutoff. d Comparison between Screen I and Screen II hyper-recombinant hits. Out of 114 mutants identified in Screen I, only those exhibiting normal fitness in galactose induction conditions (n = 77) were assessed in Screen II. e Gene Ontology analysis for genes whose deletion triggers significant hyper-recombination in both screens I and II (n = 39). f Recombination indices (Screen I) for control strains (****, p = 7.0 × 10−7). g Recombination levels (% LEU+ recombinants, Screen II) for control strains (wt vs tho ****, p = 1.9 × 10−33; wt vs rad52∆ ****, p = 1.4 × 10−18). h DNA:RNA hybrid levels for hyper-rec mutants common to Screen I and II (n = 39; ****, p < 0.0001), as assessed in Screen III. The position of tho and OF processing mutants is indicated. YDL162c deletion overlaps the promoter of the DNA ligase I gene (CDC9) and is considered as a hypomorphic cdc9 allele. i Schematic representation of main players in OF processing. SSE: Structure Specific Endonucleases. The OF RNA primer appears in red. j Quantification of DNA:RNA hybrid foci in MCF7 breast cancer cells expressing the RHINO sensor and treated with the SC13 FEN1 inhibitor (n = 3; total number of cells: control, n = 38, SC13, n = 53; ****, p < 0.0001). For box plots (h, j), boxes extend from the 25th to 75th percentiles, with the median displayed as a line. The whiskers mark 1.5 times the inter-quartile range of the first or third quartile (Tukey’s definition), displaying all the values (h) or outliers (j) as individual points. Statistical tests: b, f, h, j Two-sided Mann–Whitney–Wilcoxon rank sum test; e Hypergeometric test; g Two-sided Fisher exact test. Source data are provided as a Source Data file.
Fig. 2
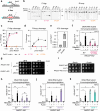
Fig. 2. Okazaki Fragment processing defects lead to genic DNA:RNA hybrid accumulation.
a Whole-cell extracts of RAD27-AID cells (control or auxin-treated) were analyzed by western blot using antibodies detecting Rad27-Flag-AID (anti-Flag, top panel). Dpm1 was used as a loading control (bottom panel). b Rad27 levels were quantified from (a) (mean ± SD; n = 4; relative to Dpm1 and expressed as % of control; **, p = 0.0079). c DNA:RNA hybrid levels were assessed by dot blot on genomic DNAs obtained from RAD27-AID cells (control or auxin-treated) using S9.6 antibodies (left panel). dsDNA levels were used as loading control (right panel). Decreasing amounts of genomic DNA were loaded for quantification. d DNA:RNA hybrid levels were quantified from (c) (mean ± SD; n = 5; relative to dsDNA and mean control values; **, p = 0.0079). e DNA:RNA hybrid levels (n = 3; total number of cells: wt, n = 306, wt pRNH1, n = 280, rad27∆, n = 306, rad27∆ pRNH1, n = 314; ****, p < 0.0001) were assessed by immunofluorescence using S9.6 antibodies on chromosome spreads (pRNH1: ectopic ScRNH1 expression). f Principle of strand-specific DNA:RNA hybrid immunoprecipitation (DRIP) coupled to sequencing. g Snapshots of strand-specific DRIP-seq coverage in RAD27-AID cells (gray: control; black: auxin-treated). Signals from Watson (W) or Crick (C) strands are represented. A representative replicate is featured for total genomic DNA (input), DRIP, and DRIP following in vitro treatment with RNase H. h Heatmap analysis of DRIP signals at highly-transcribed genes, aligned at their Transcription Start Site (TSS) and Transcription End Site (TES), and ranked according to hybrid levels on the template strand (control conditions). Strand-specific signals are represented for both strands. 500 bp upstream the TSS and downstream the TES are displayed, and only the regions between the TSS and the TES are scaled. i Quantification of strand-specific DNA:RNA hybrid levels densities over transcribed regions in control or auxin-treated conditions (****, p < 0.0001). Box-plots are defined as above (Fig. 1j). j Top, Snapshots of DRIP signals at the indicated loci in RAD27-AID cells (gray: control; black: auxin-treated). Bottom, DNA:RNA hybrid detection (DRIP-qPCR; adjusted % of IP; mean ± SD; n = 4; *, p = 0.0286) in RAD27-AID cells (control or auxin-treated). Cells were either asynchronous (Async) or arrested in G1 prior to Rad27 depletion. When indicated, DNA extracts were treated with RNase H in vitro prior to immunoprecipitation. The positions of qPCR amplicons are displayed as red bars. k DNA:RNA hybrid detection (DRIP-qPCR; adjusted % of IP; mean ± SD; n = 3) in RAD27-AID cells (control or auxin-treated) carrying a TetOFF-YAT1 construct. When indicated, transcription of the transgene was inhibited by doxycycline (Txn.: −). Statistical test: Two-sided Mann–Whitney–Wilcoxon rank sum test. Source data are provided as a Source Data file.
Fig. 3
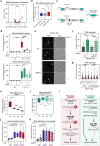
Fig. 3. DNA discontinuities associated with OF processing defects precede DNA:RNA hybrid accumulation.
a Schematic representation of 5’-flap and R-loop substrates used in in vitro cleavage assays. The length of DNA/RNA fragments (nucleotides, nt), the position of fluorescent labels (blue circles), and the site of Rad27 cleavage are indicated. b Labeled 5′-flaps (left panels) or R-loop substrates (right panels) were incubated with the indicated amounts of either wt, E176A or D129A purified Rad27 proteins (pmol). Cleavage products were visualized following denaturing electrophoresis. The position of uncleaved (90) and cleaved (40/65) fragments are indicated (nucleotides). c, d Cleavage efficiency (% of cleaved products over total labeled fragments; mean ± SD; n = 3) as a function of Rad27 amounts (pmol) for wt, E176A or D129A Rad27 variants. e Amounts of wt Rad27 proteins required to achieve 10% cleavage for 5′-flap and R-loop substrates (obtained from (c, d); mean ± SD; n = 3). f DNA:RNA hybrid detection (DRIP-qPCR; adjusted % of IP; mean ± SD; n = 4; *, p = 0.0286) at the YEF3 locus in RAD27-AID cells (control or auxin-treated) carrying an empty vector (EV) or a construct expressing the Rad27-E176A mutant protein. g Serial dilutions of RAD27-AID cells were grown at the indicated temperatures (30 °C, 37 °C) on rich medium (YPD) in the absence of the presence of auxin. Cells carried an empty vector (EV) or a construct over-expressing Exo1 (pEXO1). h DNA:RNA hybrid detection (DRIP-qPCR; adjusted % of IP; mean ± SD; n = 5; *, p = 0.0317; **, p = 0.0079) at the YEF3 locus in RAD27-AID cells (control or auxin-treated) carrying an empty vector (EV) or a construct over-expressing Exo1. i Serial dilutions of the indicated strains were grown at 30 °C on rich medium (YPD) in the absence or presence of auxin. DNA:RNA hybrid detection (DRIP-qPCR; adjusted % of IP; mean ± SD; n = 4; *, p = 0.0286) at the YEF3 locus in RAD27-AID wt, exo1∆ (j) or cdc9-1 (k) derivatives (control or auxin-treated). The same wt control is used in (j, k). For all DRIP-qPCR assays, when indicated, DNA extracts were treated with RNase H in vitro prior to immunoprecipitation. Statistical test: Two-sided Mann–Whitney–Wilcoxon rank sum test. Source data are provided as a Source Data file.
Fig. 4
Fig. 4. Post-lesion DNA:RNA hybrids neither impact gene expression nor genome stability.
a RNA-seq analysis of control and auxin-treated RAD27-AID cells. Differential expression (log2 Fold Change [±Auxin]) and associated significance (−log10 p-value, n = 3) are represented for the whole transcriptome. Transcripts that are up- or down-regulated (|log2 FC| > 0.58; p < 0.05) upon Rad27 depletion appear in red and blue, respectively. b DNA:RNA hybrid enrichments following Rad27 depletion (Fold change [±Auxin]; *, p = 0.0411) are represented for up-regulated, down-regulated, and unaffected transcripts based on (a). c Schematic representation of inducible GAL-YAT1 reporter constructs used in this study. d Recombination frequencies (fraction of LEU+ prototrophs; n = 14; ***, p = 0.0003; ****, p < 0.0001) for the indicated strains carrying GAL-YAT1 or GAL-intron-YAT1 transgenes repressed with glucose (Txn.: −) or induced with galactose (Txn.: +). e Fluorescence microscopy analysis of RAD27-AID cells (control or auxin-treated) expressing the Rad52-YFP fusion (pRNH1: ectopic ScRNH1 expression). DIC differential interference contrast. Scale bar, 5 µm. f Quantification of Rad52 foci from (e) (mean ± SD; n = 3; ****, p < 0.0001). g Quantification of γH2AX foci in MCF7 cells transfected with control (GFP) or RNase H1-overexpressing (GFP-RNH1) constructs. When indicated, cells were treated with SC13 or LNT1 inhibitors (n = 3; total number of cells counted: GFP, DMSO n = 149, SC13 n = 148, LNT1 n = 137; RNH1, DMSO n = 150, SC13 n = 145, LNT1 n = 130; *(a), p = 0.0139; *(b), p = 0.0471; **p = 0.0093). h, i Hyper-rec mutants common to Screen I and II (n = 39) were split into quartiles according to DNA:RNA hybrid levels ((h); **, p = 0.0018; ****, p < 0.0001). Recombination levels from screen II (% LEU+ recombinants, (i)) are represented for each quartile. j Recombination frequencies were calculated as above (fraction of LEU+ prototrophs; n = 14; ***(a), p = 0.007; ***(b), p = 0.0001) for the indicated strains carrying the GAL-YAT1 transgene and treated with glucose (Txn.: −) or galactose (Txn.: +). k Quantification of Rad52 foci (mean ± SD; wt, n = 4, rad57∆, ctf18∆, n = 3; ****, p < 0.0001) in the indicated strains (pRNH1: ectopic ScRNH1 expression). l, Model for the formation of post-lesion DNA:RNA hybrids. Box plots (b, d, h, i, j) are defined as above (Fig. 1j). Statistical tests: a Wald test corrected for multiple testing; b, d, gj Two-sided Mann–Whitney–Wilcoxon rank sum test; f, k Two-sided Fisher exact test. Source data are provided as a Source Data file.

References

    1. Zong, D., Oberdoerffer, P., Batista, P. J. & Nussenzweig, A. RNA: a double-edged sword in genome maintenance. Nat. Rev. Genet. 21, 651–670 (2020). - PubMed
    1. Palancade, B. & Rothstein, R. The ultimate (Mis)match: when DNA meets RNA. Cells10, 1433 (2021). - PMC - PubMed
    1. Niehrs, C. & Luke, B. Regulatory R-loops as facilitators of gene expression and genome stability. Nat. Rev. Mol. Cell Biol.21, 167–178 (2020). - PMC - PubMed
    1. Brickner, J. R., Garzon, J. L. & Cimprich, K. A. Walking a tightrope: the complex balancing act of R-loops in genome stability. Mol. Cell82, 2267–2297 (2022). - PMC - PubMed
    1. García-Muse, T. & Aguilera, A. R loops: from physiological to pathological roles. Cell179, 604–618 (2019). - PubMed

LinkOut - more resources