. 2025 Mar;5(3):504-527.
doi: 10.1038/s43587-025-00823-3. Epub 2025 Mar 10.

Subcellular proteomics and iPSC modeling uncover reversible mechanisms of axonal pathology in Alzheimer's disease

Affiliations

Subcellular proteomics and iPSC modeling uncover reversible mechanisms of axonal pathology in Alzheimer's disease

Yifei Cai et al. Nat Aging. 2025 Mar.

Abstract

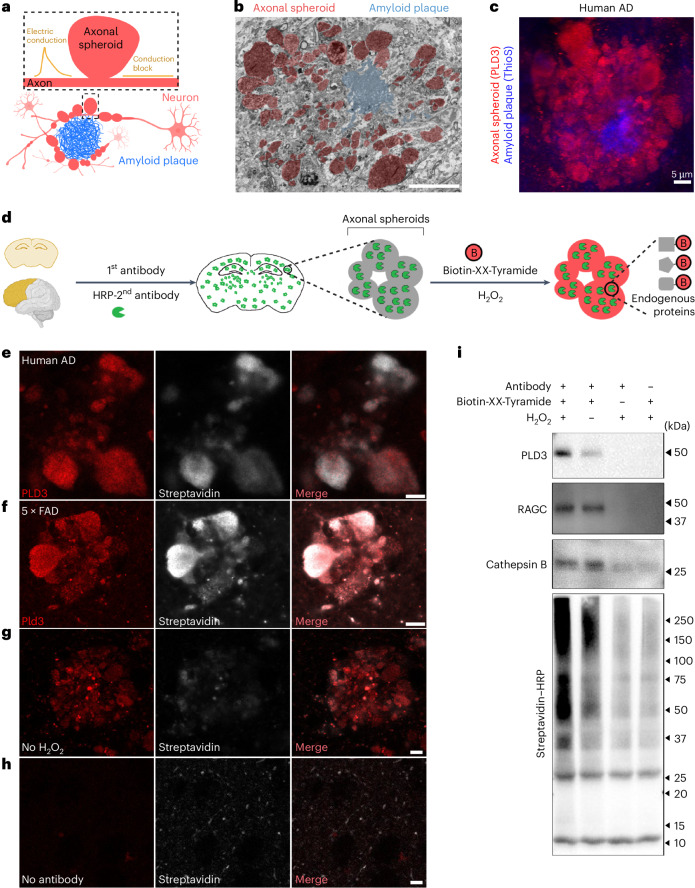
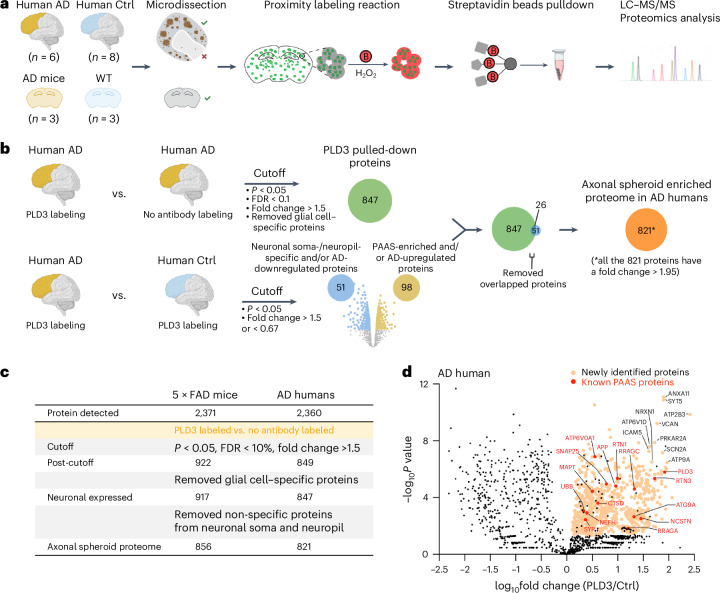
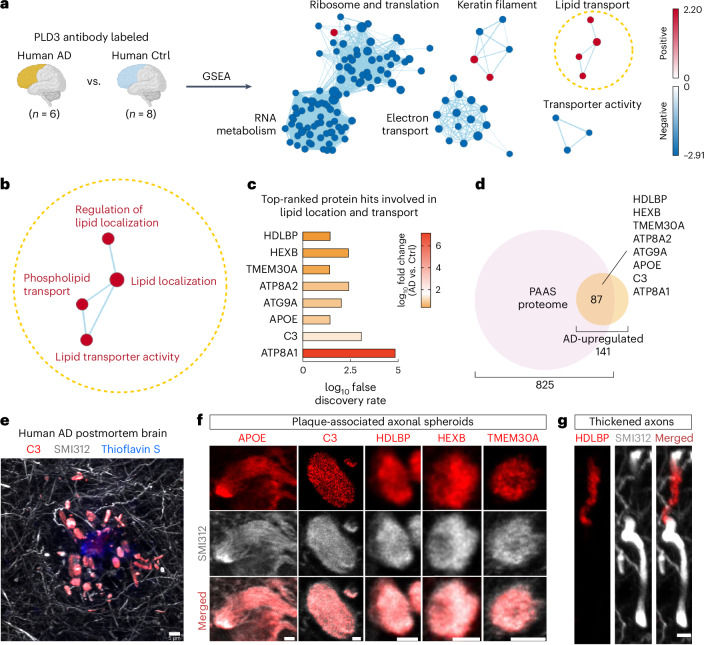
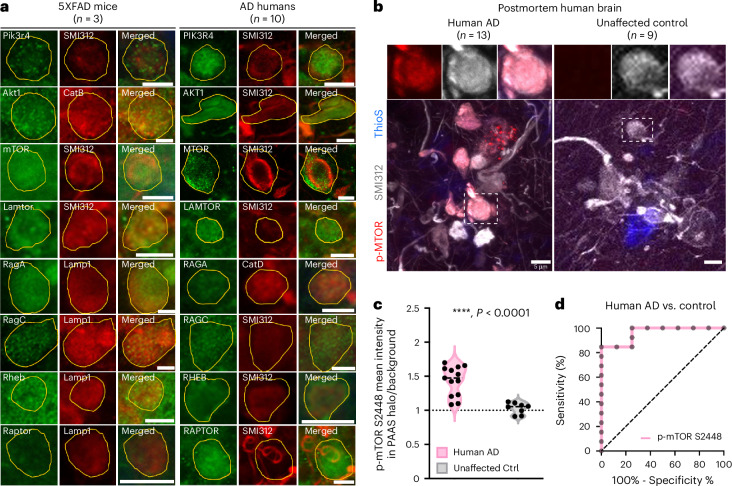
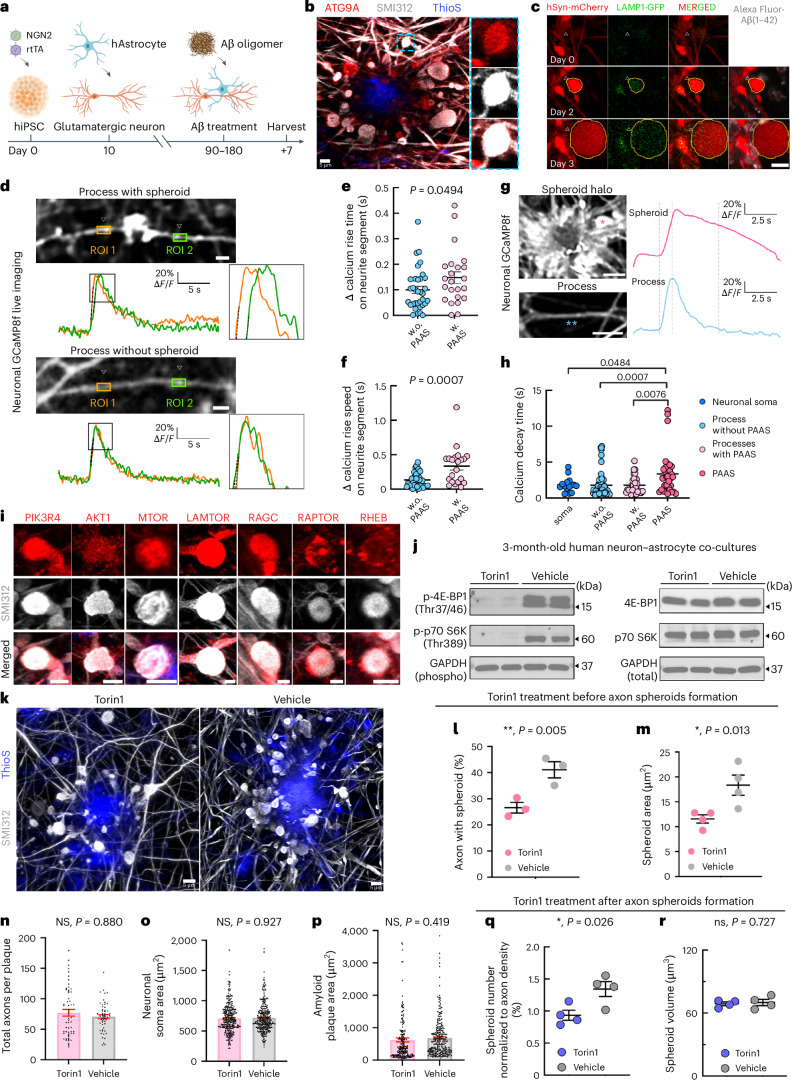
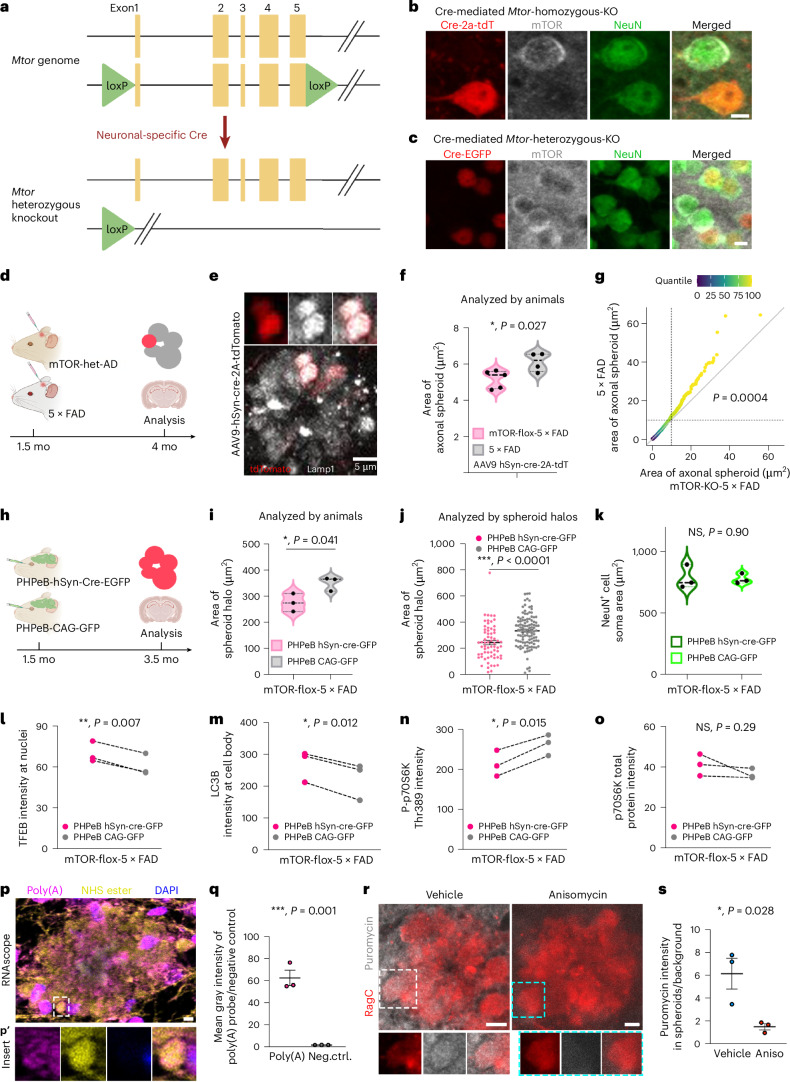
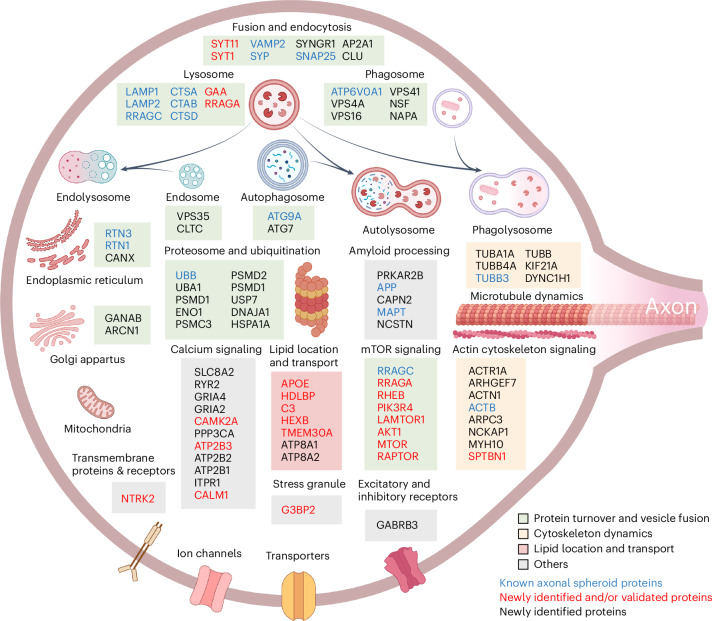
Dystrophic neurites (also termed axonal spheroids) are found around amyloid deposits in Alzheimer's disease (AD), where they impair axonal electrical conduction, disrupt neural circuits and correlate with AD severity. Despite their importance, the mechanisms underlying spheroid formation remain incompletely understood. To address this, we developed a proximity labeling approach to uncover the proteome of spheroids in human postmortem and mouse brains. Additionally, we established a human induced pluripotent stem cell (iPSC)-derived AD model enabling mechanistic investigation and optical electrophysiology. These complementary approaches revealed the subcellular molecular architecture of spheroids and identified abnormalities in key biological processes, including protein turnover, cytoskeleton dynamics and lipid transport. Notably, the PI3K/AKT/mTOR pathway, which regulates these processes, was activated in spheroids. Furthermore, phosphorylated mTOR levels in spheroids correlated with AD severity in humans. Notably, mTOR inhibition in iPSC-derived neurons and mice ameliorated spheroid pathology. Altogether, our study provides a multidisciplinary toolkit for investigating mechanisms and therapeutic targets for axonal pathology in neurodegeneration.


Conflict of interest statement

Competing interests: The authors declare no competing interests.

Figures

Fig. 1
Fig. 1. Proximity labeling of proteins within plaque-associated axonal spheroids.
a, Schematic showing axons with spheroids (red) around an amyloid plaque (blue). Spheroids disrupt axonal electric conduction, causing delays and blockages. b, FIB/SEM image of a 5×FAD mouse brain showing spheroids (red) around an amyloid plaque (blue). Scale bar, 20 μm. Related to Supplementary Movie. c, Immunofluorescence confocal deconvolved image demonstrating that PLD3 is highly enriched in axonal spheroids (red, PLD3) around amyloid plaques (blue, thioflavinS) in postmortem AD human brain. d, Schematic of the pipeline for proximity labeling PAAS proteomics in postmortem brains. AD human or mouse brain sections were incubated with a primary antibody against PLD3 and an HRP-conjugated secondary antibody, followed by a biotinylation reaction in the presence of Biotin-XX-Tyramide and H2O2. eh, Proximity labeling biotinylation of proteins within PAASs: human AD brains (e) and 5×FAD mouse brains (f). e,f, Biotinylated proteins were visualized using streptavidin–Alexa Fluor 647. g,h, Control conditions include no-H2O2 (g) or no-antibody labeling (h), both of which showed markedly reduced biotinylation. Scale bar, 5 μm. i, Streptavidin–HRP western blot showing efficient streptavidin bead pulldown of biotinylated proteins, including PLD3 (protein bait) and known axonal spheroid proteins RAGC and cathepsin B. See also Extended Data Figs. 1 and 2 and Supplementary Figs. 1 and 2.
Fig. 2
Fig. 2. Proteomic analysis of plaque-associated axonal spheroids in humans with AD and 5×FAD mice.
a, Schematic of the technical pipeline for PAAS proteomic analysis. Gray matter regions with high plaque load were microdissected from brain sections from human AD; gray matter was also dissected from unaffected controls under a fluorescence stereomicroscope. b, Statistical pipeline used to identify PAAS proteomes in humans (related to Fig. 2c and Extended Data Fig. 1e–g). The same pipeline was applied to uncover PAAS proteomes in 5×FAD mice. c, Table showing statistical cutoffs and summary of identified proteomic hits in humans with AD and 5×FAD mice. The human PAAS proteome includes 821 proteins (all with FC > 1.95), whereas the mouse PAAS proteome includes 856 proteins (all with FC > 1.66). d, Volcano plot showing proteins that passed statistical cutoffs (orange dots) in humans with AD. The top 10 proteomic hits, with the lowest P values and highest FCs, are labeled by their gene names in black. Selected known PAAS proteins are highlighted as red dots with red gene names. Black dots among yellow ones represent proteins filtered out by the statistical pipeline (Fig. 2b) (see Supplementary Table 1 for the full list of proteomic hits). c,d, Quantification was performed two-sided. See also Extended Data Figs. 3–7 and Supplementary Figs. 3–6. Ctrl, control.
Fig. 3
Fig. 3. Pathway analyses reveal proteins involved in protein turnover and cytoskeleton as key components of PAASs.
a, Pathway enrichment analysis of the PAAS proteome in AD human brains. The Enrichment Map represents a network of pathways, with edges connecting pathways that share many genes. Node color reflects the FDR of each pathway. Theme labels were curated based on the main pathways of each subnetwork. Subnetworks with a minimum of four pathways connected by edges are shown. b, IPA pathway analysis of the PAAS proteome in humans with AD. Top-ranking CNS-related signaling pathways are shown. The signaling pathways are summarized as four modules. The alluvium plot shows color-coded modules connecting to the differentially expressed genes (DEGs), and the DEGs connect to the pathways that they are involved in. c, IPA pathways related to the three modules (synapse/vesicle fusion, protein turnover and cytoskeleton) with P < 0.01 are listed. Heatmaps indicate either the −log10 (P value) or the z-score of each signaling pathway (pathways with a z-score in red are predicted to be activated, whereas blue ones are predicted to be inhibited). d, Bar chart shows representative proteomic hits from the signaling pathways in c. Newly identified proteins are shown in red; known PAAS proteins are shown in black. n = 6 human AD brains and n = 8 unaffected human control brains were analyzed. Error bars indicate s.e.m. c,d, Quantification was performed two-sided. e, Representative immunofluorescence confocal images of newly identified proteins (red) expressed in spheroids (gray) in AD postmortem brains. Scale bar, 5 μm. Zoom-out images are shown in Supplementary Fig. 7. Quantification was performed in n = 10 AD human brains. Protein expression quantifications can be found in Supplementary Table 2. See also Extended Data Fig. 4 and Supplementary Fig. 7. Ctrl, control.
Fig. 4
Fig. 4. Proteins involved in lipid transport are upregulated in PAASs.
a, GSEA was performed to compare PLD3-labeled proteins between humans with AD and unaffected controls. Pathway enrichment analysis was performed to cluster GSEA nodes. Each node represents a biological process or cellular component. The name of each cluster was curated based on the main GSEA biological processes and cellular components within each cluster. See also Supplementary Table 6. b, Detailed information on the lipid transport cluster. The biological process or cellular component of each node is listed. c, The eight top-ranked proteomic hits involved in the lipid transport cluster. The bar chart shows the FC and FDR of these hits by comparing PLD3-labeled humans with AD versus unaffected controls. d, Venn diagram showing that the eight top-ranked lipid transport–related proteins are shared between the human PAAS proteomes (821 proteins) and the AD upregulated proteins (98 proteins). A total of 75 proteins are shared between these two datasets. e,f, Representative zoomed-out (e) and zoomed-in (f) immunofluorescence confocal images of the top-ranked lipid-related proteomic hits in AD human brain, including C3, APOE, HDLBP, HEXB and TMEM30A. Scale bar, 5 μm. Zoomed-out images of all the proteins are shown in Extended Data Fig. 8. Quantification was performed in n = 3 AD human brains. Protein expression quantifications can be found in Supplementary Table 2. g, Representative immunofluorescence confocal images showing the anti-co-localized distribution of HDLBP (red) and the pan-axonal marker SMI312 (gray) within thickened axons in the AD human postmortem brain (n = 3). Scale bar, 5 μm. Ctrl, control.
Fig. 5
Fig. 5. mTOR signaling is expressed in axonal spheroids and is associated with Alzheimer’s pathology.
a, Immunofluorescence confocal imaging validation of selected proteomic hits and the related proteins in the PI3K/AKT/mTOR axis reveals that signaling molecules of this axis are expressed in PAASs in both humans with AD and 5×FAD mice. PAASs were labeled using traditional markers, including neurofilament SMI312, cathepsin B (CatB), cathepsin D (CatD) or Lamp1. PAASs are outlined in yellow. Scale bar, 5 μm. Protein expression quantification results can be found in Supplementary Table 2. b, Phosphorylated-mTOR-S2448 (red) is highly enriched within PAASs (gray, SMI312) around amyloid plaques (blue, thioflavinS) in advanced AD. Scale bar, 5 μm. c, Quantification of the mean fluorescence intensity levels of p-mTOR-S2448 within axonal spheroid halos normalized to background fluorescence, comparing humans with AD (n = 13 brains) and unaffected controls (n = 8 brains). Mann–Whitney test, two-tailed, ****P < 0.0001. Black dashed line indicates the median. d, Receiver operating characteristic (ROC) curve demonstrates that the p-mTOR-S2448 level in PAASs significantly distinguishes AD brains from unaffected controls. Area under the ROC curve = 0.962, standard error = 0.038, 95% confidence interval: 0.888–1.000, P = 0.0005. Quantification was performed two-sided. Ctrl, control; ThioS, thioflavin S.
Fig. 6
Fig. 6. A human iPSC-derived AD model demonstrates that mTOR signaling inhibition reduces PAAS pathology.
a, Workflow of the human iPSC-derived AD model. b, Image showing axonal spheroids (SMI312, gray) around amyloid deposits (thioflavinS, blue) and expressing ATG9A (red). c, Time-lapse imaging shows a spheroid forming (arrowhead) from a neurite (AAV9-hSyn-mCherry labeled) near Aβ deposits (gray) and enlarging over time. Lysosomes (AAV2-CMV-LAMP1-GFP labeled) accumulate within spheroids. dh, Neuronal GCaMP8f imaging in the human iPSC AD model. d, Images of CAMKII-GCaMP8f-labeled neuronal processes with (upper) or without (lower) axonal spheroids and representative traces of calcium dynamics. y axis indicates ΔF/F, and dotted black lines indicate the calcium rise slope. Quantification of calcium rise time (e) and calcium rise speed (f). Each dot represents a neuronal process from three independent experiments (two-tailed Mann–Whitney test). g, Images showing that calcium decay time is slower in spheroids (pink asterisk) than in neuronal processes (blue asterisks). h, Quantification of calcium decay time in neuronal soma (blue), processes with (light pink) or without (light blue) spheroids and spheroids (pink). Each dot represents a neuronal process from three independent experiments (one-way ANOVA). i, mTOR signaling in iPSC-derived axonal spheroids (SMI312). j, Western blot showing that Torin1 treatment reduces mTOR downstream effectors phosphorylated 4E-BP1 and phosphorylated p70 S6K, whereas their total protein levels remain unchanged. kr, Torin1 reduced axonal spheroids (SMI312) around Aβ deposits (thioflavin S). lp, Pre-Aβ administration Torin1 treatment quantification: l, axon with spheroid percentage (n = 3 in each group). Paired t-test two-tailed, P = 0.005. m, spheroid size (paired t-test two-tailed, P = 0.013, n = 4 per group). Dots represent experiments (20–30 ROIs). n, Axon number around plaques in each ROI (Torin1 n = 56; vehicle n = 55; unpaired t-test two-tailed, P = 0.880). o, Soma size. Dots represent neuronal somata (Torin1 n = 298, vehicle n = 316. Unpaired t-test two-tailed, P = 0.927; related to Extended Data Fig. 8i). p, Plaque size. Dots represent amyloid plaques (Torin1 n = 201, vehicle n = 253. Unpaired t-test two-tailed, P = 0.419). q,r, Post-Aβ administration Torin1 treatment (related to Extended Data Fig. 10). Spheroid number normalized to axon density (q) and spheroid size (r) (Mann–Whitney test, two-tailed, n = 4 per group). Scale bar, 5 μm, except scale bar, 10 μm in g. e,f,h,lr, Data presented as mean values ± s.e.m. See also Extended Data Figs. 9 and 10 and Supplementary Fig. 8. NS, not significant; ThioS, thioflavin S.
Fig. 7
Fig. 7. mTOR signaling inhibition reduces axonal spheroid pathology in vivo.
a, Schematic of neuronal-specific conditional knockout of Mtor in heterozygous floxed mice. b,c, Images showing neuronal-specific Cre-mediated Mtor knockout: homozygous (b) and heterozygous (c), using AAV9-hSyn-Cre-2A-tdTomato or AAV PHPeB-hSyn-Cre-EGFP in Mtor-floxed mice, respectively. b, mTOR expression (gray) was absent in Cre-expressing neurons compared to adjacent NeuN-labeled neurons without Cre expression. c, mTOR expression was reduced in Cre-expressing neurons compared to neurons without Cre expression. Scale bar, 5 μm. d, Experimental design to study mTOR knockout effects on individual spheroids. e, Images showing AAV9-hSyn-Cre-2A-tdTomato sparsely labeling individual spheroids (red) within a spheroid halo (Lamp1, gray). f, Quantification of spheroid size. Dots represent animals (mTOR-flox-AD n = 5, 5×FAD n = 4. Unpaired t-test, two-tailed, P = 0.027). g, Using the same data in f, comparison of spheroid size distribution and visualization using a quantile–quantile (Q–Q) plot. Dashed lines indicate spheroid area at 10 µm2. 5×FAD mice have significantly more large spheroids (area > 10 µm2) compared to mTOR-KO-AD (two-sample test for equality of proportions with continuity correction, two-tailed, P = 0.0004). h, Experimental design to assess the effect of Mtor knockout on spheroid halo size. i, Quantification of spheroid halo size. Dots represent animals (n = 3; unpaired t-test, two-tailed, P = 0.041). j, Quantified by axonal spheroid halos (knockout group n = 66 and control group n = 109. Unpaired t-test, two-tailed, P < 0.0001). k, Quantification of neuronal soma size. Dots represent animals (n = 3). Unpaired t-test, two-tailed, P = 0.90. lo, Investigation of mTOR heterozygous knockout downstream signaling effectors. Immunofluorescence intensity of TFEB (l), LC3B (m), P-p70S6K Thr389 (n) and p70S6K (o). Littermates and sex were paired in lo, paired t-test. Dots represent animals (n = 3 in each group). p, RNAscope in 5×FAD mice cortices showing mRNA species (poly(A) probe, magenta) present in spheroids (NHS ester-labeled, yellow, and DAPI negative). NHS ester (yellow) labels the spheroid halo and amyloid plaques. Nuclei are labeled with DAPI (blue). Scale bar, 5 µm. q, Quantification of poly(A) probe fluorescence intensity versus negative control probe within spheroids in cortices of 5×FAD mice (n = 3). Unpaired t-test, parametric, two-tailed, P = 0.001. r, Representative images showing puromycin labeling. Scale bar, 5 µm. s, Quantification of puromycin fluorescence intensity in axonal spheroids of 5×FAD mice (n = 3). Unpaired t-test, parametric, two-tailed, P = 0.028. j,q,s, Data are presented as mean values ± s.e.m. See also Supplementary Figs. 10–12. mo, months; NS, not significant.
Fig. 8
Fig. 8. Schematic of the molecular architecture of plaque-associated axonal spheroids.
Proximity labeling proteomics reveals proteins associated with various subcellular organelles, the ubiquitin–proteosome system and cytoskeleton. These proteins and their signaling pathways are linked to biological functions, including protein turnover and vesicle fusion (green box); cytoskeletal dynamics (yellow box); lipid localization and transport (red box); and others (gray box). Highlighted here are selected newly identified and validated proteins, alongside those previously known to be enriched in PAASs, such as lysosomal proteins LAMP1 (ref. ), cathepsin B and D, RAGC and PLD3 (refs. ,); autophagosome protein ATG9A; endoplasmic reticulum proteins RTN3 (ref. ) and RTN1 (ref. ); cytoskeletal neurofilament protein; microtubule protein TUBB3 (ref. ); synaptic proteins synaptophysin and VAMP2 (ref. ); as well as APP, Tau (MAPT) and ubiquitin, (Supplementary Table 2).
Extended Data Fig. 1
Extended Data Fig. 1. PLD3 expression and proximity labeling of axonal spheroids versus neuronal somata.
A-B. Proximity labeling of PLD3 (red) in (A) axonal spheroids versus (B) neuronal somata. C. Proximity labeling of NeuN (green, a neuronal soma marker). (A-C) Scale bar 5 μm. D. No biotinylation reaction control shows that the streptavidin signal was eliminated. Scale bar 50 μm. E-G. Comparison of PLD3 expression in axonal spheroids versus neuronal soma. Representative images of PLD3 immunofluorescence staining in AD postmortem brains with (E) dense amyloid plaques (ThioflavinS stained) and (F) sparse amyloid plaques. Inserts show axonal spheroid halos around amyloid plaques (yellow squares) or neuronal soma (blue squares). Scale bar 50 μm. G. Quantification of PLD3 expression in axonal spheroids versus neuronal soma/neuropil in AD human postmortem brains (n = 3 brains). Data are presented as mean values with SEM.
Extended Data Fig. 2
Extended Data Fig. 2. Super-resolution STED imaging reveals high spatial precision of proximity labeling in AD human brain.
A. Imaging of beads illustrates the resolution contrast between confocal microscopy (250 nm) and STED microscopy (50 nm). Scale bar = 250 nm. B-C. Representative confocal and STED images showing proximity labeling of axonal spheroids (magenta, anti-PLD3 labeled) in AD human postmortem brains. Biotinylated proteins were labeled by streptavidin (green). Scale bar = 2 μm. C. A line plot representative of the radius measurements illustrates the signals from both the secondary antibody channel (magenta) and the streptavidin channel (green). D. Dot plot depicting the radius ratio between the secondary antibody channel (magenta) and the streptavidin channel (green). Average radius ratio = 141.0 nm, average ratio = 1.04, standard deviation = 0.04. The median value is represented by the orange line, the lower and upper edges corresponding to the 25th (Q1) and 75th (Q3) percentiles, respectively. Whiskers extend to the minima and maxima within 1.5 times the IQR from the lower and upper quartiles. Data points beyond the whiskers are plotted as individual outliers (denoted by pink circles), and are subsequently excluded. Each dot represents a spheroid, n = 39.
Extended Data Fig. 3
Extended Data Fig. 3. Correlation analysis of proteomics samples in humans and mice.
Correlation analysis among biological replicates of PLD3-labeled and no antibody-labeled proteomic samples in (A) humans and (B) mice. Pearson correlation coefficient R2 of each comparison is listed in each box.
Extended Data Fig. 4
Extended Data Fig. 4. Proteomics analysis of PLD3-labeled PAAS proteomes in 5XFAD mice.
A. Volcano plot show proteins (represented by their gene names) that passed the statistical cutoffs (yellow dots) in 5XFAD mice. The top 10 proteomic hits with the lowest p-value and highest fold changes are indicated by their gene names in black. The selected known PAAS proteins are labeled as green dots and their gene names in green. The black dots among the yellow ones represent proteins being filtered by the statistical cutoff as shown in Fig. 2b. (See Table S1 for full list of proteomic hits). B. Venn diagram shows shared proteomics hits between AD humans and mice. C. Pathway enrichment analysis of PAAS proteome in 5XFAD mice. The Enrichment Map represents a network of pathways where edges connect pathways with many shared genes. Node color reflects the FDR of each pathway. The theme labels were curated based on the main pathways of each subnetwork. Subnetworks with a minimum of four pathways connected by edges are shown. D. IPA pathway analysis of the PAAS proteome in 5XFAD mice. Top 30 CNS-related signaling pathways are shown. The signaling pathways are summarized as 4 modules. The alluvium plot shows different modules connect to the differentially expressed genes (DEGs) and the DEGs connects to the pathways that they are involved. E. IPA pathways related to the three modules with a p-value less than 0.01 are listed. Heatmaps indicate either the -log10 (p-value) or the z score of each signaling pathway (pathways with a z score in red are predicted to be activated while blue ones are predicted to be inhibited). (A, E) Quantification was performed two-sided.
Extended Data Fig. 5
Extended Data Fig. 5. Comparison between anti-Lamp1 antibody labeled proteome with the anti-PLD3 antibody labeled PAAS proteomes in 5XFAD mice.
A-B. Proximity labeling of Lamp1 (red) in (A) 5XFAD and (B) wild type mice. Lamp1 (red) labeled (A) axonal spheroid halo in 5XFAD mice and (B) lysosomes in neuronal cell bodies. Biotinylated proteins were labeled by streptavidin. Scale bar 5 μm. C. Volcano plot shows proteins that passed the statistical cutoffs (yellow dots) in 5XFAD mice. The gene names of the top 10 proteomic hits with the lowest p-value and highest fold changes are shown in black. The selected known PAAS proteins are shown as dark blue dots with their gene names labeled in blue. Quantification was performed two-sided. (See Table S1 for full list of proteomic hits). D. Venn diagram showing comparison of the anti-Lamp1 antibody labeled proteomes with the anti-PLD3 antibody labeled PAAS proteomes in 5XFAD mice. Selected known PAAS proteins are shown in blue, newly identified proteins are shown in black, glial marker proteins are shown in purple and dendritic marker protein is shown in green.
Extended Data Fig. 6
Extended Data Fig. 6. Comparison between anti-biotin beads pulldown with streptavidin beads pulldown of anti-PLD3 antibody labeled proteomes in AD human brains.
A. Schematic showing pipelines for using streptavidin beads or anti-biotin beads to pulldown anti-PLD3 antibody labeled proteomes in AD human brains. For streptavidin beads, tissue sections were lysed and then incubated with streptavidin beads. For anti-biotin beads, protein lysate was digested prior to anti-biotin beads pull down. B. Comparison of the proteomes captured using anti-biotin beads and those captured with streptavidin beads. Among the total 821proteomic hits identified in the human PAAS proteome, 665 hits were pulldown by both the streptavidin beads method and the anti-biotin beads method. Selected known PAAS proteins (blue) and newly identified proteins (black) are shown in the box.
Extended Data Fig. 7
Extended Data Fig. 7. Proteomics analysis of NeuN-labeled neuronal nuclei and perinuclear cytoplasm proteomes in mice.
A. The NeuN-labeled neuronal nuclei and perinuclear cytoplasm proteomes in wildtype C57BL/6 J mice contain 292 proteomic hits. Comparison between the NeuN-labeled proteome and the PLD3-labeled PAAS proteome in mice showed 159 proteins are shared. Among the 133 unique protein hits in the anti-NeuN-labeled proteome, the protein bait and neuronal soma marker NeuN was detected, along with many nuclear and ribosomal proteins. B Gene Ontology analysis shows the top ranked biological process terms of the anti-NeuN-labeled proteomic dataset.
Extended Data Fig. 8
Extended Data Fig. 8. Lipid transport-related proteins are expressed in axonal spheroids around amyloid plaques in AD human postmortem brains.
A. Representative immunofluorescence confocal images of the top-ranked lipid-related proteomic hits, including APOE, HDLBP, C3, HEXB and TMEM30A in AD humans. Lipid transport-related proteins are shown in red. Neurofilament marker SMI312 (grey) indicates the neuronal branches, and axonal spheroid structures around amyloid plaques (ThioflavinS, blue). Scale bar = 5 μm. Quantification was performed in n = 3 AD human brains. Protein expression quantifications can be found in Table S2. B. Immunofluorescence confocal image shows HEXB (grey) expressed in neuronal cell bodies (NeuN, green) and axonal spheroids (SMI312, green) in AD human postmortem brain (n = 3). Two different HEXB antibodies were used for validation. Scale bar = 5 μm.
Extended Data Fig. 9
Extended Data Fig. 9. Characterization of the human iPSC-derived neuron-astrocyte coculture AD model.
A. Immunofluorescence confocal deconvolved image shows iPSC-derived human neurons (neurofilament H (NFH) labeled) robustly expressing pre- and post-synaptic markers (Synapsin1/2 and PSD95) at day 150 of coculture. Scale bar 2.5 μm. B-C. Immunofluorescence confocal image shows neuronal cell bodies and dendritic processes (MAP2 labeled), as well as axonal processes (SMI312 labeled) of iPSC-derived human neurons. (B) A low-zoom field of view (FOV). Scale bar 50 μm. (C) Two high-zoom FOVs showing dendritic and axonal processes. Scale bar 5 μm. D. Immunofluorescence confocal image shows the presence of both neurons (grey, SMI312) and astrocytes (red, S100b) in the coculture. Scale bar 50 μm. E. Immunofluorescence confocal images show 6e10 positive (grey) and ThioflavinS positive (blue) amyloid beta deposits formed in human iPSC-derived AD model following treatment with amyloid beta 1-42 peptides. Axonal processes were labeled with neurofilament (NFH, red). Scale bar 5 μm. F. Immunofluorescence confocal image shows axonal processes formed spheroids (NFH, red) around amyloid plaque deposit (ThioflavinS, blue). Scale bar 5 μm. G. Immunofluorescence confocal deconvolved images show phosphorylated Tau S235, S396 and S404 (red) expression in PAAS derived from human neurons (grey, SMI312). Zoom out images were maximum projected, while the zoom in images show a single plane. Scale bar 5 μm. H-I. Immunofluorescence confocal deconvolved images of AAV2-CB7-GFP infected (H) human neurons with abundant axonal spheroids (green, anti-GFP staining), co-stained with the axonal spheroid marker SMI312 (grey); (I) cell bodies of human neurons, as revealed by both anti-GFP (green) and anti-NeuN (grey) staining, related to Fig. 6o. Scale bar (H) 5 μm and (I) 50 μm.
Extended Data Fig. 10
Extended Data Fig. 10. High throughput automated quantification of axonal spheroids, axons and amyloid plaques in human iPSC-derived AD model.
A. Schematic showing the workflow of immunofluorescence labeling of axonal spheroids, axons and amyloid plaques in human iPSC-derived AD model, followed by confocal imaging and machine learning-based image analysis and quantification. B-C. Zoom in (B) and zoom out (C) images of immunofluorescence confocal imaging showing SMI312 antibody labeled axonal spheroids and axons (white), ThioflavinS labeled amyloid plaque (blue). Objects of axonal spheroids (red), axons (yellow) and amyloid plaques (purple) were generated according to the raw images after image annotation and analysis. Scale bars = 100 μm. D-E. Quantification showing (D) axon and (E) amyloid plaque volume (related to the experiment in Figs. 6q and 6r). Mann Whitney test (two-tailed) was used for all the statistical analysis. Data are presented as mean values +/- SEM.

References

    1. Knopman, D. S. et al. Alzheimer disease. Nat. Rev. Dis. Primers7, 33 (2021). - PMC - PubMed
    1. Spires-Jones, T. L. & Hyman, B. T. The intersection of amyloid beta and tau at synapses in Alzheimer’s disease. Neuron82, 756–771 (2014). - PMC - PubMed
    1. Tsai, J. et al. Fibrillar amyloid deposition leads to local synaptic abnormalities and breakage of neuronal branches. Nat. Neurosci.7, 1181–1183 (2004). - PubMed
    1. Yuan, P. et al. PLD3 affects axonal spheroids and network defects in Alzheimer’s disease. Nature612, 328–337 (2022). - PMC - PubMed
    1. Adalbert, R. et al. Severely dystrophic axons at amyloid plaques remain continuous and connected to viable cell bodies. Brain132, 402–416 (2009). - PubMed

Substances

LinkOut - more resources