. 2025 May;44(9):2473-2500.
doi: 10.1038/s44318-025-00406-3. Epub 2025 Mar 10.

Surface-mediated bacteriophage defense incurs fitness tradeoffs for interbacterial antagonism

Affiliations

Surface-mediated bacteriophage defense incurs fitness tradeoffs for interbacterial antagonism

Chia-En Tsai et al. EMBO J. 2025 May.

Abstract

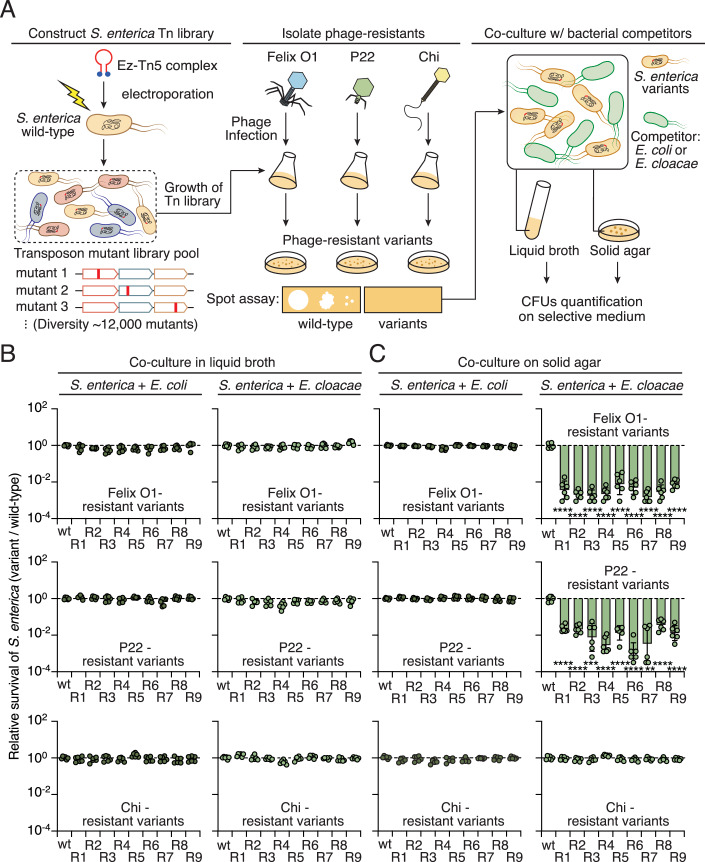
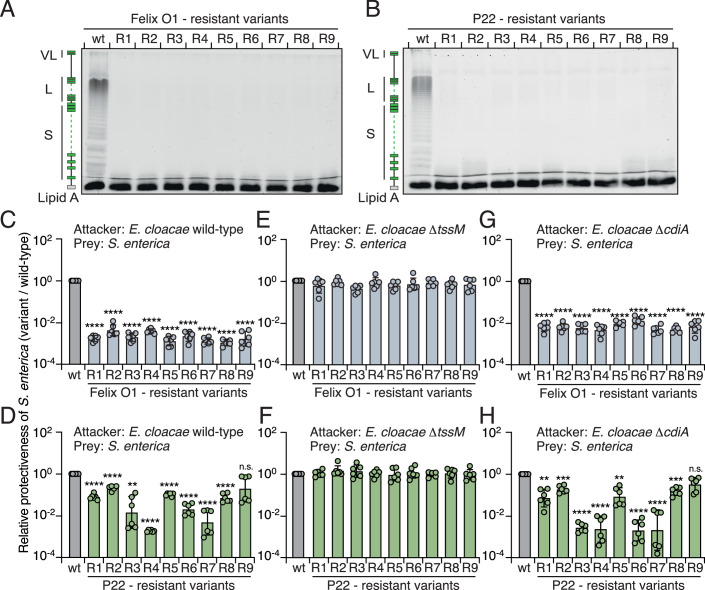
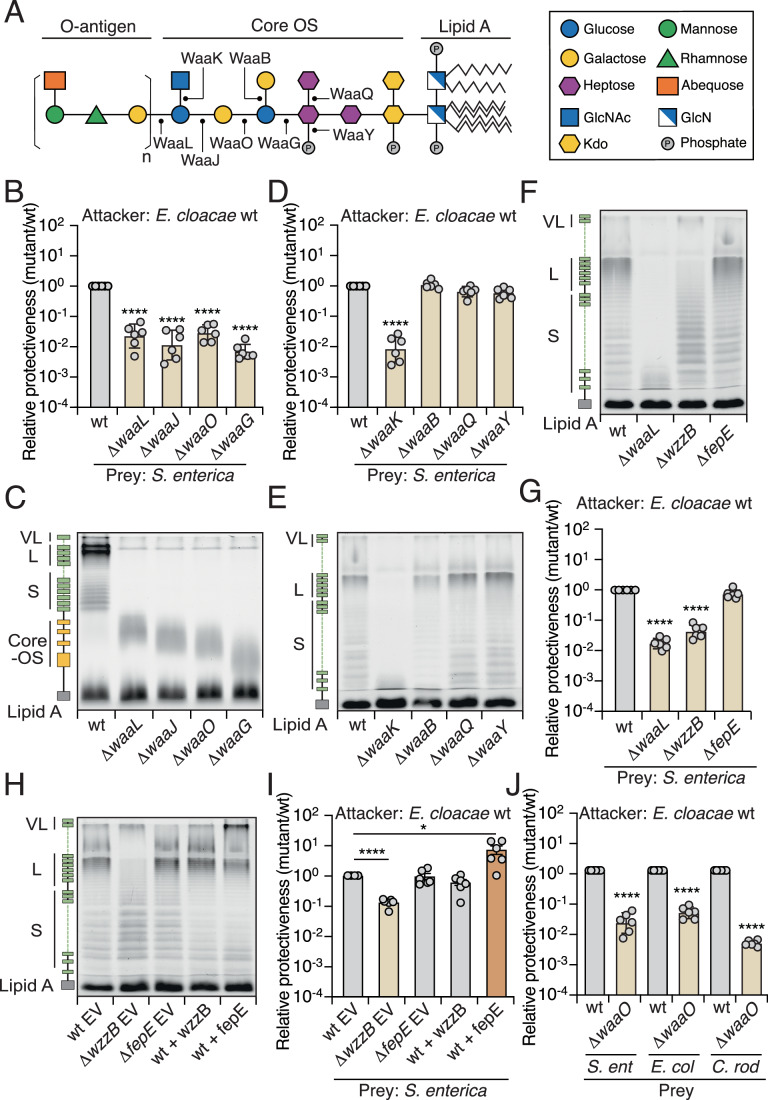
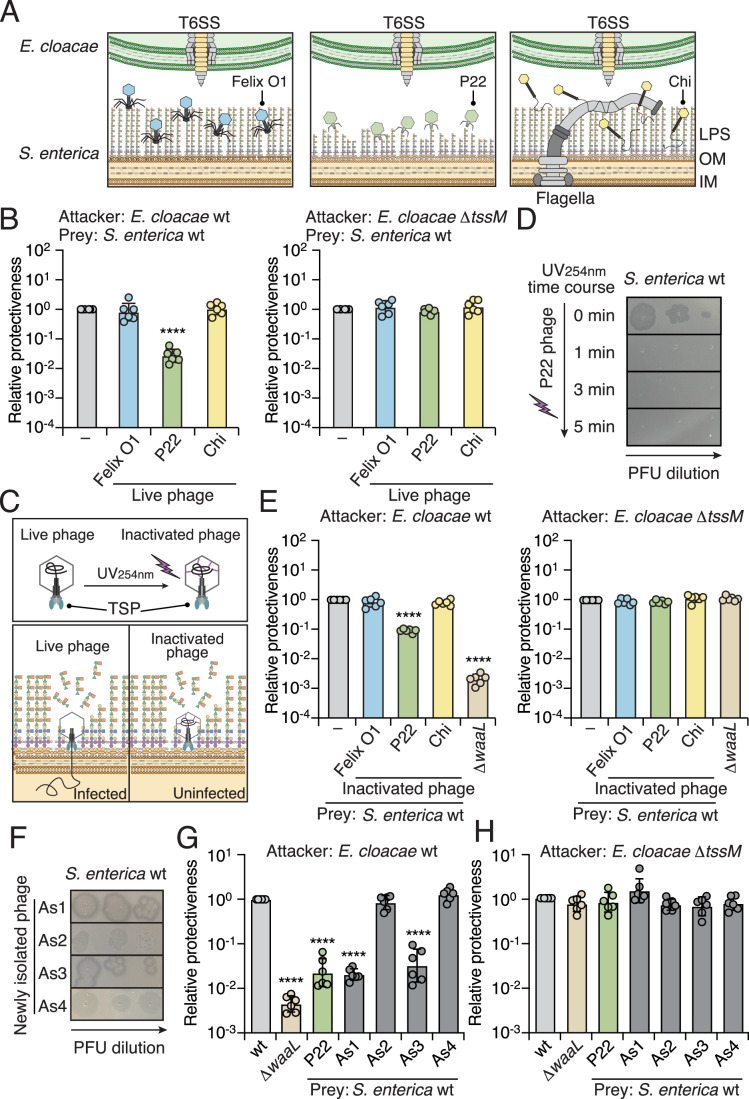
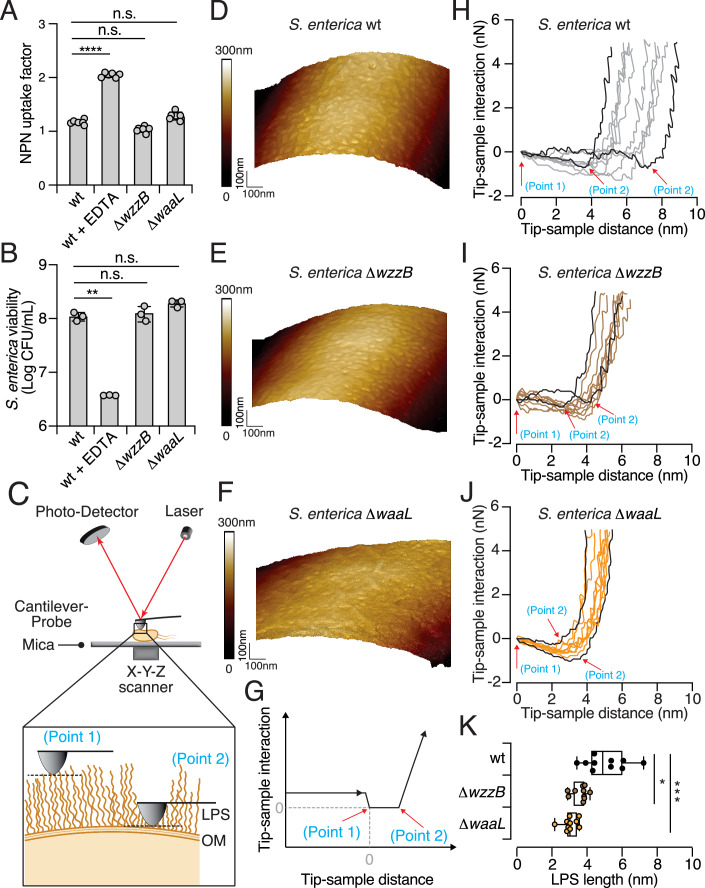
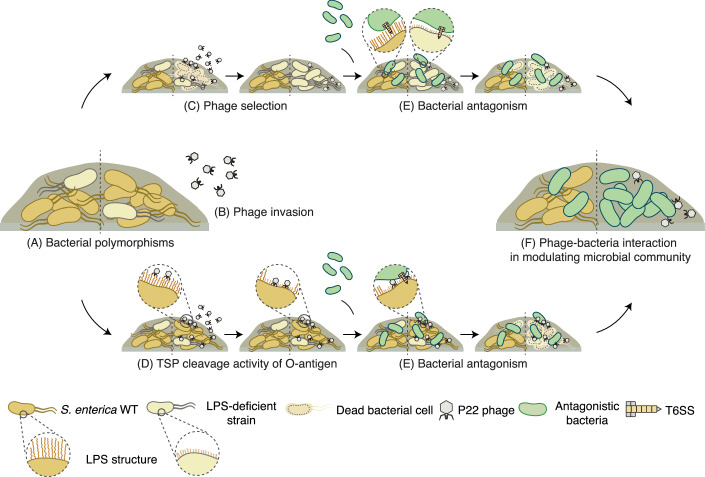
Bacteria in polymicrobial habitats are constantly exposed to biotic threats from bacteriophages (or "phages"), antagonistic bacteria, and predatory eukaryotes. These antagonistic interactions play crucial roles in shaping the evolution and physiology of bacteria. To survive, bacteria have evolved mechanisms to protect themselves from such attacks, but the fitness costs of resisting one threat and rendering bacteria susceptible to others remain unappreciated. Here, we examined the fitness consequences of phage resistance in Salmonella enterica, revealing that phage-resistant variants exhibited significant fitness loss upon co-culture with competitor bacteria. These phage-resistant strains display varying degrees of lipopolysaccharide (LPS) deficiency and increased susceptibility to contact-dependent interbacterial antagonism, such as the type VI secretion system (T6SS). Utilizing mutational analyses and atomic force microscopy, we show that the long-modal length O-antigen of LPS serves as a protective barrier against T6SS-mediated intoxication. Notably, this competitive disadvantage can also be triggered independently by phages possessing LPS-targeting endoglycosidase in their tail spike proteins, which actively cleave the O-antigen upon infection. Our findings reveal two distinct mechanisms of phage-mediated LPS modifications that modulate interbacterial competition, shedding light on the dynamic microbial interplay within mixed populations.

Keywords: Bacterial Immunity; Interbacterial Antagonism; Lipopolysaccharide; Phage; Tail Spike Protein.


Conflict of interest statement

Disclosure and competing interests statement. The authors declare no competing interests.

Figures

Figure 1
Figure 1. Isolation of phage-resistant S. enterica for pairwise co-culture experiments.
(A) Schematic workflow for isolating phage-resistant strains from a transposon library (Tn-library) pool containing approximately 12,000 mutants. Detailed procedures are provided in “Methods”. Phages from different families of Caudovirales were used for selection: Felix O1, P22, and Chi (Fig. EV1A). Spot assays were employed to validate the resistance of the isolated strains to phage infections (Fig. EV1B). Validated resistant variants were subsequently co-cultured with E. coli or E. cloacae in liquid broth or on solid agar. The survival of S. enterica was quantified by counting CFUs on selective media. (B, C) Relative survival of the indicated S. enterica strains compared to wild-type S. enterica grown in co-culture with E. coli or E. cloacae in LB broth (B) or solid agar (C). Relative survival was determined by comparing CFU ratios of phage-resistant variants and the wild-type control. Data in (B, C) are represented as means ± SD (n = 6). Significance was calculated based on an unpaired two-tailed Student’s t test. Asterisks indicate statistically significant differences between the survival of a mutant strain and the wild-type control (for P22-R7, P = 0.00017. **P < 0.001, ***P < 0.0001, ****P < 0.00001). Source data are available online for this figure.
Figure 2
Figure 2. Phage-resistant strains exhibit LPS deficiency and increased susceptibility to T6SS-mediated antagonism by E. cloacae.
(A, B) 12% LPS PAGE profiles showing the levels of LPS produced by the indicated S. enterica strains: (A) LPS from the Felix O1-resistant strains; (B) LPS from the P22-resistant strains. A schematic representation of LPS is shown on the left. (CH) Protectiveness of the indicated S. enterica phage-resistant strains relative to the wild-type strain after competition with E. cloacae wild-type (C, D), ∆tssM (E, F), and ∆cdiA (G, H) strains. Data in (CH) are presented as means ± SD (n = 6). Significance was calculated based on an unpaired two-tailed Student’s t test. Asterisks indicate statistically significant differences between the relative protective index of a mutant strain and the wild-type control (D, P = 0.0004 for P22-R3. (H) P = 0.0002 for P22-R1, and P = 0.0004 for P22-R5. **P < 0.001, ***P < 0.0001, ****P < 0.00001, and ns not statistically significant). Source data are available online for this figure.
Figure 3
Figure 3. LPS protects bacteria from T6SS-mediated assaults.
(A) Schematic representation of the LPS structure in S. enterica. Glycosyltransferases involved in LPS biosynthesis are indicated. (B, D, G, I) Protectiveness of the indicated S. enterica mutant or indicated protein overexpressing strains relative to the wild-type strain after competition with wild-type E. cloacae. (C, E, F, H) LPS PAGE profiles: (C) 20% gel; (E, F, H) 12% gel, showing LPS levels produced by the indicated S. enterica mutant or indicated protein overexpressing strains. EV empty vector. (J) Protectiveness of the indicated bacterial species (∆waaO mutant) relative to the wild-type strain after competition with wild-type E. cloacae. Data in (B, D, G, I, J) are presented as means ± SD (n = 6). Significance was calculated based on an unpaired two-tailed Student’s t test. Asterisks indicate statistically significant differences between the relative protective index of a mutant strain and the wild-type control (I, P = 0.008 for WT+fepE. *P < 0.05, ****P < 0.00001). Source data are available online for this figure.
Figure 4
Figure 4. Purified TSP increases the susceptibility of S. enterica to T6SS-mediated intoxication.
(A) Schematic illustration of phage P22. (B) Crystal structure of the P22 TSP (PBD: 1TYX) (Steinbacher et al, 1996) with the O-antigen substrate bound in the catalytic pocket. The D392 residue is highlighted in pink. (C) Schematic representation of O-antigen digestion by phage P22 hosting an enzymatically active TSP. (D) 12% LPS PAGE profiles showing LPS levels from wild-type S. enterica treated with different concentrations of purified TSP (wild-type or D392N mutant) for 10 min at room temperature. LPS extracted from the ∆waaL strain is shown as a control. (E) Tenfold serial dilution spot assay of P22 phage on wild-type S. enterica treated with 10 nM purified TSP. The image is representative of triplicate experiments. (F, G) Protectiveness of the wild-type S. enterica strain treated with purified TSP (wild-type or D392N mutant) relative to the mock-treated S. enterica after competition with E. cloacae wild-type (F) or ∆tssM (G) strains. Data in (F, G) are presented as means ± SD (n = 6). Significance was calculated based on an unpaired two-tailed Student’s t test. Asterisks indicate statistically significant differences between the relative protective index of TSP-treated S. enterica and the mock-treated control (****P < 0.00001). Source data are available online for this figure.
Figure 5
Figure 5. Phage P22 sensitizes S. enterica to T6SS-mediated attacks in mixed populations.
(A) Schematic representation of phages with or without LPS-targeting endoglycosidase during infection of S. enterica. E. cloacae carrying a functional T6SS is depicted at the top. (B) Protectiveness of the wild-type S. enterica strain treated with different phages (Felix O1, P22, or Chi) relative to the mock-treated S. enterica after competition with E. cloacae wild-type or ∆tssM strains. (C) Schematic of P22 with UV254nm treatment. (D) Tenfold serial dilution spot assay of UV-inactivated P22 phage on wild-type S. enterica. The image is representative of triplicate experiments. (E) Protectiveness of the wild-type S. enterica strain treated with UV-inactivated phage particles (Felix O1, P22, or Chi) relative to the mock-treated S. enterica after competition with E. cloacae wild-type or ∆tssM strains. (F) Tenfold serial dilution spot assay of phages As1, As2, As3, and As4. (G, H) Protectiveness of the wild-type S. enterica strain treated with different phages (P22, As1, As2, As3, or As4) relative to the mock-treated S. enterica after competition with E. cloacae wild-type (G) or ∆tssM (H) strains. Data in (B, E, G, H) are presented as means ± SD (n = 6). Significance was calculated based on an unpaired two-tailed Student’s t test. Asterisks indicate statistically significant differences between the relative protective index of phage-treated or UV-inactivated phage-treated S. enterica and the mock-treated control (****P < 0.00001). Source data are available online for this figure.
Figure 6
Figure 6. Evidence that the O-antigen of LPS serves as a physical barrier.
(A, B) Measurements of outer membrane permeability of the S. enterica wild-type, ∆wzzB, and ∆waaL strains. EDTA (1 mM) was added to the wild-type as the control. (A) NPN uptake assay; (B) VAN sensitivity assay. (C) Schematic representation of the atomic force microscopy (AFM) setup. S. enterica cells were immobilized on freshly prepared mica substrates. A laser beam reflected on the back of the cantilever is used to measure the force interactions between the probe and sample. The feedback control system between the photodetector and the X–Y–Z scanner enables precise detection of the surface morphology of the cells. A zoomed-in view of AFM measurement of the bacterial surface is also shown. (DF) Images of AFM height for the S. enterica wild-type (D), ∆wzzB (E), and ∆waaL (F) strains, as obtained using the PeakForce Tapping (PFT) mode. The image scan size is 1 µm × 1 µm. (G) Schematic of the AFM force-distance curve obtained from S. enterica samples using the Force Volume (FV) mapping mode. The point at which the tip contacts the sample is defined as zero (point 1), and slope changes indicate a transition to a stiffer substrate (point 2). (HJ) Force-distance curves for the S. enterica wild-type (H), ∆wzzB (I), and ∆waaL (J) strains. Ten curves were captured from each sample at randomly selected locations, with the longest and shortest LPS lengths highlighted. Red arrows mark points 1 and 2. (K) LPS length of the S. enterica wild-type, ∆wzzB, and ∆waaL strains was determined from force-distance curves by measuring the distance between point 1 and point 2. Data are shown as box with whiskers (n = 10). The box is determined by the 25 and 75 percentiles, and the whiskers are determined by min and max; the line in the box indicates the median. Data in (A, B) are presented as means ± SD (n = 6 in (A), and n = 3 in (B)). Significance was calculated based on an unpaired two-tailed Student’s t test. Asterisks indicate statistically significant differences between wild-type strain and each mutant (B, P = 0.0007 for WT + EDTA. (K) P = 0.0017 for ∆wzzB. *P < 0.05, **P < 0.001, ***P < 0.0001, ****P < 0.00001 and ns not statistically significant). Source data are available online for this figure.
Figure 7
Figure 7. Working model of how phages modulate interbacterial competition within microbial communities.
Bacterial interactions are shaped either by the absence (left) or presence (right) of phages. (A) Bacteria inhabit polymorphic environments. (B) In the presence of P22 phage, bacterial surfaces can be modified via two distinct mechanisms. (C) LPS-modified strains are selected due to their resistance to phage adsorption, leading to their dominance within S. enterica populations. (D) TSP from P22 phage specifically cleaves the bacterial O-antigen of LPS, resulting in a shortened structure. (E) LPS deficiency increases the susceptibility of S. enterica to contact-dependent killing by bacterial competitors in close proximity. (F) Phage-mediated surface modifications influence the outcome of interbacterial competition, driving dynamic shifts in mixed bacterial populations.
Figure EV1
Figure EV1. Validation of phage resistance in isolated mutants and monocultural growth experiments.
(A) TEM images of model phages used in the study: Felix O1 (left), P22 (middle), and Chi (right). Scale bar = 0.1 μm. (B) Tenfold serial dilution spot assay of phages Felix O1 (left), P22 (middle), and Chi (right) on the indicated phage-resistant S. enterica strains. The image is representative of triplicate experiments. (C) Growth curves of the indicated phage-resistant S. enterica strains in LB broth at 37 °C. Wild-type, ∆waaL, and ∆waaG strains are shown as controls. (D) CFUs of the indicated phage-resistant S. enterica strains grown at 37 °C for 12 h on LB agar plates. Wild-type, ∆waaL (∆L), and ∆waaG (∆G) strains are shown as controls.
Figure EV2
Figure EV2. Characterization of transposon insertion mutations in phage-resistant S. enterica isolates.
(A) Schematic workflow for identifying phage-resistant mutations. Detailed procedures are provided in the Methods section. (B) Mutated genes in the P22-resistant and Felix O1-resistant S. enterica isolates. Scale bar = 500 bp. (C) Mutated genes in the Chi-resistant S. enterica isolates. Scale bar = 1000 bp. (D) 12% LPS PAGE profiles showing LPS levels from the indicated Chi-resistant S. enterica strains. A schematic representation of LPS is shown on the left. (E, F) Macroscopic aggregation analysis to assess LPS deficiency in the indicated Felix O1-resistant (E) or P22-resistant (F) S. enterica strains. The images are representative of triplicate experiments.
Figure EV3
Figure EV3. LPS-deficient S. enterica mutants exhibit no significant growth or competition defects.
(AC) Growth curves of the indicated S. enterica LPS mutants in LB broth at 37 °C. The wild-type strain is shown as a control. (DF) Protectiveness of the indicated S. enterica mutant strains relative to the wild-type strain after competition with E. cloacaetssM. Data in (DF) are presented as means ± SD (n = 6).
Figure EV4
Figure EV4. LPS-deficient bacteria exhibit fitness deficits in competition with antagonistic bacteria carrying active T6SS.
(A) 12% LPS PAGE profile displaying LPS levels produced by the indicated S. enterica, E. coli, and C. rodentium strains. (B) Protectiveness of the indicated bacterial species (∆waaO mutant) relative to the wild-type strain after competition with E. cloacaetssM. (C, D) Protectiveness of the indicated bacterial species (∆waaO mutant) relative to the wild-type strain after competition with B. thailandensis wild-type (C) or ∆tssM (D) strains. Data in (BD) are presented as means ± SD (n = 6). Asterisks indicate statistically significant differences in the relative protective index between the mutant and wild-type strains (P < 0.05).
Figure EV5
Figure EV5. The slope of AFM force-distance curves.
Two distinct slopes from each force-distance curve were obtained for the S. enterica wild-type, ∆wzzB, and ∆waaL strains. Ten curves were divided into two segments by point 2, as shown in Fig. 6G. The slope measured from the first segment corresponds to the LPS layer (left), whereas the second segment represents the outer membrane (right).

References

    1. Ali J, Yu M, Sung LK, Cheung YW, Lai EM (2023) A glycine zipper motif is required for the translocation of a T6SS toxic effector into target cells. EMBO Rep 24:e56849 - PMC - PubMed
    1. Allsopp LP, Bernal P (2023) Killing in the name of: T6SS structure and effector diversity. Microbiology 169:001367 - PMC - PubMed
    1. Aoki SK, Pamma R, Hernday AD, Bickham JE, Braaten BA, Low DA (2005) Contact-dependent inhibition of growth in Escherichia coli. Science 309:1245–1248 - PubMed
    1. Basler M, Pilhofer M, Henderson GP, Jensen GJ, Mekalanos JJ (2012) Type VI secretion requires a dynamic contractile phage tail-like structure. Nature 483:182–186 - PMC - PubMed
    1. Bastin DA, Stevenson G, Brown PK, Haase A, Reeves PR (1993) Repeat unit polysaccharides of bacteria: a model for polymerization resembling that of ribosomes and fatty acid synthetase, with a novel mechanism for determining chain length. Mol Microbiol 7:725–734 - PubMed

MeSH terms

LinkOut - more resources