. 2025 May;31(5):1677-1687.
doi: 10.1038/s41591-025-03568-z. Epub 2025 Mar 10.

LILRB3 genetic variation is associated with kidney transplant failure in African American recipients

Affiliations

LILRB3 genetic variation is associated with kidney transplant failure in African American recipients

Zeguo Sun et al. Nat Med. 2025 May.

Erratum in

  • Author Correction: LILRB3 genetic variation is associated with kidney transplant failure in African American recipients.
    Sun Z, Yi Z, Wei C, Wang W, Ren T, Cravedi P, Tedla F, Ward SC, Azeloglu E, Schrider DR, Li Y, Khan A, Zanoni F, Fu J, Ali S, Liu S, Liang D, Liu T, Li H, Xi C, Vy TH, Mosoyan G, Sun Q, Kumar A, Zhang Z, Farouk S, Campell K, Ochando J, Lee K, Coca S, Xiang J, Connolly P, Gallon L, O'Connell PJ, Colvin R, Menon MC, Nadkarni G, He JC, Kraft M, Jiang X, Zhang X, Kiryluk K, Cherukuri A, Lakkis FG, Zhang W, Chen SH, Heeger PS, Zhang W. Sun Z, et al. Nat Med. 2025 May;31(5):1712. doi: 10.1038/s41591-025-03706-7. Nat Med. 2025. PMID: 40234733 No abstract available.

Abstract

African American (AA) kidney transplant recipients exhibit a higher rate of graft loss compared with other racial and ethnic populations, highlighting the need to identify causative factors. Here, in the Genomics of Chronic Allograft Rejection cohort, pretransplant blood RNA sequencing revealed a cluster of four consecutive missense single-nucelotide polymorphisms (SNPs), within the leukocyte immunoglobulin-like receptor B3 (LILRB3) gene, strongly associated with death-censored graft loss. This SNP cluster (named LILRB3-4SNPs) encodes missense mutations at amino acids 617-618 proximal to a SHP1/2 phosphatase-binding immunoreceptor tyrosine-based inhibitory motif. The LILRB3-4SNPs cluster is specifically enriched within AA individuals and exhibited a strong association with death-censored graft loss and estimated glomerular filtration rate decline in the AA participants from multiple transplant cohorts. In two large Biobanks (BioMe and All-of-Us), the LILRB3-4SNPs cluster was associated with the early onset of end-stage renal disease and acted synergistically with the apolipoprotein L1 (APOL1) G1/G2 allele to accelerate disease progression. The SNPs were also linked to multiple immune-related diseases in AA individuals. Last, on multiomics analysis of blood and biopsies, recipients with LILRB3-4SNPs showed enhanced inflammation and monocyte ferroptosis. While larger and prospective studies are needed, our data provide insights on the genetic variation underlying kidney transplant outcomes.


Conflict of interest statement

Competing interests: Weijia Zhang reports personal fees from VericiDx and reports the patents (Patents US Provisional Patent Application F&R ref. 27527-0134P01, serial no. 61/951,651, filed March 2014; Method for identifying kidney allograft recipients at risk for chronic injury; US Provisional Patent Application: Methods for Diagnosing Risk of Renal Allograft Fibrosis and Rejection (miRNA); US Provisional Patent Application: Method for Diagnosing Subclinical Acute Rejection by RNA Sequencing Analysis of a Predictive Gene Set; US Provisional Patent Application: Pretransplant prediction of post- transplant acute rejection). M.C.M. receives research support from Natera. P. Cravedi is a consultant for Chinook therapeutics. L.G. is the non-executive Director and Chair of the science advisory board for Verici. The other investigators have no financial interest to declare.

Figures
Extended Data Figure 1.
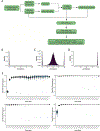
Extended Data Figure 1.. Evaluation and quantification of allele specific expression in the GoCAR cohort.
A) Overall work flow of eSNP identification and allele expression fraction (AEF) calculation. (B-D) The distribution of AEF of homozygous genotype of reference allele (0/0) (B), heterozygous genotype (0/1) (C) and homozygous genotype of alternative allele (1/1) (D) in the GoCAR cohort. Most alleles showing a balanced expression of reference and alternative alleles (AEF around 50%) while some alleles showed a higher expression of either the reference allele or the alternative allele (AEF > 50% or AEF < 50%), and a few sites exhibited mono-allelic expression at both ends (AEF=0 or AEF=1). This distribution aligns with previous studies on allele-specific expression. (E) The sensitivity and specificity of RNAseq-based genotyping by comparing to the SNP array-based genotyping for heterozygous (upper) and homozygous (lower) calls with various read coverage depths in the GoCAR cohort (n = 153 with both RNA-seq and SNP array data). Each dot represents a sample and box and whiskers plot showing the distribution (thick bar, median; box, 25th to 75th percentile, whiskers reach to the largest/smallest observations within 1.5 box-heights of the box). Overall, the RNAseq-based genotyping strategy achieved over 90% sensitivity and specificity for both heterozygous and homozygous detection with more than 10 reads. With 5–10 reads, we achieved over 75% sensitivity and 100% specificity for heterozygous calls, and 100% sensitivity and over 99% specificity for homozygous calls. These data indicate that our informatic pipeline effectively detected exonic SNPs from RNA-seq data in the GoCAR cohort with high sensitivity and specificity.
Extended Data Figure 2.
Extended Data Figure 2.. Comparison of post-transplant longitudinal eGFR values (mean of the records of each month) of AA kidney transplant patients (ICD Z94.0 or V42.0) carrying the LILRB3-4SNPs variant (“Risk”) vs reference (“Non-risk”, blue) allele in the BioMe cohort.
A) longitudinal eGFR values of risk and non-risk AA kidney transplant patients within 48 months after transplant. Bold curves indicate the fitted regression lines for two groups. Comparison (Students’ T test, two-sided) of average eGFR between risk (n=9) and non-risk (n=90) patients within 3 months (B), 3–24 months (C), and 3–48 months (D) after transplant. Each dot represents a sample and the box and whiskers plots showing the distribution (thick bar, median; box, 25th to 75th percentile, whiskers reach to the largest/smallest observations within 1.5 box-heights of the box).
Extended Data Figure 3.
Extended Data Figure 3.. Transcriptomic dysregulation of post-transplant blood and kidneys in AA recipients carrying LILRB3-4SNPs variant (“Risk”) vs reference (“Non-risk”) allele.
A) Gene Set Enrichment Analysis (GSEA) enrichment plot of the pathways showing gene upregulation involved in Th17 cell differentiation, T cell receptor signaling and B cell mediated immunity in bulk RNA sequencing of the blood samples collected after 6 months post-transplant in AA recipients with (n=10) vs without (n=10) LILRB3-4SNPs. GSEA analysis was performed on post-transplant blood expression profiles of the recipients with and without the SNP to identify the pathways associated with the SNP (P <0.05). B) UMAP of single cell RNA sequencing of the PBMCs isolated from 6 AA patients (with (n=3) and without (n=3) LILRB3-4SNPs) at 24-month after transplantation. C) Cell proportion of each cell type in two groups. The increased T cell and decreased monocyte populations were detected in the SNPs carrying recipients. D) Function enrichment of significant DEGs between patients with and without LILRB3-4SNPs in each cell type demonstrating gene dysregulation involved in T/B cell activation and ferroptosis. DEGs in the subpopulation was identified by two-sided Wilcoxon Rank Sum test at P value <0.05. The gene-function enrichment was evaluated with one-sided hypergeometric test. E) Heatmap showing the log2(fold change) of selected DEGs of B, T cell activation and ferroptosis signatures between SNP+ vs SNP− cells in each cell type. F) Significantly-dysregulated functions (NES: normalized GSEA enrichment score) in 3-month post-transplant biopsies from 6 AA recipients with (n=3) and without (n=3) the LILRB3-4SNPs. G) GSEA enrichment plot showing down-regulation of ferroptosis-negatively associated genes comparing the patient with (n=3) and without (n=3) LILRB3-4SNPs in 3-month biopsies. The shared transcriptional dysregulation among recipient’s pre- and post- transplant blood, transplanted kidneys implied the persistent inflammation in the blood stream post-transplant causes kidney damage. P values in GSEA and functional enrichment analysis are unadjusted.
Extended Data Figure 4.
Extended Data Figure 4.. In vitro functional analysis of THP-1 macrophage cell line overexpressing LILRB3-4SNPs variant (“Risk”) or reference (“Non-risk”) allele.
qPCR on expression changes for immune response (A) and ferroptosis-negatively-associated genes (B) upon LPS stimulation from 0 to 6 hours (left) or from 6 to 24 hours (right). The heatmap colors (blue color for positive values and brown for negative values, respectively) along with the numbers indicate the average of log2(fold changes) from duplicated biological experiments. Cell viability analysis within 48 hours upon LPS stimulation (C) and in conjunction with ferroptosis-inhibitor (lipro-1) treatment (D) in THP-1 cells overexpressing LILRB3-4SNPs variant (n = 4) or reference allele (n = 4) (Student’s t-Test, two sided). The bar plots represent the mean values of the cell viability measurements from four biological replicates and error bars represent one standard deviation. Following a 6 h LPS stimulation, all cell lines exhibited increased expression of crucial inflammatory response markers linked to the LILRB family, including TNFα and IL1β, and the expression of these genes decreased from 6 to 24 hours. The cell line overexpressing the variant allele produced greater quantities of TNFα, TNFAIP3 and IL1β upon 6-hour LPS treatment, with less attenuation between 6 and 24 hours than the reference allele, implicating increased inflammation associated with the SNPs (A). Expression of 5/6 ferroptosis negatively-associated genes in cell line with the SNPs decreased more between 6 and 24 hrs post LPS treatment, consistent with enhanced ferroptosis at 24 hours linked to the SNPs (B). Cell viability analysis demonstrated a reduced viability upon LPS stimulation in cells with the SNPs (C, upper, orange vs green) but not those without the SNPs (C, lower, orange vs green). This phenomenon for the SNPs was reversed by ferroptosis inhibitor, Liproxstatin-1 (Lipro-1, at 0.625 umol) that targets lipid peroxidation (D, orange bar, upper). Lipor-1 had no effect on the cells without SNPs (D, orange bar, lower).
Extended Data Figure 5.
Extended Data Figure 5.. The schematic model of the role of LILRB3 in inflammation and ferroptosis.
Activation of LILRB3 causes binding and activation of SHP1/2 phosphatases that, through crosstalk, limit inflammatory signals initiated by TLR stimuli (e.g., LPS) among other stimuli. The expression of the variant LILRB3-4SNPs risk allele reduces the capability of LILRB3’s intracellular ITIM domain to bind to and activate SHP1/2 phosphatases, resulting in amplification of the inflammatory response (e.g., TNFα and cytokine release) and JAK/STAT activation, facilitate induction of ferroptosis, ultimately leading to graft damages. This figure was created in BioRender https://BioRender.com/i68z465.
Figure 1.
Figure 1.. Cohort and study design.
4 independent kidney transplantation cohorts (GoCAR (n=264; 83 AAs), SIRPA (n=54; 54 AAs), CTOT19 (n=128; 47 AAs) and VericiDx (n=77; 77 AAs)), and two EHR-linked biobanks, BioMe (n=30,099; 7,096 AAs) and All-of-Us (n=245,388; 50,969 AAs) were included in this study. Pre-transplant blood RNAseq (n=170) in conjunction with SNP array data (n=588) were initially used to identify the AA-specific expressional SNPs (LILRB3-4SNPs) associated with post-transplant renal failure and eGFR decline, validated in SIRPA, CTOT19, VericiDx and BioMe. The association of LILRB3-4SNPs with the ESRD progression or other immune related diseases was evaluated in BioMe and All-of-Us AA cohort. The functional roles associated with LILRB3-4SNPs were investigated by meta-analysis on whole blood transcriptome by RNAseq (GoCAR, CTOT19 and VericiDx), single-cell RNA sequencing of pre- and post- transplant PBMC, post-transplant biopsies and in vitro functional experiments in THP1 macrophages cell line.
Figure 2.
Figure 2.. The association of expressional SNPs (eSNPs) in the pretransplant blood with graft loss in the GoCAR cohort.
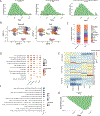
A) Manhattan plot of the eSNP association (- log10(P value)) with DCGL by univariate Cox regression model in the GoCAR RNAseq cohort (n=170); Each dot represents a SNP aligned with its genome coordinate. B) The enriched functions of the genes harboring significant eSNPs (P value ≤ 0.05); Enrichment was evaluated by one-sided hypergeometric test. C) The occurrence of significant eSNPs in the top 20 recurrent genes.
Figure 3.
Figure 3.. Identification of a cluster of 4 consecutive missense SNPs in LILRB3 gene (named LILRB3-4SNPs) associated with post-transplant renal failure.
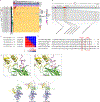
A) Two-way cluster view of the AEF data by 25 DCGL-associated eSNPs (Cox regression, P<0.05,) within LILR gene families (horizontal) and patient’s demographics/outcomes (vertical). The grey color represents missing values); B) Sequencing alignment of reads covering 4 consecutive SNPs and their adjacent SNPs within LILRB3 by IGV (chr19:54720990–54721060, hg19); C) Heatmap of the R2 and D’ (R squared and D prime measuring the linkage of SNPs) between the LILRB3-4SNPs and their 2 adjacent SNPs; D) Protein structure modeling of the interaction of SHP-2 with LILRB3 harboring LILRB3-4SNPs reference (left) or alternative (right) allele. E) Protein sequence alignment of LILRB3 orthologs across organisms, human (Homo sapiens), chimpanzee (Pan troglodytes), monkey (Macaca mulatta), dog (Canis lupus dingo), rat (Rattus norvegicus) and mouse (Mus musculus). E617 is conserved across species and close to the fourth immunoreceptor tyrosine-based inhibitory motif (ITIM) in LILRB3 protein.
Figure 4.
Figure 4.. The association of LILRB3-4SNPs with post-transplant renal failure in the GoCAR cohort.
A) AEF of the LILRB3-4SNPs within AA (n=40), Hispanic (n=37) and European (n=83) patients in GoCAR pre-transplant RNAseq cohort. The association of LILRB3-4SNPs with DCGL in the entire RNAseq cohort (n=170, B), AA population by RNA sequencing (n=40, C) and AA population by RNA + DNA sequencing (n=83, D). Note: In (B) and (C), “Risk” group represents the patients with AEF ≥ mean(AEF). In (D), “Risk” group represent the patients carrying LILRB3-4SNPs variant genotype determined by RNAseq or DNAseq. E) Meta-analysis of the association of LILRB3-4SNPs with DCGL in the GoCAR and SIRPA (n=54) cohorts (Cox model adjusted by APOL1 risk allele number (not available for SIRPA), donor status, donor age, DGF, ACR, post-transplant infection (not available for SIRPA), and HLA mismatch) (fixed-effect model). The hazard ratio was showed in dot with horizontal bars showing 95% CI (an arrow was shown when the line passed the axis limit). The P value in the KM survival plot was calculated by log-rank test. The full multi-variate Cox model was detailed in Extended Data Table 3 and Table S15.
Figure 5.
Figure 5.. The association of ESRD onset (the age with eGFR decline <15, ml/min/1.73 m2) with LILRB3-4SNPs
(A), APOL1 risk alleles (B) and combined genotypes (LILRB3-4SNPs +APOL1 double risk alleles) (C) of the ESRD patients in the BioMe (n=489 ESRD, left), All-of-Us (n=250 ERSD, middle) biobanks and meta-analysis on both cohorts (right) (The hazard ratio was showed in dot with horizontal lines showing 95% CI). P value and hazard ratio (HR) were calculated with cox model (versus Non-risk group: no risk allele) and the meta-analysis was conducted with fixed-effect model (Methods). APOL1 genotype: single risk allele (G0/G1 or G0/G2) and double risk alleles (G1/G1, G2/G2, or G1/G2))
Figure 6.
Figure 6.. Identification of transcriptomic signatures associated with LILRB3-4SNPs in pre-transplant blood.
A) Volcano plot of meta-DEGs (P<0.05) in the pretransplant blood from AA patients with (GoCAR, n=9; CTOT19, n=5; VericiDx, n=11) versus without (GoCAR, n=24; CTOT19, n=10; VericiDx, n=20) LILRB3-4SNPs in three blood bulk RNAseq cohorts (GoCAR, CTOT19 and VericiDx). Two-sided Z-score test was performed on combined Effect Size (EZ) comparing the profiles between SNP+ vs SNP− patients from three cohorts to identify significant meta-differentially-expressed genes, and corresponding p values were corrected by Benjamini-Hochberg method. B) Dot plot of top 20 up- and down- regulated meta genes across three bulk RNAseq cohorts (ES, effect size, P value < 0.05 from meta-analysis); C) the functional categories enriched with meta-DEGs (red: enriched with up-regulated genes, blue: enriched with down-regulated genes, P<0.05)). D) UMAP of single cell RNA sequencing of pretransplant PBMC from two patients (one with LILRB3-4SNPs risk allele and one without as non-risk) showing the cell proportion of each cell type within each sample. E) Function enrichment of genes significantly up- and down- regulated in monocytes in patients with vs without risk allele. F) Heatmap showing the log2(fold change) of representative DEGs of B cell, T cell and Ferroptosis signatures between SNP+ vs SNP− cells in each cell type. The gene-function enrichment was evaluated with one-sided hypergeometric test showing -log10(P values) in the bar charts in C and E.

References

    1. Chertow GM & Milford EL Poorer graft survival in African-American transplant recipients cannot be explained by HLA mismatching. Adv Ren Replace Ther 4, 40–45 (1997). - PubMed
    1. Ilori TO, et al. Racial and Ethnic Disparities in Graft and Recipient Survival in Elderly Kidney Transplant Recipients. J Am Geriatr Soc 63, 2485–2493 (2015). - PMC - PubMed
    1. Ng FL, Holt DW, Chang RW & Macphee IA Black renal transplant recipients have poorer long-term graft survival than CYP3A5 expressers from other ethnic groups. Nephrol Dial Transplant 25, 628–634 (2010). - PubMed
    1. Roy N, et al. Association of Recipient APOL1 Kidney Risk Alleles With Kidney Transplant Outcomes. Transplantation 107, 2575–2580 (2023). - PMC - PubMed
    1. Zhang Z, et al. Recipient APOL1 risk alleles associate with death-censored renal allograft survival and rejection episodes. J Clin Invest 131(2021). - PMC - PubMed