

Trans-ancestral rare variant association study with machine learning-based phenotyping for metabolic dysfunction-associated steatotic liver disease
- PMID: 40065360
- PMCID: PMC11892324
- DOI: 10.1186/s13059-025-03518-5
Trans-ancestral rare variant association study with machine learning-based phenotyping for metabolic dysfunction-associated steatotic liver disease
Abstract
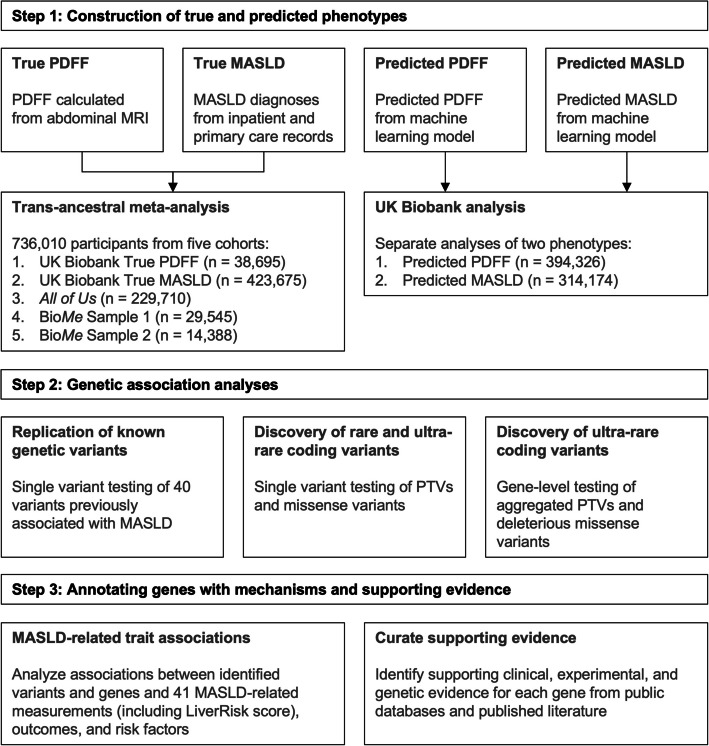
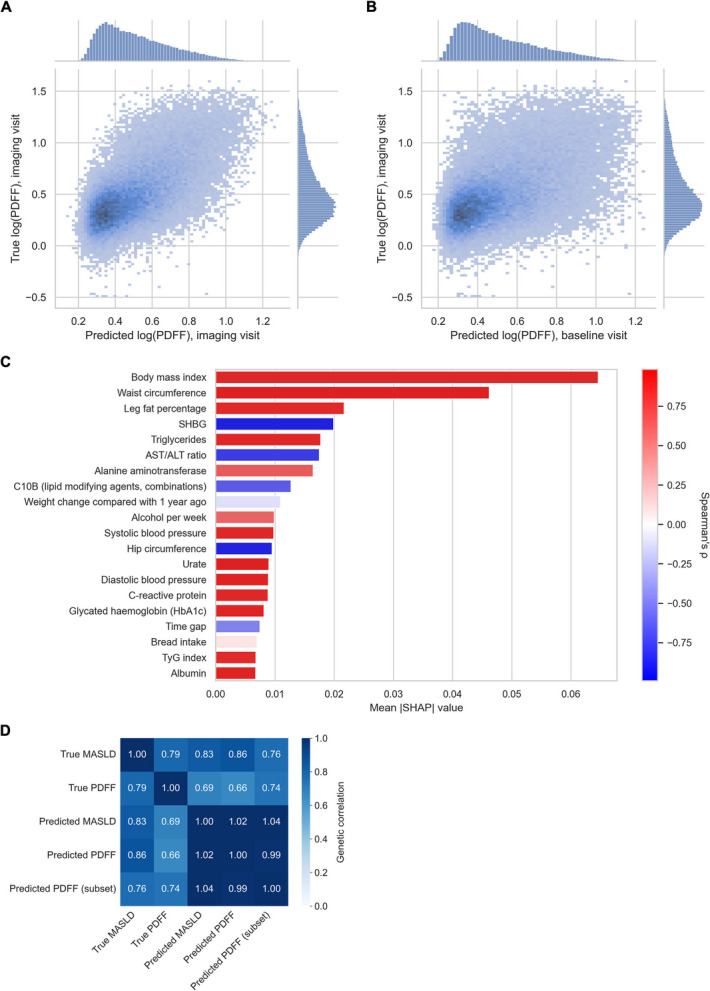
Background: Genome-wide association studies (GWAS) have identified common variants associated with metabolic dysfunction-associated steatotic liver disease (MASLD). However, rare coding variant studies have been limited by phenotyping challenges and small sample sizes. We test associations of rare and ultra-rare coding variants with proton density fat fraction (PDFF) and MASLD case-control status in 736,010 participants of diverse ancestries from the UK Biobank, All of Us, and BioMe and performed a trans-ancestral meta-analysis. We then developed models to accurately predict PDFF and MASLD status in the UK Biobank and tested associations with these predicted phenotypes to increase statistical power.
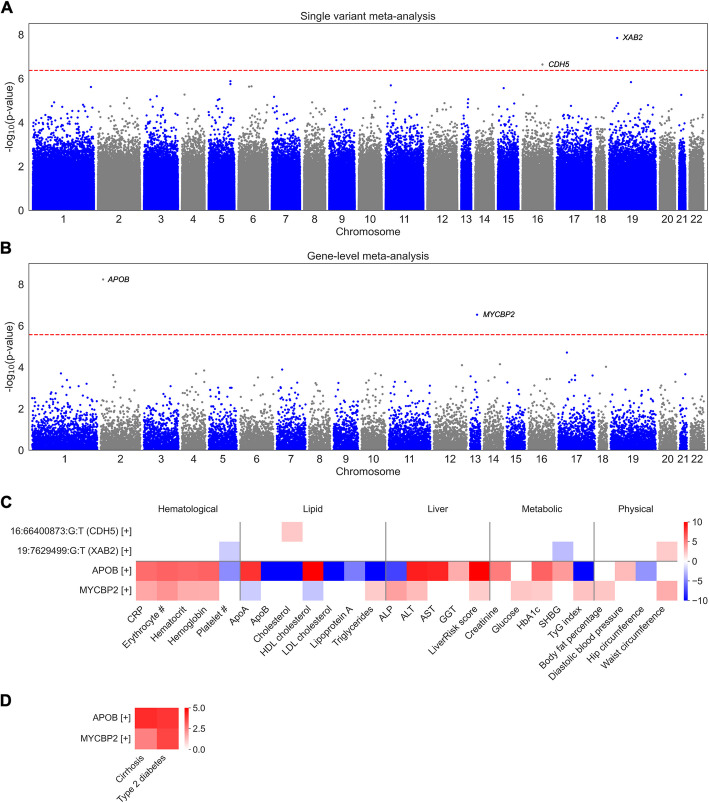
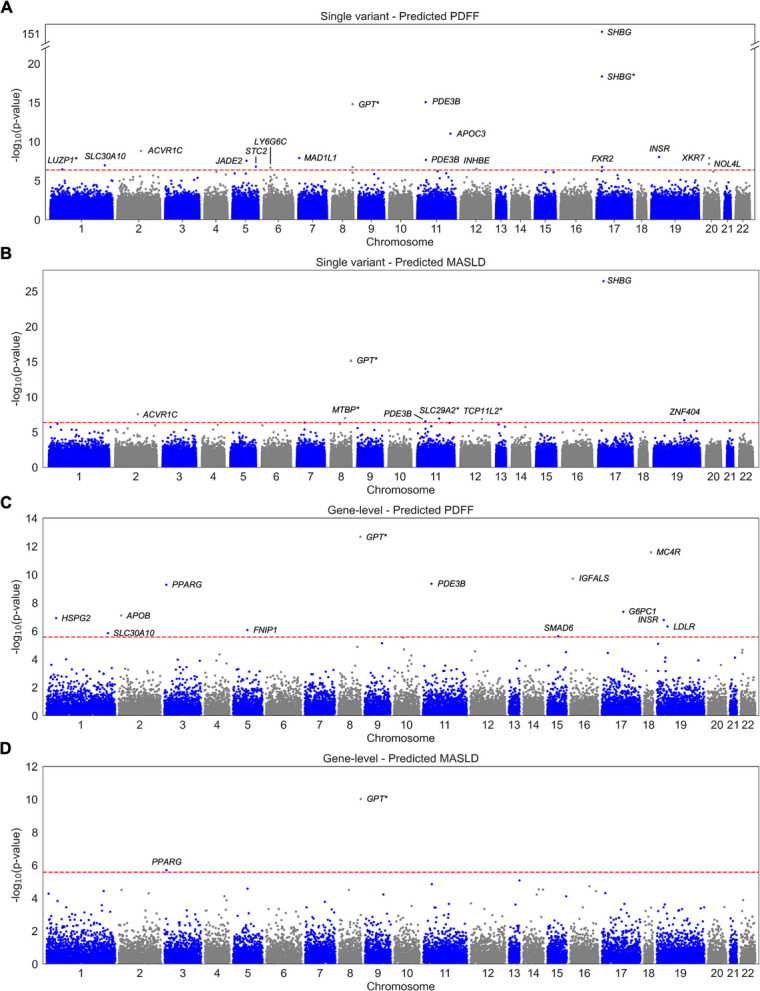
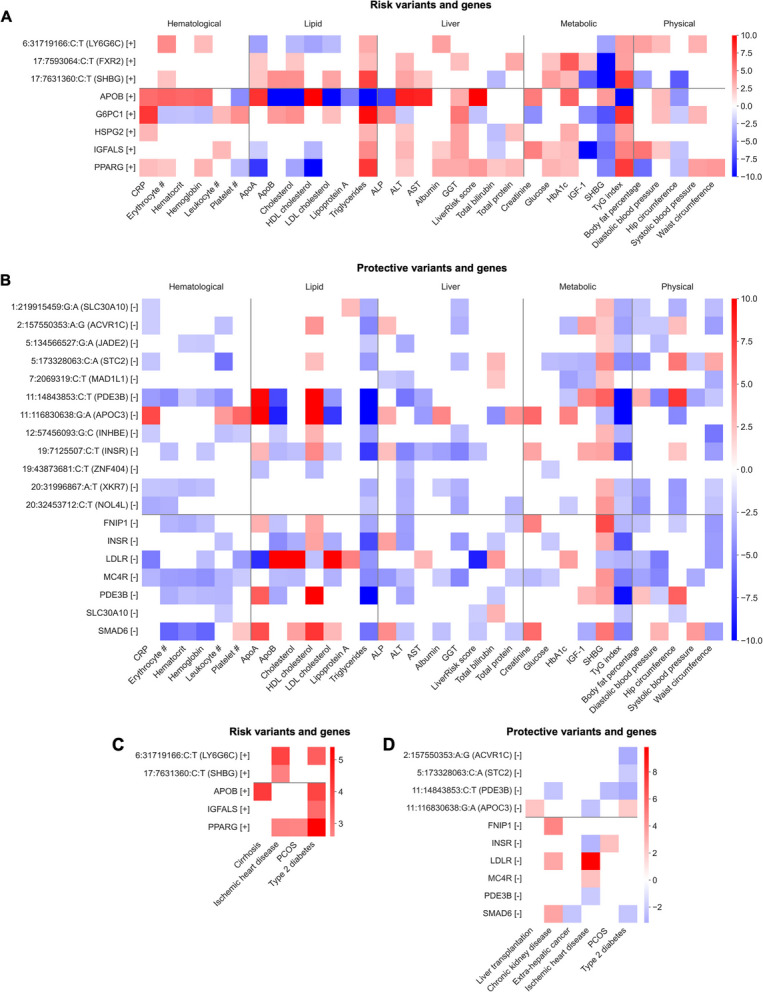
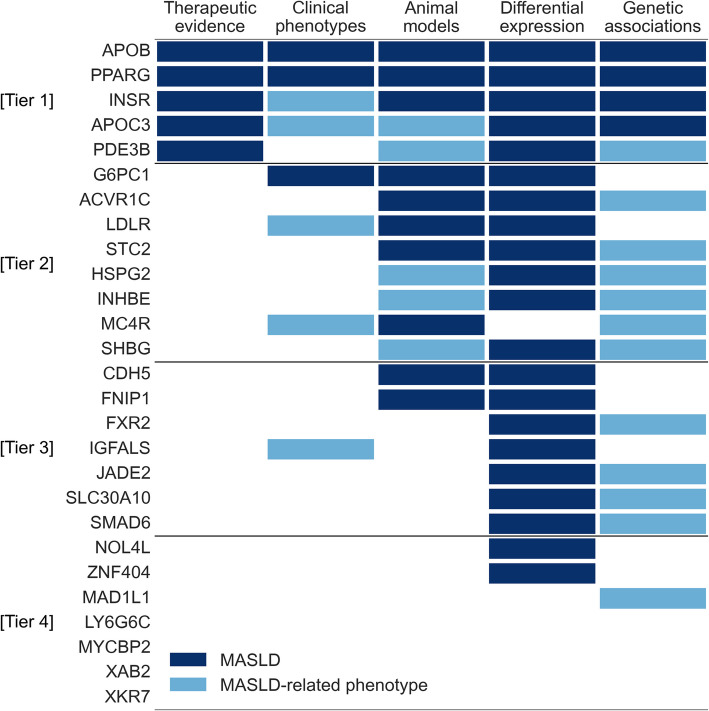
Results: The trans-ancestral meta-analysis with PDFF and MASLD case-control status identifies two single variants and two gene-level associations in APOB, CDH5, MYCBP2, and XAB2. Association testing with predicted phenotypes, which replicates more known genetic variants from GWAS than true phenotypes, identifies 16 single variants and 11 gene-level associations implicating 23 additional genes. Two variants were polymorphic only among African ancestry participants and several associations showed significant heterogeneity in ancestry and sex-stratified analyses. In total, we identified 27 genes, of which 3 are monogenic causes of steatosis (APOB, G6PC1, PPARG), 4 were previously associated with MASLD (APOB, APOC3, INSR, PPARG), and 23 had supporting clinical, experimental, and/or genetic evidence.
Conclusions: Our results suggest that trans-ancestral association analyses can identify ancestry-specific rare and ultra-rare coding variants in MASLD pathogenesis. Furthermore, we demonstrate the utility of machine learning in genetic investigations of difficult-to-phenotype diseases in trans-ancestral biobanks.
Keywords: Genetic association studies; Machine learning; Metabolic dysfunction-associated steatotic liver disease.
© 2025. The Author(s).
Conflict of interest statement
Declarations. Ethics approval and consent to participate: In all three biobanks accessed in this study (UK Biobank, All of Us, BioMe), participants voluntarily enrolled and gave informed electronic consent. We accessed UK Biobank data under application ID 16218 and All of Us data (Controlled Tier version 7) under workspace aou-rw-75979bcb. The Institutional Review Board at the Icahn School of Medicine at Mount Sinai approved BioMe access (GCO no. 07–0529; STUDY-11–01139). Competing interests: R.D. reported being a scientific co-founder, consultant and equity holder for Pensieve Health (pending) and being a consultant for Variant Bio and Character Bio. M.B. receives grant support from Pfizer and Histoindex and serves as a consultant for Madrigal, Intercept, Fibronostics, NOVONordisk, GSK, and The Kinetix Group. All other authors have no competing interests to disclose.
Figures
Similar articles
-
Genetic variants influencing liver fat in normal-weight individuals of European ancestry.JHEP Rep. 2025 May 14;7(8):101453. doi: 10.1016/j.jhepr.2025.101453. eCollection 2025 Aug. JHEP Rep. 2025. PMID: 40677695 Free PMC article.
-
Association of metabolic signatures of air pollution with MASLD: Observational and Mendelian randomization study.J Hepatol. 2025 Apr;82(4):560-570. doi: 10.1016/j.jhep.2024.09.033. Epub 2024 Sep 28. J Hepatol. 2025. PMID: 39349253
-
A functional genomic framework to elucidate novel causal metabolic dysfunction-associated fatty liver disease genes.Hepatology. 2025 Jul 1;82(1):165-183. doi: 10.1097/HEP.0000000000001066. Epub 2024 Aug 27. Hepatology. 2025. PMID: 39190705 Free PMC article.
-
Behavioral interventions to reduce risk for sexual transmission of HIV among men who have sex with men.Cochrane Database Syst Rev. 2008 Jul 16;(3):CD001230. doi: 10.1002/14651858.CD001230.pub2. Cochrane Database Syst Rev. 2008. PMID: 18646068
-
Systemic pharmacological treatments for chronic plaque psoriasis: a network meta-analysis.Cochrane Database Syst Rev. 2021 Apr 19;4(4):CD011535. doi: 10.1002/14651858.CD011535.pub4. Cochrane Database Syst Rev. 2021. Update in: Cochrane Database Syst Rev. 2022 May 23;5:CD011535. doi: 10.1002/14651858.CD011535.pub5. PMID: 33871055 Free PMC article. Updated.
References
-
- Eslam M, George J. Genetic contributions to NAFLD: leveraging shared genetics to uncover systems biology. Nat Rev Gastroenterol Hepatol. 2020;17:40–52. - PubMed
-
- Harrison SA, Bedossa P, Guy CD, Schattenberg JM, Loomba R, Taub R, et al. A phase 3, randomized, controlled trial of resmetirom in NASH with liver fibrosis. N Engl J Med. 2024;390:497–509. - PubMed
-
- Baselli GA, Jamialahmadi O, Pelusi S, Ciociola E, Malvestiti F, Saracino M, et al. Rare ATG7 genetic variants predispose patients to severe fatty liver disease. J Hepatol. 2022;77:596–606. - PubMed
MeSH terms
Grants and funding
LinkOut - more resources
Full Text Sources
Miscellaneous
